26 F. high in the Twin Cities Saturday.
26 F. average high on December 19.
30 F. high on December 19, 2014.
.8″ of snow so far in December in the Twin Cities.
7.6″ average MSP snowfall for December, to date.
5.8″ snowfall so far this winter season at KMSP.
17.5″ average snowfall for the winter season, to date.
December 20, 1989: Minnesotans are hard pressed to find snow cover across most of the state. Only good places to cross country ski are at Grand Marais and along the Gunflint Trail.

Spoiler Alert: Freakish Warmth into New Year’s Eve
Quick, what’s the number for 911? Old Man Winter is being held hostage, bound and gagged somewhere in northern Canada. The polar vortex has been frozen in place this “winter”.
I can’t believe I’m tracking the rain-snow line, still high above Minnesota, in late December. The maps look more like late March.
Why, Paul? El Nino, the Arctic Oscillation, hot air rising above the U.S. Capitol? It’s probably a combination of factors, all conspiring to keep our weather tracking in from Seattle, not the Yukon, at least through the New Year.
Many are just fine with Perpetual March, if not a wee bit unnerved.
December is running 14-18F warmer than average, statewide. For perspective: International Falls has yet to see a subzero low. The record for latest 0F low at KINL is December 20, 2001.
The average high now is 26F, but metro area highs approach 40F Tuesday & Wednesday. Christmas Eve looks dry, but a storm may push rain into the metro Christmas Day with snow central and northern Minnesota; maybe a plowable accumulation up north. If you’re traveling next Friday you’ll want to stay up on the latest.
We stay mild for 2 weeks; GFS guidance hinting at more of a polar front after January 2-3 or so; maybe a real cold front, something potentially polar. In the meantime the sheer persistence of this warm signal is amazing.
Old Man Winter has been kidnapped.
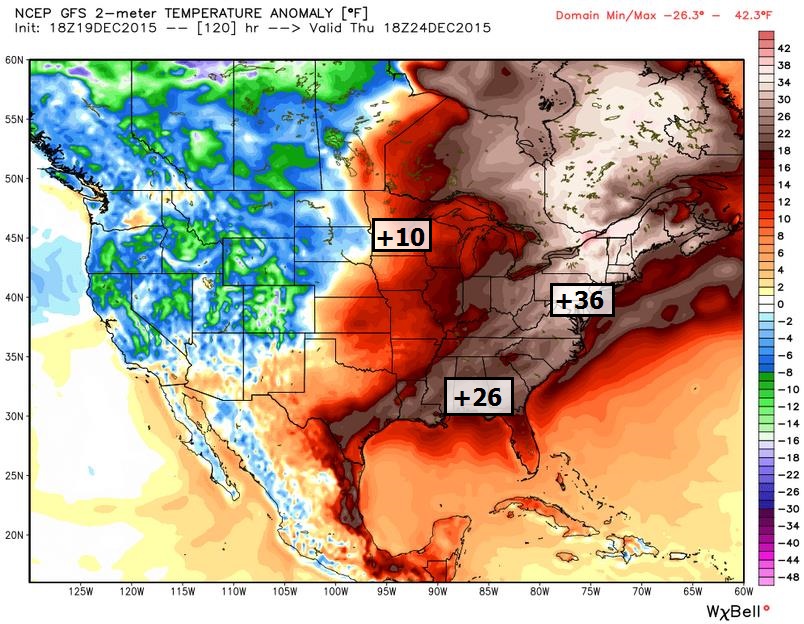
* Temperature anomaly map for 18z next Thursday (Christmas Eve) courtesy of WeatherBell.
Record-Setting December Continues. It has been a head-scratching month, more March than December. Here’s an excerpt from this week’s installment of Minnesota WeatherTalk, courtesy of Dr. Mark Seeley: “The December climate pattern across Minnesota is tracking much like November did, warm and wetter, only even more amplified. Average temperature for the month is ranging from 14 to 18 degrees F warmer than normal, and many new warm minimum temperature records have been set such as the low of 38F at MSP and 40F at Rochester on December 13th. On December 14 the temperature never dropped lower than 44F at Caledonia. A high degree of cloudiness has accompanied this warm temperature pattern, fueled by a great deal of water vapor in the air. MSP also set a new high dew point record on December 13th with a reading of 38F. Daily cloud cover has average over 80 percent for the month so far, so little sunshine has made it through...”
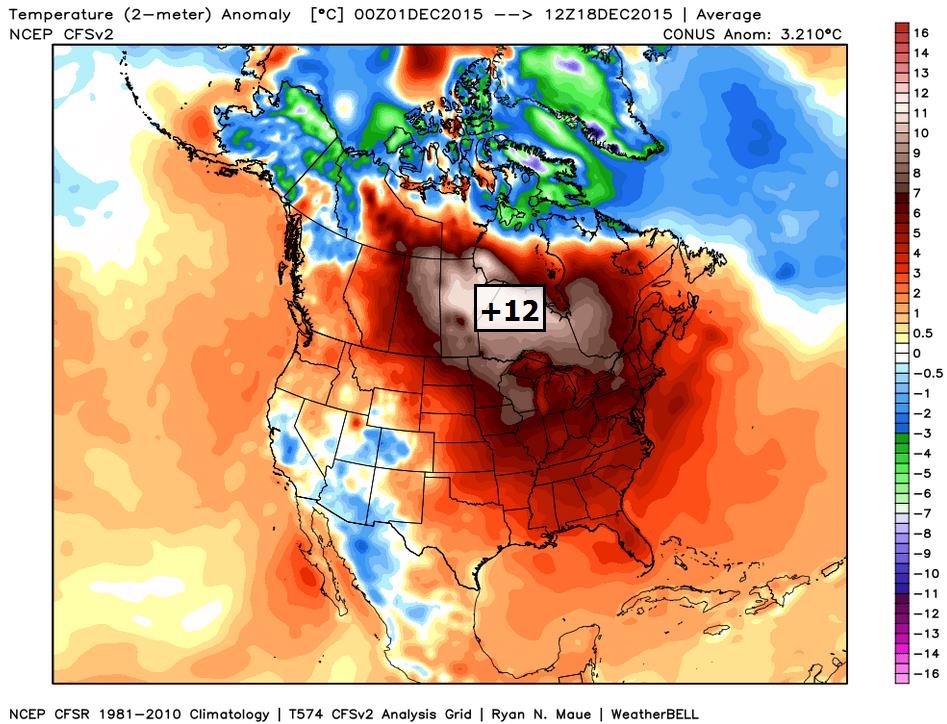
December Temperature Anomalies To Date. Over the entire “conus” of North America temperatures are running about 5F warmer than average, but as much as 20F warmer than normal over central Canada. Minnesota is about 14-17F warmer than average as of December 18. Map: WeatherBell.
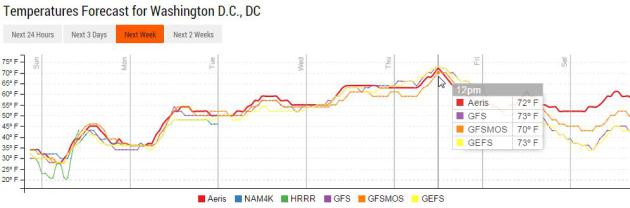
Santa May Show Up in a Red Convertible. Models show temperatures 30-40F above average for many eastern cities on Christmas Eve, peaking in the low 70s in Washington D.C. Amazing.
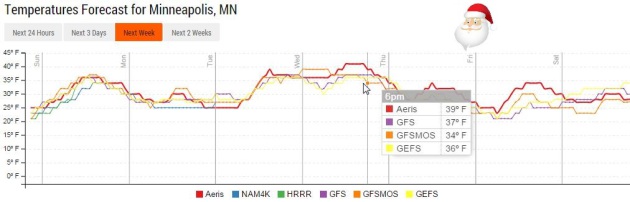
Well Above Average. Temperatures run 10 to 15F warmer than average into Christmas Day; the mildest weather midweek with highs near 40F Tuesday and Wednesday. Graphic: NOAA and Aeris Enterprise.
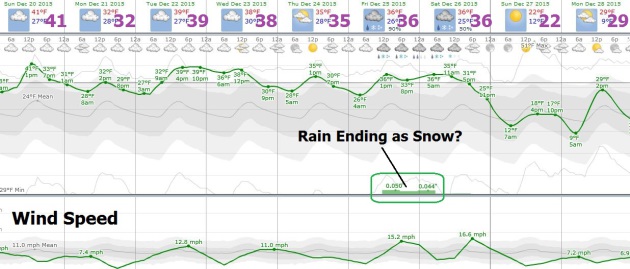
Still Tracking Mixed Precipitation Events. The best chance of precipitation comes Christmas Day; the atmosphere may be (just) mild enough aloft for rain in the metro, but ECMWF guidance hints at accumulating snow for central, northern and western Minnesota next Friday. It’s still way too early to get specific, but if you’re traveling Friday you’ll want to stay up on the latest forecasts. Map: Weatherspark.
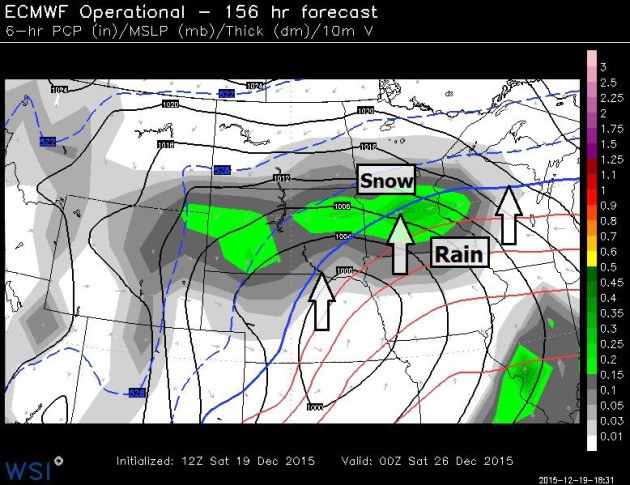
Mixed Bag Christmas Day? ECMWF (European) model data shows the rain/snow line north and west of MSP next Friday evening; a better chance of mostly snow for Alexandria, Brainerd and the Mille Lacs area, with mostly rain for the metro area. This solution will almost certainly change in the days ahead, but Christmas Day may be wet, sloppy, slush and slick, with the worst travel north and west of MSP. Source: WSI.
10-Day Snowfall Potential. Much of northern and central Minnesota will wind up with a white Christmas, at least 1″ or more of snow on the ground. The best chance of accumulating snow comes over the Rockies, the central Plains, and far northern Minnesota. Most of the lower 48 states will have a brown (or green) Christmas this year. GFS guidance: NOAA and AerisWeather.
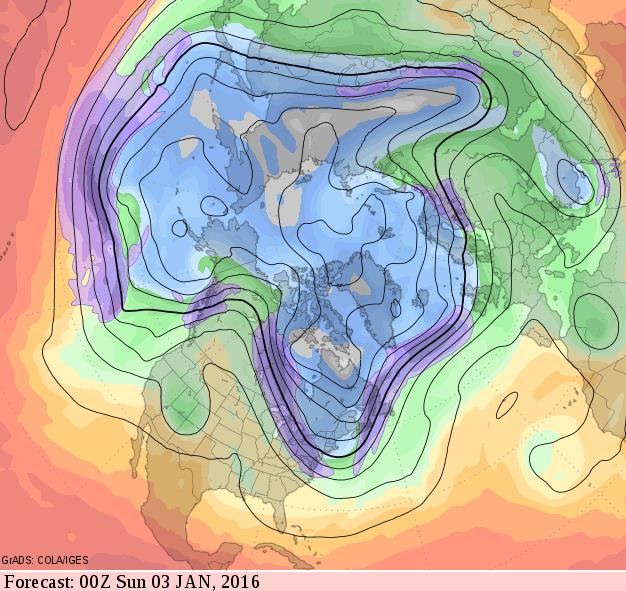
Turning Significantly Colder First Week of January? Guidance is still contradictory (big surprise) and the thrust of bitter air may be aimed at New England and the Great Lakes, but there’s a good chance of a big temperature correction (ie: polar slap) after January 2-3, 2016. Yes, we’re due.
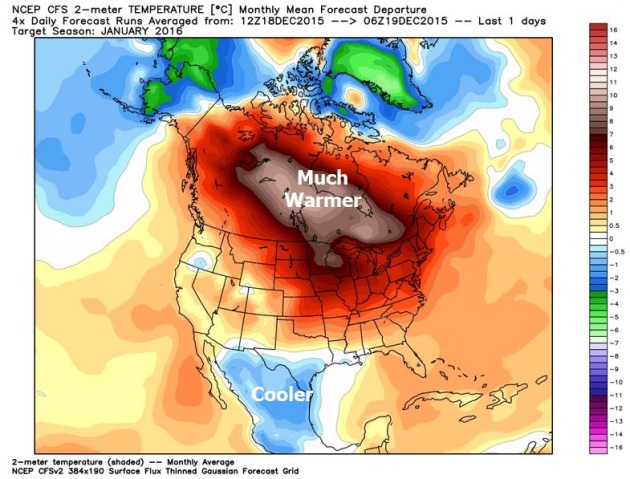
Extended Outlook: More of the Same? We’ll see more frequent outbreaks of arctic air next month, at least in theory, but NOAA’s CFSv2 (Climate Forecast System) model shows a continuation of the supernaturally mild pattern for much of North America, with the greatest warmth from the northern tier of the USA into central Canada. We’ll see, but we’ve seen record warmth every month; there’s no reason to believe this amazingly persistent pattern will suddenly reverse course in January. Map: WeatherBell.
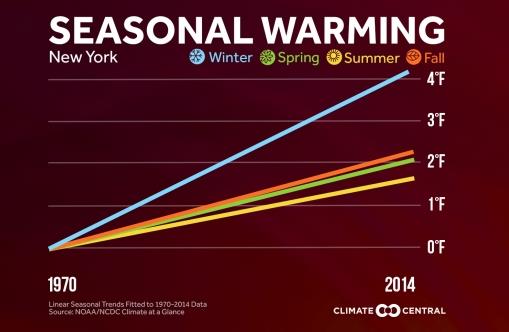
Which Season is Warming Fastest? The warming signal is showing up most vividly and consistently during the winter months. Here’s a clip from Climate Central: “…Even though these are the same areas that tend to have above average temperatures during El Niño winters, this pattern is also consistent with the long-term trend we are seeing with global warming. Winter is the fastest warming season for the majority of the U.S. The exceptions: the Northwest, where fall is warming the fastest; the Southwest where springs are experiencing their greatest rise in temperatures; and Texas, which is pushing it’s sweltering summer heat to a new level...”
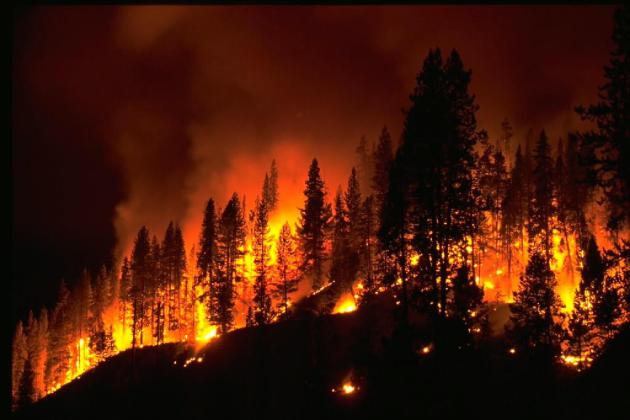
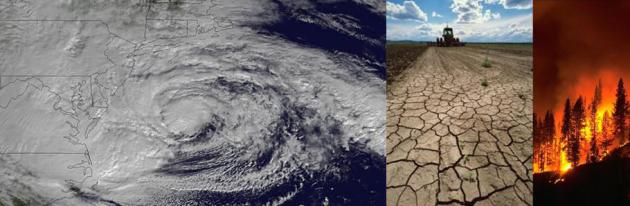
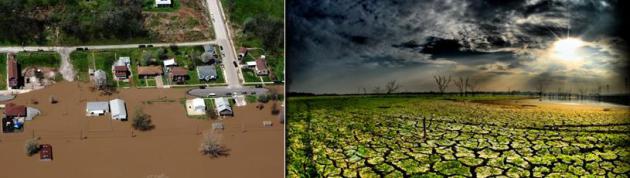
America’s 2015 Wildfire Season is Now The Most Expensive on Record. Fusion has more details on a wild fire season; here’s the intro: “America’s 2015 wildfire season is now officially the costliest on record, with $1.71 billion spent to fight blazes, the U.S. Forest Service said Wednesday according to USA Today. The wildfires, most of which hit in the drought-ravaged west, covered an area equivalent to the size of Massachusetts and Connecticut combined. Seven forest service firefighters died fighting them. The trend is expected to worsen, USDA spokesman Matt Herrick told the paper…” (File image: NOAA).
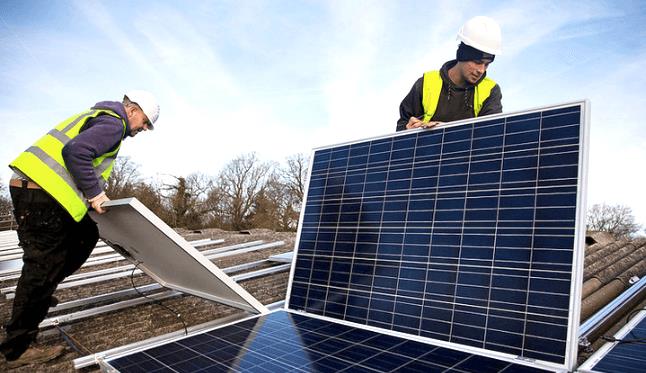
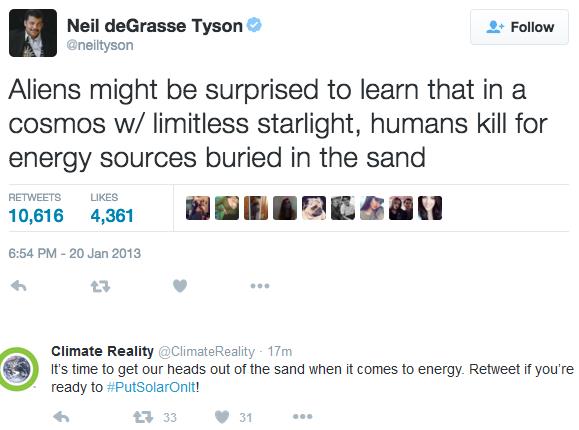
What Just Happened in Solar Is a Bigger Deal than Oil Exports. So says Bloomberg Business; here’s a clip: “The clean-energy boom is about to be transformed. In a surprise move, U.S. lawmakers agreed to extend tax credits for solar and wind for another five years. This will give an unprecedented boost to the industry and change the course of deployment in the U.S. The extension will add an extra 20 gigawatts of solar power—more than every panel ever installed in the U.S. prior to 2015, according to Bloomberg New Energy Finance (BNEF). The U.S. was already one of the world’s biggest clean-energy investors. This deal is like adding another America of solar power into the mix...” (File photo: Solar City).


Flying in the 60s. What Air Passengers Did Before In-Flight Entertainment. Oh yeah, this looks a lot like my last flight, minus the woman with the hacking cough in front of me, and the screaming kids behind me, and the mystery stains on my tray table. Here’s an excerpt of what it was like flying when flying was “cool”, courtesy of The Telegraph: “A collection of photos has shown how passengers used to pass the time on flights in the Fifties and Sixties – and it was mainly by looking dapper, drinking martinis and smoking. Geoffrey Thomas from airlineratings.com, the website which published the images, told Telegraph Travel the photos are “part of my collection that has been amassed over 40 years from now-defunct airline PR departments”. They probably went out of business when smoking on planes became illegal…”
Photo credit above: Airline Ratings Historical Collection.
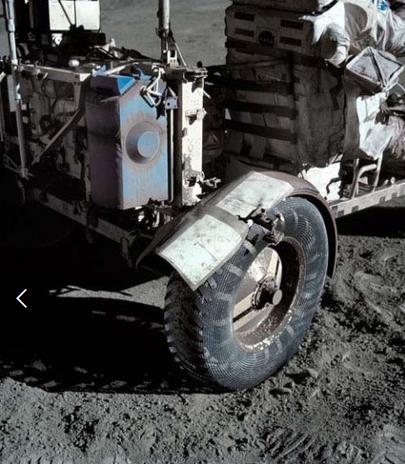
101 Gadgets That Changed the World As We Know It. Esquire reminds us about the magical qualities of duct tape. Thank you 3M. Here’s a clip: “NASA astronauts have used it to make repairs on the moon and in space. The MythBusters built a boat and held a car together with the stuff. Brookhaven National Laboratory fixed their particle accelerator with it. And enthusiasts have used it to make prom dresses and wallets. You might say it’s a material, not a gadget, but trust us: Duct tape is the ultimate multitool.”

TODAY: More clouds, milder. Winds: S 8-13. High: 39
SUNDAY NIGHT: Leftover clouds, milder than average. Low: 28
MONDAY: Mostly cloudy and cooler. Winds: NW 8-13. High: 32
TUESDAY: Overcast. Slushy mix up north? Wake-up: 26. High: 38
WEDNESDAY: AM drizzle, then drying out. Wake-up: 36. High: near 40
THURSDAY: Patchy clouds, dry Christmas Eve. Winds: W 8-13. Wake-up: 27. High: 33
CHRISTMAS DAY: Cold rain, plowable wet snow up north? Winds: SE 10-15. Wake-up: 29. High: 36
SATURDAY: Snow tapers to flurries, slushy. Winds: NW 10-20. Wake-up: 32. High: 35
Climate Stories…
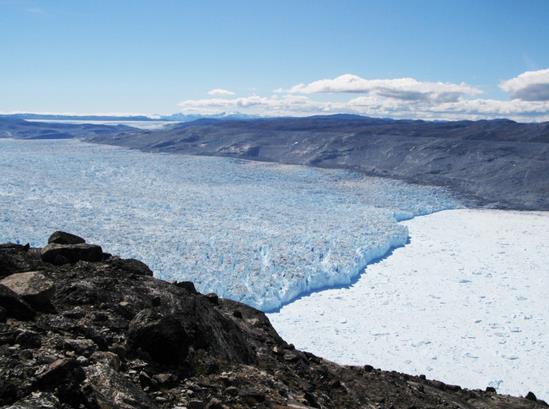
Greenland Has Lost a Staggering Amount of Ice – And It’s Only Getting Worse. Chris Mooney reports at The Washington Post; here’s the intro: “A massive new study by 16 authors has calculated just how much ice the Greenland ice sheet has lost since the year 1900. And the number, says the paper just out in the journal Nature, is astounding: 9,103 gigatons (a gigaton is a billion metric tons). That’s over 9 trillion tons in total. And moreover, the rate of loss has been increasing, the research finds, with a doubling of annual loss in the period 2003 to 2010 compared with what it was throughout the 20th century…”
Photo credit above: “Kangiata Nunata Sermia in Southwest Greenland.” (Credit: Nicolaj Krog Larsen, Aarhus University, Denmark).
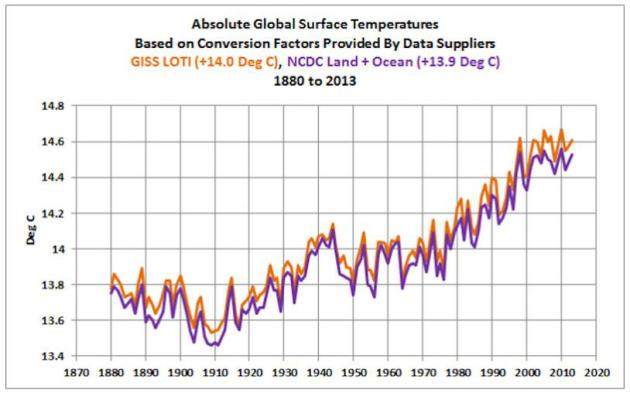
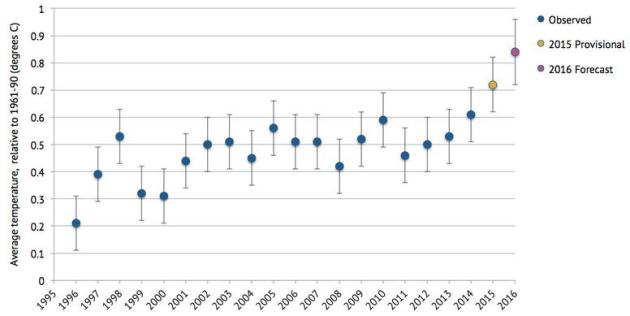
Even The Charts Used by Climate Change Deniers Show That Temperatures Are Getting Warmer. Business Insider has an interesting perspective; here’s an excerpt: “…Global temperature changes should be shown in absolute temperatures rather than high or low anomalies, which NASA GISS uses. WUWT has an interesting discussion about why the data is presented using only anomalies, and again, to its credit, the site acknowledges that because geographies range over different altitudes, and because many areas have lousy measurement stations (e.g., the Sahara), if you want to detect changes and differences in temperature, you need to take averages of the anomalies. The site also does us a huge service by recalculating the anomaly data into absolute temperatures. And guess, what? It looks like this.”
Graphic credit above: “That is a chart from a group of climate-change sceptics. And it shows global warming. Source: Bob Tisdale, WUWT.

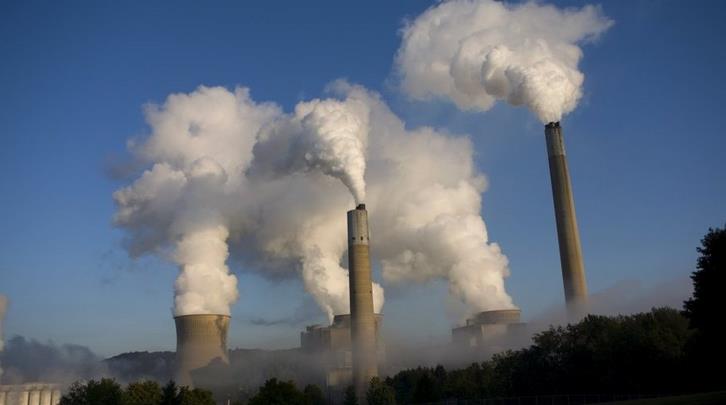
Paris Climate Deal is Great for Solar & Wind, but a $33 Billion (U.S.) Hit to Fossil Fuels. Here’s an excerpt of a story at Clean Technica: “…Energy analysts from the UK-based investment bank Barclays said the Paris deal, which aims to cap global warming well below 2°C, with an aspirational target of 1.5°C, will result in a boost to renewable energy, and will cause a rethink from investors about new investments in fossil fuel sources. Lead analyst Mark Lewis says the implications for the fossil fuel industry are profound, and will likely cause it to suffer a loss in revenue of around $US33 trillion out to 2040 over business as usual…”
Huh? Could Cleaner Air be Worsening Global Warming? Less traditional air pollution, less smog and particulant and sulfer-based haze, we may be inadvertently accelerating the rate of warming, according to new research. Here’s an excerpt of a recap at Live Science: “…What’s more, this unintentional geoengineering may have already impacted global warming, Wild said. Global temperatures held fairly constant from the 1950s to the 1980s, and warming only accelerated starting in 1985, when the global brightening seems to have begun, Wild reported in a study published this month in the journal WIREs Climate Change. He also sees evidence that this unintentional geoengineering affected the world’s hemispheres differently. Temperatures held steady until the mid-1980s in the Northern Hemisphere, where most of the world’s population lives, and spiked up sharply afterward...”
Photo credit: NPR, which has more on the role of sulfer-based pollutants screening warming here.