2.2″ snow fell at MSP International Airport yesterday.
28 F. high temperature in the Twin Cities Monday.
23 F. average high on January 10.
-1 F. maximum temperature on January 10, 2016.
January 11, 1975: A blizzard continues with hurricane force winds in southwestern Minnesota.
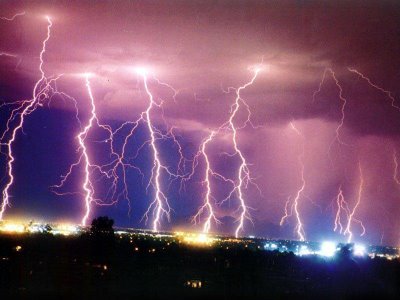
January 11, 1899: An odd flash of lightning lights the clouds up around 9 pm at Maple Plain.

Forecast: Another White-Knuckle Commute Today
For almost 30 years I’ve talked about the “Hassle Factor”. It’s not enough to tally up how much snow will fall. When will it fall, how cold is the snowfall, will it be compacted into an impassable layer of ice before rush hour?
It’s a complicated matrix of factors that determine how dreadful the impacts will be. An inch of snow at 6 AM on a workday with an air temperature of 15F creates far more problems than 6 inches of snow at 9 PM with a temperature of 30F.
According to the Minnesota DNR’s “Winter Misery Index”, which factors intensity and duration of cold and snowfall, this winter still falls into the “mild” category. The MSP metro has enjoyed 11 nights below zero so far – average for an entire winter is close to 30 nights.
No worries – be happy!
The arrival of a new Canadian Treat sets off a couple inches of powdery snow this morning. With single digit temperatures the result should be more slipping and sliding. You’ll be satisfying numb on Friday, but a slushy warm front arrives next week with a string of 30s.
Keep expectations low and you may even be pleasantly surprised!
No Need to Bury the Lead. We’ve had a few cold days, and I thought it might be appropriate to move the ECMWF 15-Day temperature forecasts for the Twin Cities to the top. I still don’t think we’re going to see a “Polar Vortex” winter even vaguely similar to 3 years ago, but after a few subzero nights it’s nice to see 8 days in a row above freezing. I guess we’ve earned this break. Graphic: WeatherBell.
Winter Weather Misery Index: This Is Still a “Mild” Winter. The arctic smacks and snow bursts have been evened out by 30s and rain. Factoring in snowfall and temperature it hasn’t been that bad, at least not yet. That said, I think we’ll at least wind up in the “moderate” range by the end of meteorological winter. Here’s an excerpt from the Minnesota DNR: “..As of January 10, 2017 the WMI for the 2016-17 winter is at 41 points: 19 points for cold, 22 points for snow. This is enough for this winter to be in the “mild” category. Fourteen more points are needed for this winter to be categorized as “moderate.” The WMI for the winter of 2015-16 finished with 47 points, enough for 2014-15 to be categorized as a “mild” winter. The WMI points for the 2015-2016 winter were 18 for cold and 29 snow: 46 points. The winter of 2016-17 should easily pass last winter in points. The WMI for the winter of 2013-14 in Twin Cities was 207 points, or in the high end of the “severe winter” category. This was the 9th most severe winter on record based on WMI points. The lowest WMI score was the winter of 2011-2012 with 16 points. The most severe winter is 1916-1917 with 305 WMI points. Note, this could also be called the “Winter Fun Index” depending on your perspective!…”

Keep Your Pets Warm and Healthy This Winter Season. An article at High Plains Journal has some very good advice: “Just because they have a fur coat does not mean your pet can endure extended time outdoors when the temperature is frigid. Dogs, like other animals, must be out of the wind and dry for the insulating properties of their coats to be effective. Dogs that evolved in warm climates have short hair coats to protect them from the sun and help them stay cool, versus dogs that evolved in cold climates and have longer hair coats. If you are cold, your short-haired pet may be cold, too. Just as people add extra layers of clothing, bump up the thermostat or throw an extra log on the fire to keep warm, pet owners must take action to ensure their four-legged friends stay warm and healthy through the winter season…”
California Firehose; More Light Snow Upper Midwest. Stare at this animation long enough and you will become hypnotized. There’s a fair amount of rain (depicted in green) in the 84-hour 12 KM NAM model guidance, considering the next week to 10 days is just about the coldest of the year for most American cities. California, afflicted with flooding rains and ridiculous mountain snowfall totals (above 10,000 feet) doesn’t really dry out until Friday. An area of light snow tracks across Minnesota and Wisconsin today; ice for Madison, but mostly rain for the Ohio Valley on south and east. Source: Tropicaltidbits.com.

 Not Quite as Dramatic as Monday. Yes, 3-4″ was a subtle (yet blunt) reminder that it can still snow, even though that means the traffic report will last 48 minutes. A series of weak, clipper-like swirls of low pressure rippling along the eastward push of colder air may drop a couple more inches of snow today with flurries returning Thursday morning. Stuff stops falling from the sky on Friday as a bubble of Canadian high pressure drifts overhead. 4 KM NAM snowfall totals: NOAA and Tropicaltidbits.com.
Late January or Early March? If the GFS verifies (it’s not impossible) relatively mild weather will linger over most of the Lower 48 states into the last week of January as a west-to-east zonal flow continues, stormy ripples swept up in the flow. This pattern would favor more major storms for California and the west, but generally smaller storms east of the Rockies.
What Is An Atmospheric River? Weather Phenomenon Hits California, Nevada with Rain, Snow and Flooding. A few interesting nuggets from International Business Times: “A not-entirely-unwelcome storm dumped heavy rain on parts of California and Nevada Sunday during part of a weather phenomenon known as an atmospheric river. Another followed close on its tail and was expected to bring up to 15 inches of rain in places like the Sierra Nevada mountains Monday. Atmospheric rivers are actually common weather patterns that occur all over the world. The term is used to describe narrow portions of the atmosphere that hold water vapor and bring rain, wind and snow as they travel. At any given moment, an atmospheric river is depositing rain or snow somewhere, according to the National Oceanic and Atmospheric Administration. Anywhere between 30 to 50 percent of the annual precipitation that occurs on the West Coast of the United States is caused by atmospheric rivers…”
Infographic credit: NOAA.

December 2016: Really Cold, Really Warm, Nearly Average. The Minnesota DNR has a very good recap highlighting just how manic last month was: -20F on December 18. One week later nearly an inch of RAIN on Christmas Day! Here’s an excerpt: “…Minnesotans are used to large variations in temperatures, but December 2016 was notable for its long streaks of warm and cold conditions: the temperatures only switched from one side of average to another two times during the month. The result of these long stretches of seemingly opposite conditions was that the month ended up pretty close to average–slightly warmer in most locations, making it 16 straight warm months Twin Cities. December was also wet enough to help the Twin Cities break its all-time annual precipitation record. What a perfect way to end such a warm, wet, and stormy year!”
Graphic credit: “December 2016 daily temperatures and departures in the Twin Cities.”
2016: Record Combination of Warmth and Moisture for Minnesota. Here’s an excerpt of an excellent review of last year, with thanks to the Minnesota Climate Office and the Minnesota DNR: “…With statewide average precipitation of 33.70 inches, and an average temperature for the year of 44.5 degrees F, this was the 2nd wettest and 5th warmest year on record for Minnesota, back to 1895. Perhaps more impressively, none of the 122 years on record have been both this warm and this wet. In other words, we have never observed this combination of warmth and moisture in Minnesota. The precipitation surplus was fueled by a very wet July through September, which ran 50% above normal statewide (even more so in southern Minnesota). Many of the other months were near normal or slightly drier than normal. Above-average temperatures, on the other hand, were spread across the calendar. Across the state, every month was warm, with the exception of April in the north, and December in the far south and southeast...”
Graphic credit: “Chart showing annual statewide combinations of average temperature and total precipitation. No year back to 1895 was both as warm and as wet as 2016.”
2016: Total of 15 Weather and Climate Disasters. Only 2011 saw more, according to NOAA NCDC: “In 2016, there were 15 weather and climate disaster events with losses exceeding $1 billion each across the United States. These events included a drought event, 4 flooding events, 8 severe storm events, a tropical cyclone event, and a wildfire event. Overall, these events resulted in the deaths of 138 people and had significant economic effects on the areas impacted. The 1980–2016 annual average is 5.5 events (CPI-adjusted); the annual average for the most recent 5 years (2012–2016) is 10.6 events (CPI-adjusted). Three new billion-dollar disaster events were added during the 4th quarter, bringing the 2016 total to 15 events. This represents the 2nd highest total number of events surpassing the 11 events observed in 2012. The record number of events in one year (since 1980) is 16, as observed in 2011…”
Climate Disasters Cost U.S. $46 Billion as Flooding Leads List. Bloomberg has more perspective on 2016’s toll: “Climate-based disasters caused $46 billion in damage and killed at least 138 in the 48 contiguous U.S. states last year, with inland flooding emerging as the costliest weather event for the first time since 1997. The number of billion-dollar occurrences was the second-highest since 1980, with one less than the 16 in 2011, according to the National Centers for Environmental Information. It was also the second warmest year behind 2012 over 122 years, and the 20th consecutive warmer-than-normal year…”
File photo: Coast Guard.
Billion Dollar Weather and Climate Disasters Since 1980. Severe storms and flooding events have been on the increase, especially since 2010, according to NOAA NCDC.
It’s Official: 2016 Was Second Hottest Year for U.S. Only 2012 was warmer. Climate Central reports: “2016 was the second hottest year for the U.S. in more than 120 years of record keeping, government scientists announced on Monday, marking 20 above-average years in a row. Every state had a temperature ranking at least in the top seven, with two, Georgia and Alaska, recording their hottest year. The announcement comes a week before the National Oceanic and Atmospheric Administration, which released the U.S. data, and NASA are expected to announce that 2016 set the record for the hottest year globally. Both the global record and the U.S. near-record are largely attributable to greenhouse gas-driven warming of the planet…”

U.S. Warns of “Imminent” Cyberattack Threat on Electric Grid. Another argument for solar, battery storage and not being totally dependent on the grid. CNET reports: “A report that Russian computer attackers had penetrated a Vermont electrical utility company may have turned out to be baseless, but the nation’s grid is in “imminent danger” of cyberattacks, the Energy Department warned Friday. “Widespread disruption of electric service because of a transmission failure initiated by a cyberattack at various points of entry could undermine U.S. lifeline networks, critical defense infrastructure and much of the economy; it could also endanger the health and safety of millions of citizens,” the DOE said in a massive 494-page report. “Also, natural gas plays an increasingly important role as fuel for the nation’s electricity system; a gas pipeline outage or malfunction due to a cyberattack could affect not only pipeline and related infrastructures, but also the reliability of the nation’s electricity system...” (Image: Department of Energy).
Solar Panels Pop Up in Northfield. Northfieldnews.com has the story: “Northfield has a new way of contributing to renewable energy, as solar panels have risen from the ground on St. Olaf land in the northwest corner of the city. The panels, which are on land leased by St. Olaf, make up five community solar gardens, as defined by Xcel Energy, and in all, produce 5 megawatts (5,000 kilowatts) of power. The site is owned and operated by BHE Renewables, which purchased it from the original developer, Geronimo Energy. The power from the gardens is purchased by Xcel Energy and added into the company’s overall power grid. To support the construction and operation of the gardens, organizations and/or residents subscribe to them. Those entities and people still buy their power regularly through Xcel, but they get credit on their power bill for the investment in community gardens...”
Photo credit: “Newly built solar gardens stand off of Hwy. 19 (330th Street West) on St. Olaf land. The site is leased by BHE Renewables, which owns and operates the gardens. The company said subscriptions to the gardens are 100 percent filled.” (Philip Weyhe/Northfield News).
The Most Solar-Friendly States in America? Greentech Media has the list and explainer: “Solar research and advocacy group Solar Power Rocks released its 2017 ranking of the states most friendly to rooftop solar Friday, based on a compilation of state renewables policies and incentives. Massachusetts retained top honors, shaking off New York and New Jersey, which had split the gold three ways last year. Eleven states earned failing grades, with Oklahoma, Alabama and Mississippi rounding out the bottom three. The ranking factors in 12 variables, including policy (like renewable portfolio standards, electricity prices, net energy metering), incentives (including tax credits, performance payments, tax exemptions), and outcomes (payback time and internal rate of return). The rankings don’t equate to the states with the most solar; they capture the states with the policy framework most amenable to customers putting solar on their roofs…”

Great River Deal Will Boost Wind Power Capacity by 65 Percent. The Star Tribune reports: “Great River Energy, which provides energy to Minnesota electric co-ops, has inked a new wind power purchase agreement that will increase its wind generation capacity by about 65 percent. Maple Grove-based Great River announced Monday it recently signed an agreement with Florida-based NextEra Energy Resources for a new wind plant with a capacity of 300 megawatts, enough power for 120,000 homes when the wind is blowing. The Emmons-Logan wind project in south central North Dakota will include 133 wind turbines and is slated to come online in 2019. With the new project, Great River’s wind power capacity will top 700 megawatts, which the company says meets or exceeds the requirements of Minnesota’s Renewable Energy Standard...”

THURSDAY: Clouds, gusty winds. Feels like -15F. Winds: NW 10-20. High: 13
FRIDAY: Pleasantly numb. Bright sun, feels like -25F early. Winds: SE 5-10. Wake-up: -9. High: 5
SATURDAY: Early flurries, then partial clearing. Winds: SW 5-10. Wake-up: 0. High: 21
SUNDAY: Peeks of sun, feels better out there. Winds: SW 5-10. Wake-up: 10. High: 29
MONDAY: Relatively mild. Icy mix late? Winds: SE 3-8. Wake-up: 15. High: 33
TUESDAY: Mostly cloudy and mild, a little drizzle. Winds: E 5-10. Wake-up: 23. High: 35
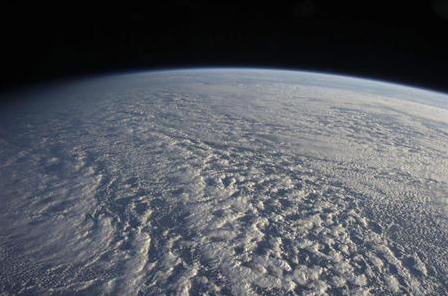
One Year From Today We’ll Have Blown the World’s Entire Carbon Budget. Here’s an excerpt from Co.Exist: “As of now—by the least optimistic calculations—the world has one year to stop pumping CO2 into the atmosphere if we want to stop climate change at 1.5 degrees Celsius of warming, the aim of the Paris climate agreement. A carbon countdown clock from researchers at the Mercator Research Institute on Global Commons and Climate Change does the math, estimating the time left at current emission levels. Even with a higher limit of two degrees of warming and the most optimistic projections, we still only have about 23 years to fully transition to a carbon-free economy…”
Image credit: NASA/Goddard Space Flight Center/Flickr
Methane May Not Last As Long in the Atmosphere, But It Drives Sea Level Rise for Centuries. Chelsea Harvey has the story at The Washington Post: “…A new study in the journal Proceedings of the National Academy of Sciences, written by Solomon and colleagues Kirsten Zickfeld of Simon Fraser University and Daniel Gilford of MIT, underscores the fact that even greenhouse gases that don’t last long in the atmosphere — methane, for instance — can have centuries-long impacts on the expanding oceans. So although the atmospheric warming they cause may taper off comparatively quickly after their emissions are halted, their effects in the oceans are much longer-lived. “The ocean never forgets — that’s the essential message of this paper,” Solomon said. The researchers used a climate model to examine the effect of various greenhouse gases on thermal expansion in the oceans. They started with a “business-as-usual” scenario, which assumes high emissions into the future. They applied this scenario to emissions of carbon dioxide, methane, nitrous oxide and various halocarbons, a group of chemicals including the chlorofluorocarbons and hydrofluorocarbons...” (Image credit: NASA).
U.S. Should Pursue Controversial Geoengineering Research, Federal Scientists Say for First Time. Because the world’s governments aren’t moving fast enough. Here’s an excerpt from AAAS at Science: “The U.S. government office that oversees federally funded climate research has recommended studies into two areas of geoengineering research, marking the first time scientists in the executive branch have formally called for studies in the controversial field. The move, part of a climate science planning report sent today to Congress, will likely further normalize discussion of deliberate tinkering with the atmosphere to cool the planet, and of directly collecting carbon from the sky, both topics once verboten in the climate science community. Yet the new endorsement of geoengineering research comes amid deep uncertainty about the direction that climate research will take under the new administration of President-elect Donald Trump. Geoengineering is discussed in just two paragraphs of the 119-page plan, which aims to set out a research roadmap through 2021…”
Photo credit: NASA/ISS Crew/Johnson Space Center.
U.S. Intelligence Study Warns of Growing Conflict Risk. Reuters has the story: “The risk of conflicts between and within nations will increase over the next five years to levels not seen since the Cold War as global growth slows, the post-World War Two order erodes and anti-globalization fuels nationalism, said a U.S. intelligence report released on Monday. “These trends will converge at an unprecedented pace to make governing and cooperation harder and to change the nature of power – fundamentally altering the global landscape,” said “Global Trends: Paradox of Progress,” the sixth in a series of quadrennial studies by the U.S. National Intelligence Council. The findings, published less than two weeks before U.S. President-elect Donald Trump takes office on Jan. 20, outlined factors shaping a “dark and difficult near future,” including a more assertive Russia and China, regional conflicts, terrorism, rising income inequality, climate change and sluggish economic growth...”
Photo credit: “A U.S. soldier walks in front of a tank at an army base in Karamless town, east of Mosul, Iraq, December 25, 2016. Picture taken December 25, 2016.” REUTERS/Ammar Awad
Vast Iceberg Poised to Crack Off Antarctica. Here’s an update from Reuters: “A vast iceberg, expected to be one of the biggest ever recorded with an area almost the size of the U.S. state of Delaware or the Caribbean island state of Trinidad and Tobago, is poised to break off Antarctica. A rift, slowly developing across the Larsen C ice shelf on the Antarctic Peninsula in recent years, expanded abruptly last month, growing by about 18 km (11 miles). It is now more than 80 km long with just 20 km left before it snaps, scientists said. “The Larsen C Ice shelf in Antarctica is primed to shed an area of more than 5,000 square km (1,930 square miles) following further substantial rift growth,” scientists at Project Midas at the University of Swansea in Wales said in a statement…”
Photo credit: “An Adelie penguin stands atop a block of melting ice near the French station at Dumont díUrville in East Antarctica January 23, 2010. Picture taken January 23, 2010.” REUTERS/Pauline Askin/File photo