
____________________________________________________
“Hurricane Nate weakens to a tropical depression”
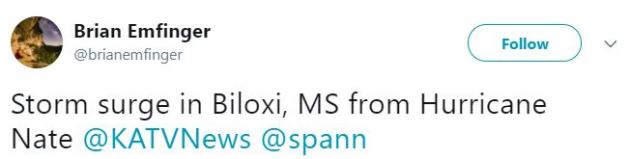
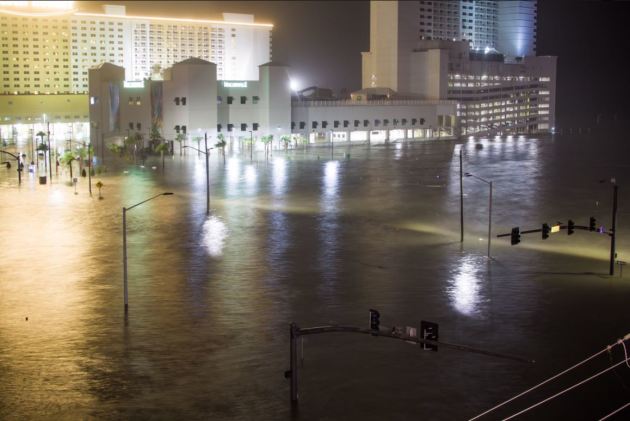
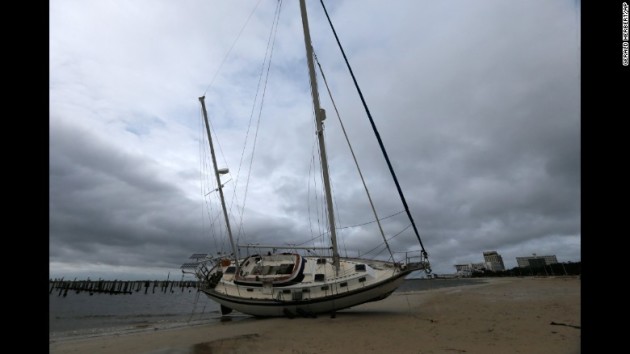
“Nate was downgraded to a tropical depression late Sunday morning as it continued to move inland, the National Hurricane Center said. The storm made its second landfall early Sunday morning as a Category 1 hurricane and had been steadily weakening ever since. Its maximum sustained winds had dropped to 35 mph, the center said, adding that elevated water levels from storm surge in areas along the Gulf coast would “gradually subside (Sunday) afternoon.”The hurricane center discontinued all warnings and advisories as a result of the weakening of the storm. Nate made its second US landfall near Biloxi, Mississippi, shortly after midnight local time Sunday as a Category 1 hurricane. Hours earlier it had made its first US landfall near the mouth of the Mississippi River in southeast Louisiana, with winds of 85 mph, according to the hurricane center. It was the first hurricane to make landfall in Mississippi since Hurricane Katrina in 2005.”
_______________________________________________________
.gif)
.png)
___________________________________________________________
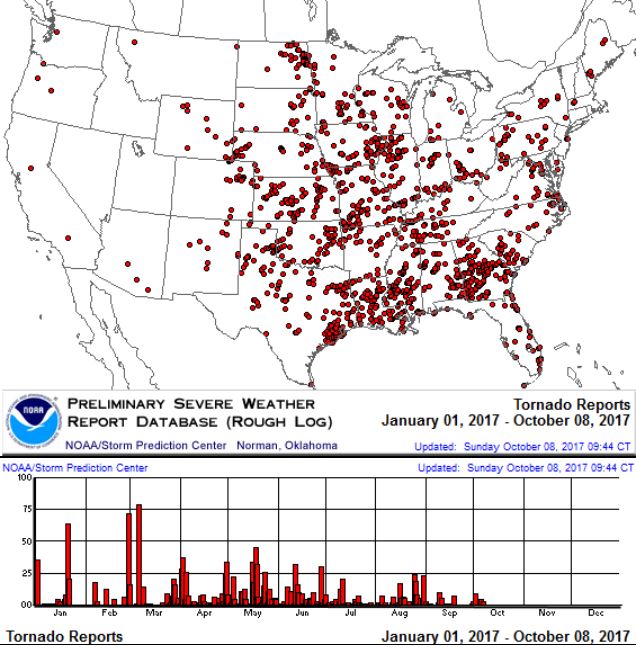
It certainly has been a fairly active first half of 2017 with 1397 preliminary tornado reports through October 6th. Note that this is the most tornadoes through that date since 2011, when there were 1,797 reports. The map below shows the distribution of the tornadoes so far this year.
PRELIMINARY 2017 Tornado Count
According to NOAA’s SPC, the PRELIMINARY 2017 tornado count is 1397 (through October 7th). Note that is the most active year for tornadoes since 2011, when there were 1,800 tornadoes. Keep in mind there was a major tornado outbreak in the Gulf Coast region from April 25-28, 2011 that spawned nearly 500 tornadoes, some of which were deadly. That outbreak is known as the Super Outbreak of 2011 and has gone down in history as one of the biggest, costliest and one of the deadliest tornado outbreaks in history.
.png)
_____________________________________________________________________
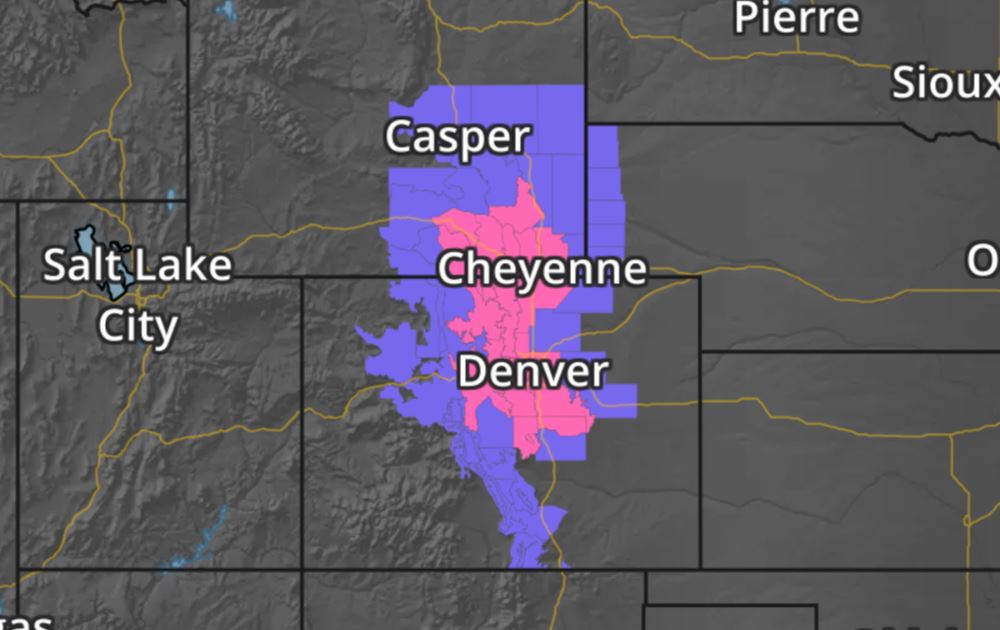
National Weather Hazards Ahead…
1.) Heavy rain from the Southern Appalachians to the Northeast, Mon-Tue, Oct 9-Oct 10.
2.) Heavy snow across portions of Colorado, Mon, Oct 9.
3.) Flooding possible across portions of the Middle Mississippi Valley, the Upper Mississippi Valley, and the Northern Plains.
4.) Flooding occurring or imminent across portions of Florida and the Southern Plains.
5.) High winds across portions of the Central Great Basin and Northern California, Mon, Oct 9.
6.) High winds across portions of Southern California, Mon-Tue, Oct 9-Oct 10.
7.) High winds across southwest portions of mainland Alaska and the western Aleutians, Thu-Fri, Oct 12-Oct 13.
8.) High significant wave heights for coastal portions of the Aleutians, Thu-Fri, Oct 12-Oct 13.
9.) Slight risk of much below normal temperatures for portions of Northern California, the Central Great Basin, the Pacific Northwest, and the Northern Great Basin, Sat-Sun, Oct 14-Oct 15.
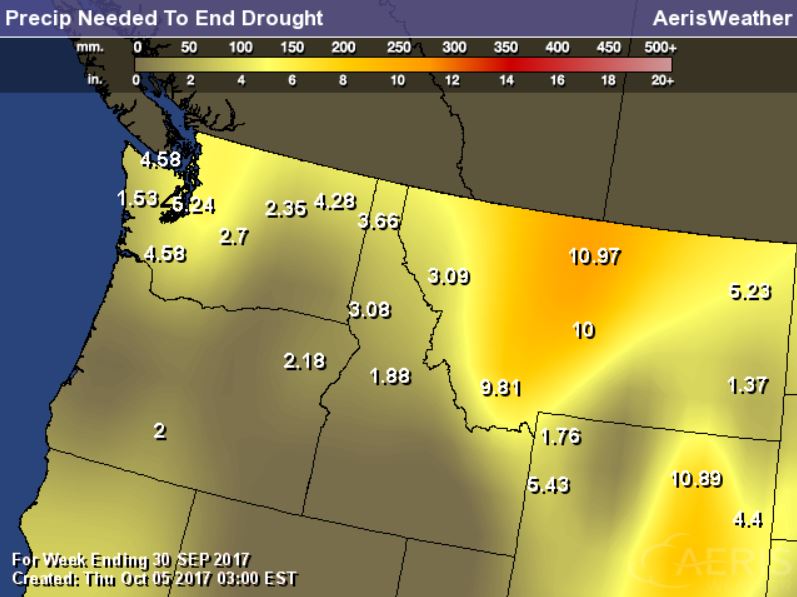
10.) Severe Drought across the Central Plains, the Northern Plains, Hawaii, the Northern Rockies, the Middle Mississippi Valley, and the Upper Mississippi Valley.
.png)
_________________________________________________________
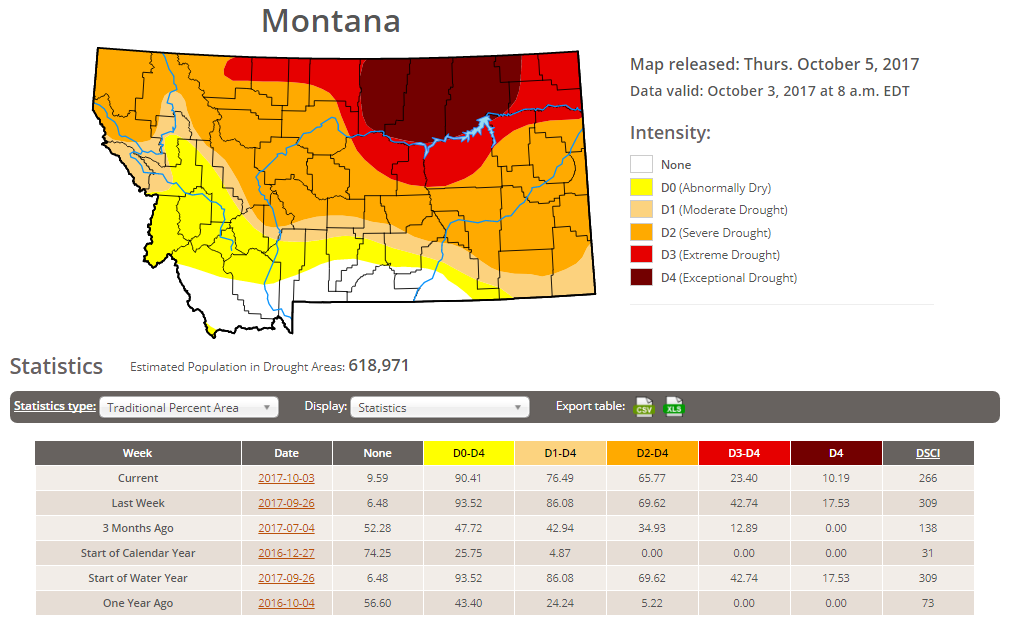
Latest Drought Monitor
Here’s the latest drought update from the US Drought Monitor, which shows EXCEPTIONAL drought conditions continuing across parts of Montana. Note that nearly 90% of the state is considered to be abnormally dry, but the EXCEPTIONAL drought covers nearly 10% of the state, which is down from nearly 18% from last week. In North Dakota, less than 1% is in an EXCEPTIONAL drought, but nearly 3% of the state is still in an EXTREME drought, which is also the same as last week.
 ____________________________________________________________________
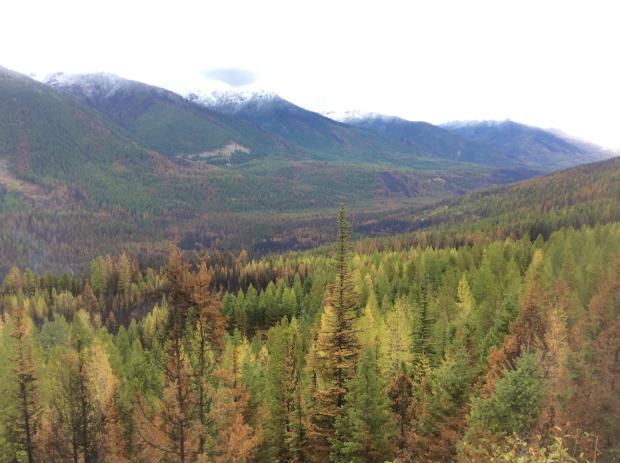
Rice Ridge Fire – 1.4 Miles NE of Seeley Lake, MT
The Rice Ridge Fire near Sleeley Lake, MT is another very large wildfire that started on Monday, July 24th due to lightning. The fire has grown to more than 160,000 acres and is 96% contained. There are 11 people working on the fire and they hope to have it fully contained by Sunday, October 15th.
“The Northern Rockies Wildland Fire Management Team is transitioning with the local Type 3 organization Tuesday Oct 3 at 6 p.m. Remaining operations will be managed by Phil Shilmerdine, Incident Commander. The Rice Ridge Fire was detected on July 24, 2017. It grew to the current size of over 160,000 acres. With a change of the weather and the onset of fall, fire activity has significantly slowed although firefighters and engines continue to patrol and cool hot spots that are near the fire’s edge. The perimeter in the Scapegoat and Bob Marshall Wildernesses are continually monitored for heat and fire activity.”
(Image Credit: Inciweb – taken on 10/3/2017)
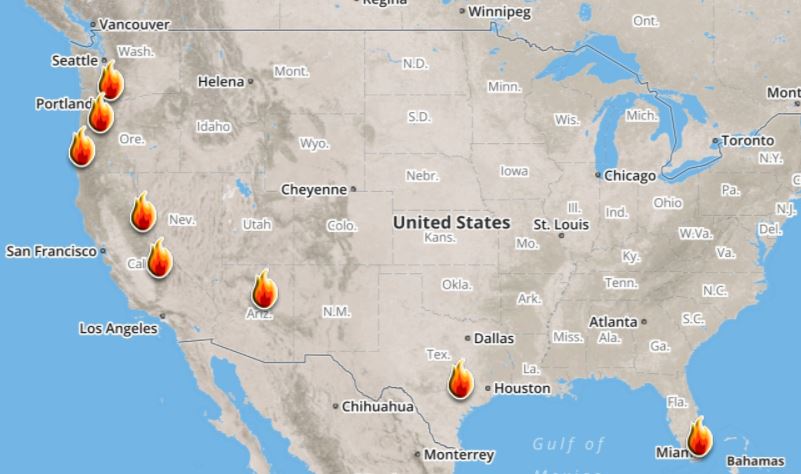
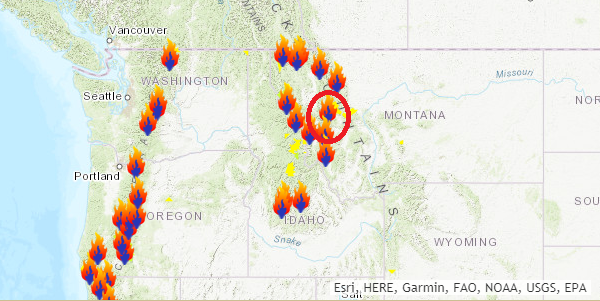 Ongoing Large Wildfires
Here’s a look at the current wildfire map across the country. While several fires are still ongoing, recent cool and somewhat wet weather has been helping curb the wildfire threat, especially in the Western US.
Here’s a list of all the current large wildfires from Inciweb:
National Weather Outlook
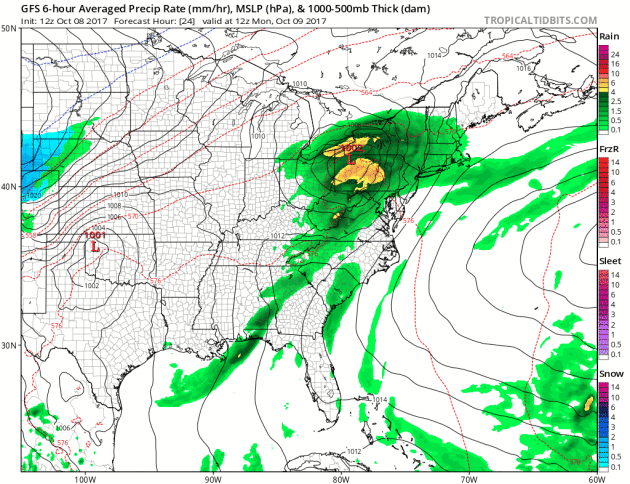
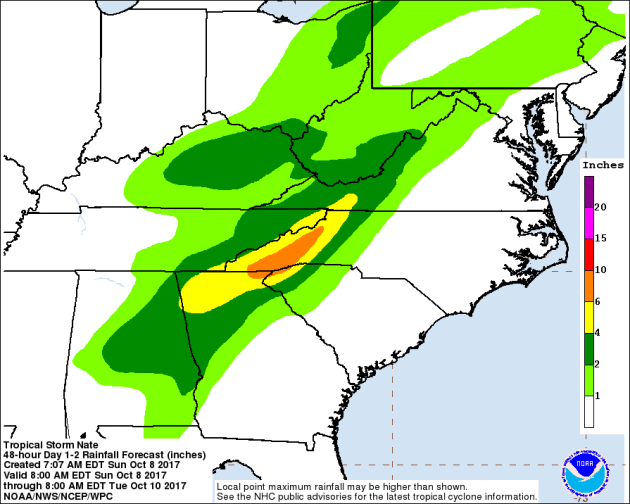
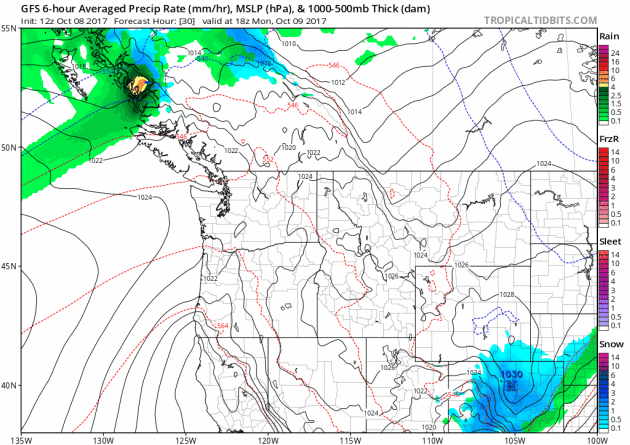
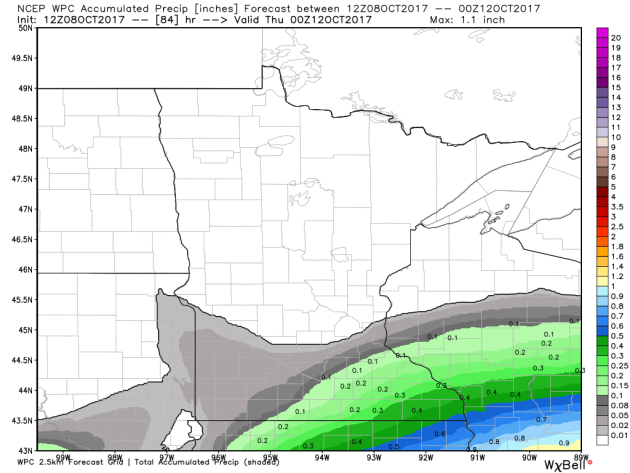
Here’s the weather outlook through the middle part of next week, which shows wet weather across the eastern half of the country as the remnants of NATE move quickly northeast through the region. Another system will continue to slide out the Rockies where winter weather headlines have been posted.
.gif)
According to NOAA’s WPC, the next several days could produce very heavy rainfall across parts of the Eastern US and the Remnants of NATE move northeast through the region. Some locations could still see 2″ to 4″+ tallies, which could lead to localized areas of flooding. There will also be heavy moisture in the Central Rockies where heavy snow will continue to fall.
.gif)
Snowfall Potential
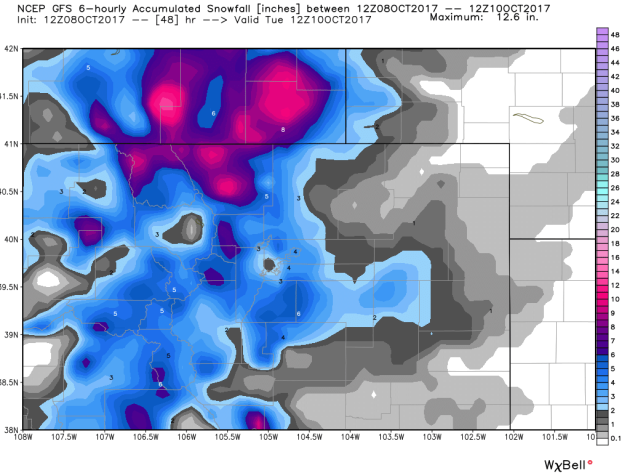
Snowfall Potential
.png)
________________________________________________________________________
By Paul Douglas
_______________________________________________________
This Day in Weather History
October 9th
1970: Montevideo sets a record low high temperature of 35.
1938: Forest fires on the 9th and 10th claim 21 lives in northern Minnesota.
________________________________________________________
Average High/Low for Minneapolis
October 9th
Average High: 61F (Record: 86F set in 1938)
Average Low: 42F (Record: 22F set in 1895)
Record Rainfall: 1.82″ set in 1904
Record Snowfall: 0.5″ set in 1925
_________________________________________________________
Sunrise/Sunset Times for Minneapolis
October 8th
Sunrise: 7:21am
Sunset: 6:38pm
Hours of Daylight: ~11 hours 17 mins
Daylight LOST since yesterday: ~3 minutes and 4 seconds
Daylight LOST since summer solstice (June 20th): 4 hours & 20 minutes
__________________________________________________________
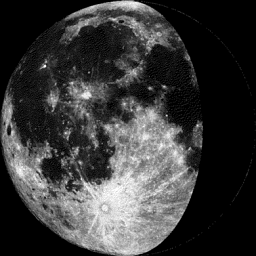
Moon Phase for October 8th at Midnight
2.2 Days Before First Quarter Moon
_________________________
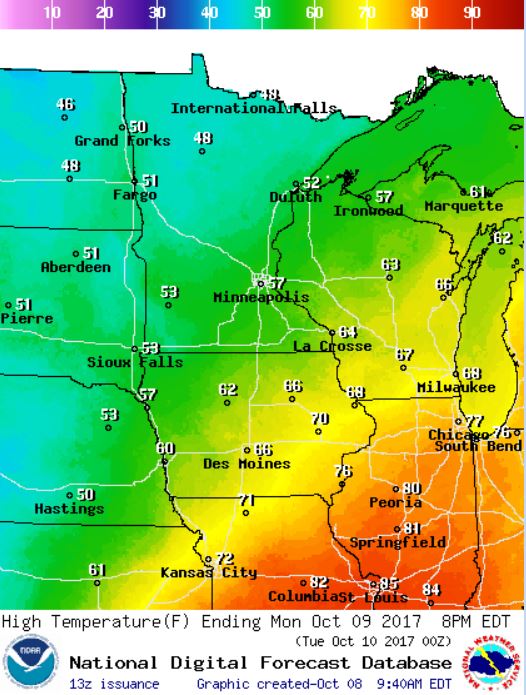
Temps on Monday will be quite a bit cooler than the were on Sunday with highs only warming into the 40s and 50s across much of the state. Note that much of the state will be a good 5F to almost 15F below average.

.gif)
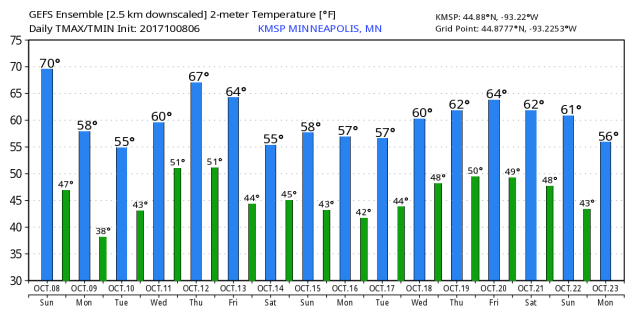
Here’s the temperature outlook through October 23rd, which shows temps bouncing around the 50s and 60s through the week ahead. There may be a couple of days through the middle part of the month when the mercury flirts with 70F once again.
.png)
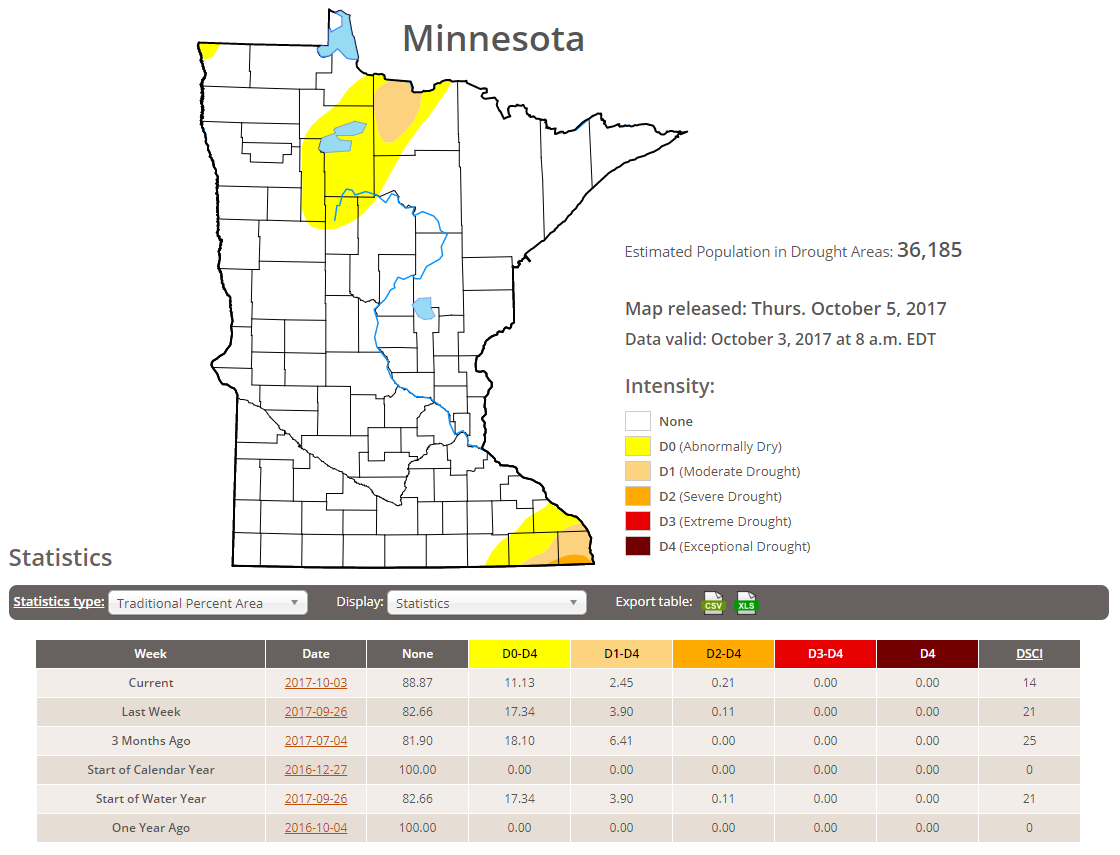
Minnesota Drought
According to the US Drought Monitor, much of the state is drought free, but nearly 11% of the state is considered to be abnormally dry with 2.5% in a Moderate drought and less than 1% in a severe drought. Not bad.
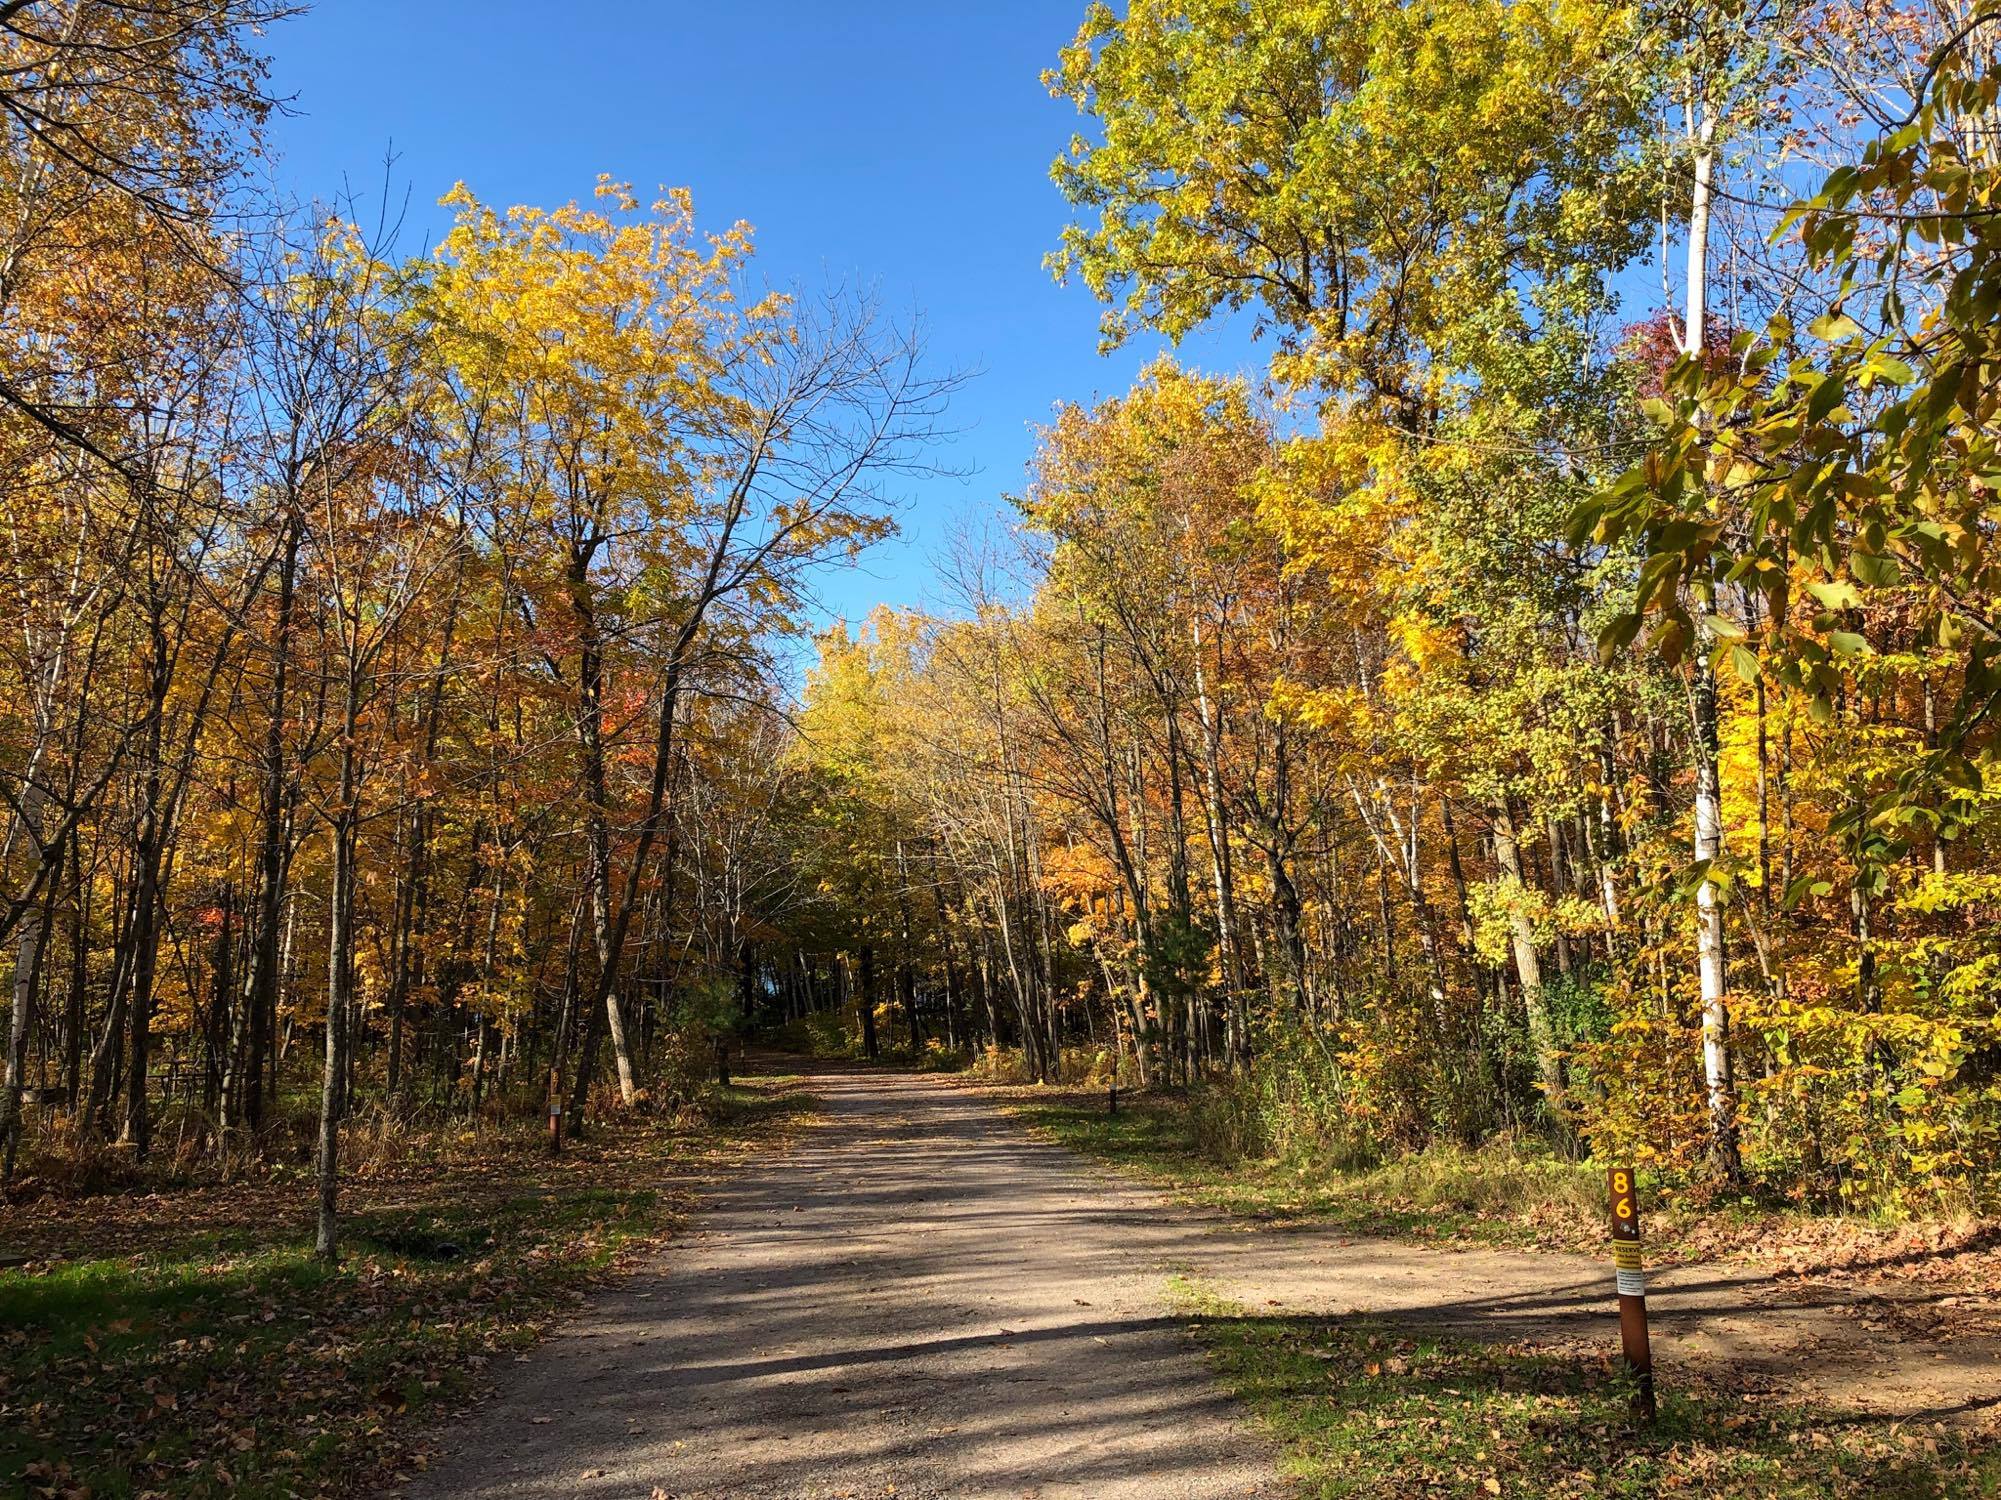
According the MN DNR, much of the state is starting to see hints of fall color, however, much of northern Minnesota is peaking right now with pockets of past peak colors!
Follow along as the fall colors change with the MN DNR map HERE:
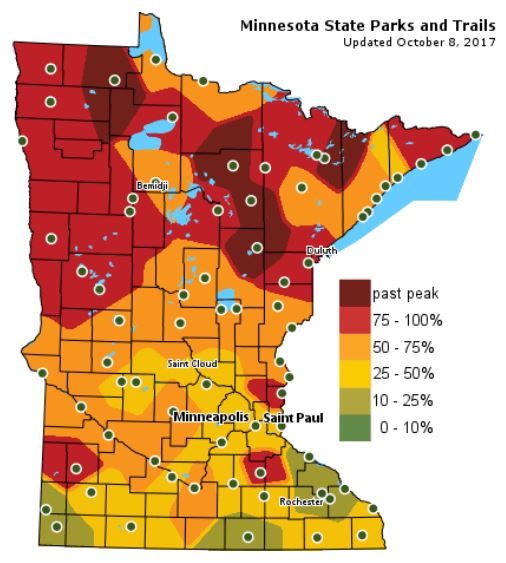
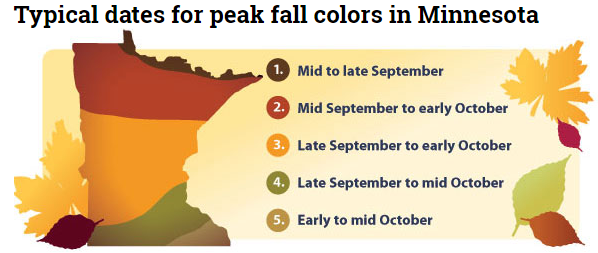
Typical Fall Color Peak in Minnesota
Here are the typical fall color peak times across the state of Minnesota and note that areas along the northern tier of the state usually see their peak toward the 2nd half of September. However, peak color usually doesn’t arrive in central Minnesota until October, but we’re getting close.
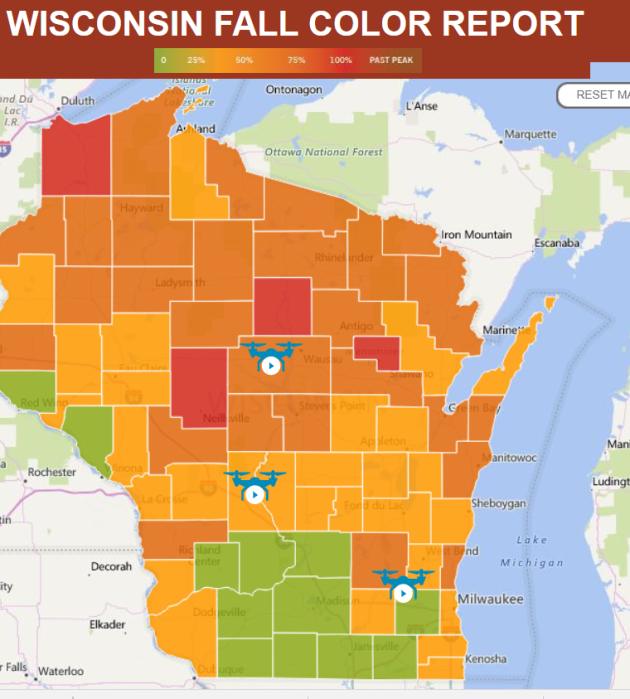
Wisconsin Fall Color Update
We’re also seeing quite a bit of color show up across the northern half of Wisconsin with many locations now nearing 50%-100% color!
See more from Travel Wisconsin HERE:
____________________________________________________________
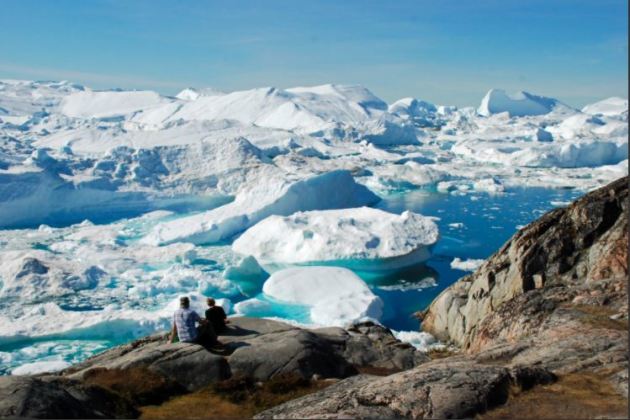
“Greenland, the world’s largest island and home to its second largest ice sheet, is a land of ragged cliffs, breathtaking fjords and unimaginable amounts of water on either side of the freezing point. It has also, until now, been something of a mystery. Greenland drew some pointed attention during the world wars and the Cold War, thanks to its strategic location. But it is only today, thanks to rapid climate change, that scientists are beginning to take the full measure of all the earth, rock and ice in a place that’s now raising seas by nearly a millimetre every single year. Two new studies of Greenland, using sophisticated technologies and large scientific teams to pull together and process the data, have now gone further in taking the full measure of the island through that ever-so-basic scientific act: mapping. The first, a comprehensive seabed mapping project, relying in part on new data from NASA’s OMG (“Oceans Melting Greenland”) mission, concludes that the Greenland ice sheet is far more exposed to the planet’s warming oceans than previously known — and has more ice to give up than, until now, has been recognized.”
See more from Vancouversun HERE:
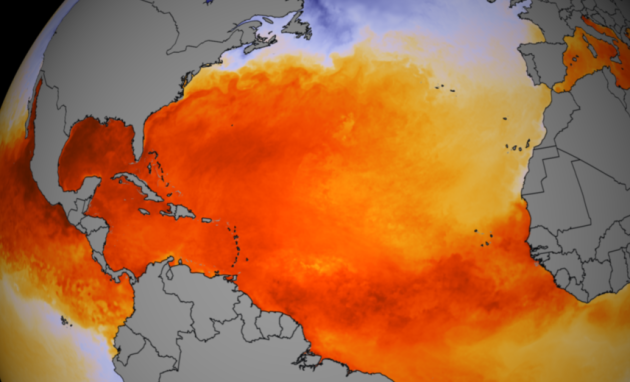
_________________________________________________________________________“The Most Powerful Evidence Climate Scientists Have of Global Warming”
“Earth’s temperature is rising, and it isn’t just in the air around us. More than 90 percent of the excess heat trapped by greenhouse gas emissions has been absorbed into the oceans that cover two-thirds of the planet’s surface. Their temperature is rising, too, and it tells a story of how humans are changing the planet. This accrued heat is “really the memory of past climate change,” said Kevin Trenberth, the head of climate analysis at the National Center for Atmospheric Research and co-author of a new paper on ocean warming. It’s not just the amount of warming that is significant—it’s also the pace. The rate at which the oceans are heating up has nearly doubled since 1992, and that heat is reaching ever deeper waters, according to a recent study. At the same time, concentrations of carbon dioxide in the atmosphere have been rising. The charts that follow show how the oceans are changing and what they’re telling us as a thermometer of global warming.”
See more from Inside Climate News HERE:
(Image Credit: NOAA)
__________________________________________________________“Watch what winds over 100 mph do to this house”
“Check out this wind test from the Insurance Institute for Business & Home Safety to see how a typical US house would hold up to winds over 100 mph.”
(Image Credit: CNN)

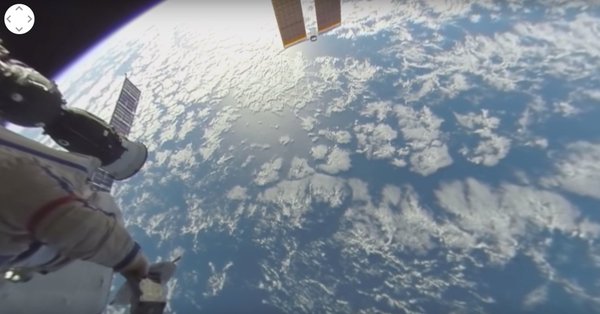
____________________________________________________________________“Watch the First-Ever 360-Degree Video of a Spacewalk!”
“In the video, produced by the Russian TV network RT (Russia Today) and collaborators, viewers can accompany cosmonauts Sergey Ryazansky and Fyodor Yurchikhin on their record-breaking Aug. 17 spacewalk as they hand-launch several nanosatellites. The full spacewalk took 7 hours and 29 minutes, making it the longest-ever Russian spacewalk, but the 360-degree video presents 3 minutes and 26 seconds of the walk’s highlights. At the video’s 1 minute 12 second mark, the cosmonauts deploy satellite Tanyusha-SWSU 2, which broadcasts greetings in Russian, English, Spanish and Chinese, according to the National Association for Amateur Radio. The nanosatellite and its companion, Tanyusha-SWSU 1, were created by students in the Russian city of Kursk. At the 2 minute 40 second mark, they send the spherical TS530-Zerkalo on its way to measure the density of Earth’s atmosphere. This satellite will help scientists predict the motion of objects in low Earth orbit, including the space station. In total, the cosmonauts deployed five satellites that day.”
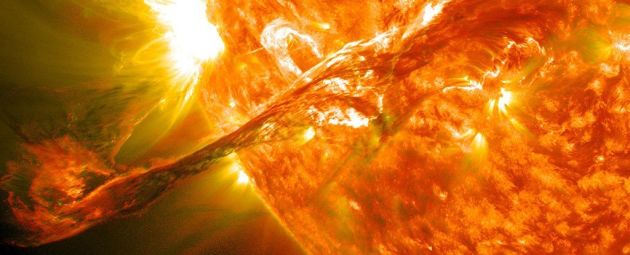
_________________________________________________________________“Scientists Are Proposing to Protect Earth From Solar Flares With a Gigantic Shield”
“In today’s modern, fast-paced world, human activity is very much reliant on electrical infrastructure. If the power grids go down, our climate control systems will shut off, our computers will die, and all electronic forms of commerce and communication will cease. But in addition to that, human activity in the 21st century is also becoming increasingly dependent upon the infrastructure located in Low Earth Orbit (LEO). Aside from the many telecommunications satellites that are currently in space, there’s also the International Space Station and a fleet of GPS satellites. It is for this reason that solar flare activity is considered a serious hazard, and mitigation of it a priority. Looking to address that, a team of scientists from Harvard University recently released a study that proposes a bold solution – placing a giant magnetic shield in orbit. The study – which was the work of Manasavi Lingam and Abraham Loeb from the Harvard Smithsonian Center for Astrophysicist (CfA) – recently appeared online under the title “Impact and Mitigation Strategy for Future Solar Flares”.”
See more from ScienceAlert HERE:
(Image Credit: NASA)
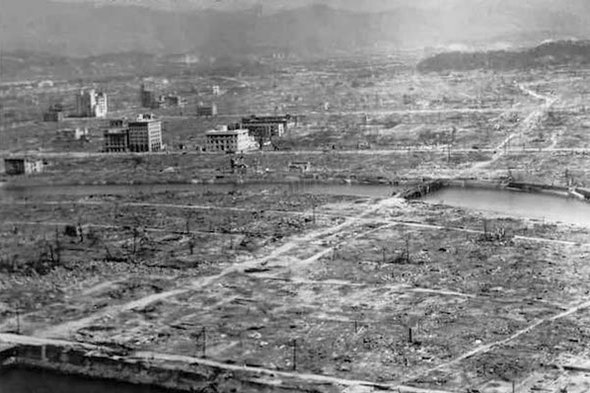
_________________________________________________________“Twins of the Apocalypse: What Hiroshima and the Climate Threat Have in Common”
“The psychiatrist who chronicled the effects of nuclear war, terrorism and genocide explores the psychological impact of a warming planet. From my interviews in Hiroshima I learned of rumors that circulated immediately after the atomic bomb struck, rumors that revealed survivors’ anxious sense of the vulnerability of their habitat. The most persistent of these rumors, and for many the most disturbing, was that trees, grass, and flowers would never again grow in Hiroshima. Because of the bomb’s “poison”—its radiation effects—the city would be unable to sustain vegetation of any kind. Nature would dry up altogether; life would be extinguished at its source. The rumor suggested a form of desolation that not only encompassed human death but went beyond it. Another rumor was that for a period of seventy-five years—or perhaps forever—Hiroshima would be uninhabitable: no one would be able to live there. Suggested here was the idea that the city itself, the habitat of all who dwelled in it, was contaminated beyond the point of sustaining human life.”
See more from Scientific American HERE:
(Credit: Wikimedia Via Scientific American)
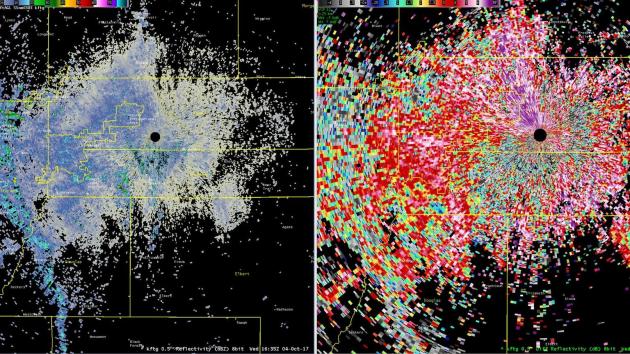
___________________________________________________________________“This 70-Mile-Wide Blob Over Colorado Turns Out to Be Migrating Butterflies”
“There’s a well-worn cinematic trope in which some foreboding object shows up on a radar screen, defying explanation. On Tuesday, this happened IRL in Colorado, when the National Weather Service (NWS) radar imagery picked up a 70-mile-wide unidentified blob hovering over the Denver metropolitan area. Based on the shape and behavior of the swarm, NWS at first guessed that it might be a flock of birds migrating south for the winter. “Look at what’s flying into Denver!” tweeted the NWS Boulder office. “Radar from last hour showing what we believe to be birds. Any bird experts know what kind?””
See more from MotherboardVice HERE:
____________________________________________________________________
Thanks for checking in and don’t forget to follow me on Twitter @TNelsonWX