66 F. high in the Twin Cities Monday (shortly after midnight).
43 mph. Peak hourly wind gust yesterday in the metro area (1:53 PM).
60 F. average high on October 12.
61 F. high on October 12, 2014.
Trace of rain fell yesterday at KMSP.
October 13, 1917: Record low temperatures occurred across central Minnesota with temperatures ranging from the low to mid teens to the upper teens and lower 20s. St. Cloud had the coldest temperature of 10 degrees Fahrenheit; likewise, Mora recorded a low of 13 degrees Fahrenheit.
October 13, 1880: An early blizzard struck southwest and west central counties in Minnesota. Huge drifts exceeding 20 ft in the Canby area lasted until the next spring.
October 13, 1820: Snowstorm at Ft. Snelling dumps 11 inches.

Better Hair Day
Metro Freeze Risk on Saturday
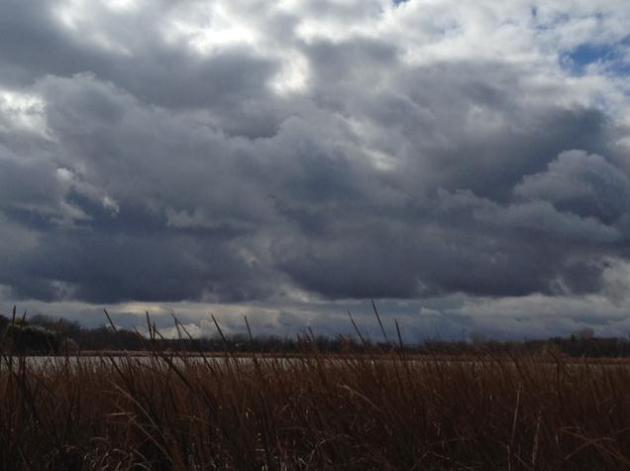
“Bad weather always looks worse through a window” wrote Tom Lehrer. The view out the Amish Doppler (window) looks considerably better than yesterday. Monday was the definition of foul, with 40-50 mph gusts and angry fits of rain. A preview of coming attractions.
People living in far western Minnesota got a rude awakening: they went from mid-90s Sunday afternoon to sleet on Monday; a wind chill dipping into the 30s. It’s amazing how quickly the sky can change in a 24-hour span. From pure magic to raw and windblown in the meteorological blink of an eye.
Welcome to the Major Leagues of Weather.
Winds ease today; enough sun for 60F. A reinforcing cool front arrives Thursday with more ragged bands of showers. Take a heavy jacket for Friday evening football games, and if skies clear and winds diminish (likely) the stage is set for the first metro frost/freeze of the season early Saturday, coming about 10 days later than average. 60s return by early next week; more lukewarm days ahead.
At least I have something to do now. If the weather didn’t change what would we talk about?
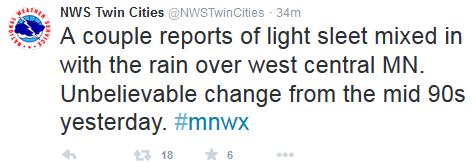
Crazy Swings. The Twin Cities office of the National Weather Service tweeted this out Monday morning; from mid-90s to rain mixed with sleet in under 24 hours. That’ll wake you up.
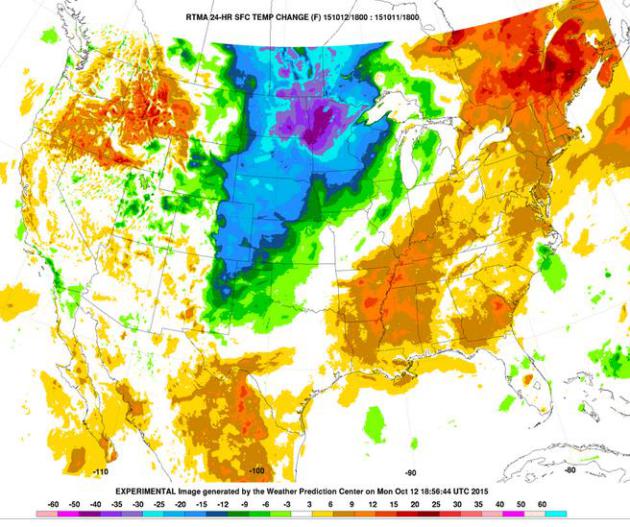
40-50F Temperature Drop in 24 Hours. Yes, we all knew it was too good to last. 50 degrees in 24 hours? That’s why the winds were howling yesterday. Map source: Twin Cities National Weather Service.
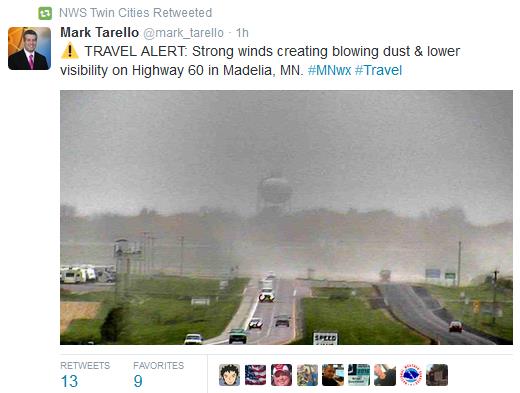
Risk of Blowing Dust. Mark Tarello tweeted this out yesterday, showing swirling clouds of dust picked up by 50-mph wind gusts near Madelia, Minnesota. Nothing more refreshing than drifting topsoil.
...STRONGEST WIND GUSTS DURING THE PAST 24 HOURS ...

LOCATION                      SPEED      TIME/DATE        LAT/LON

ALEXANDRIA AP                55 MPH    0742 AM 10/12   45.87N/95.39W
WILLMAR AP                   54 MPH    0215 PM 10/12   45.12N/95.08W
MORRIS AP                    54 MPH    0754 AM 10/12   45.57N/95.99W
APPLETON AP                  51 MPH    1234 PM 10/12   45.23N/96.00W
CANBY AP                     51 MPH    0714 PM 10/11   44.73N/96.27W
GLENWOOD AP                  51 MPH    0354 PM 10/12   45.64N/95.32W
REDWOOD FALLS AP             51 MPH    0948 AM 10/12   44.55N/95.08W
JORDAN 6 E                   49 MPH    1208 PM 10/12   44.66N/93.52W
LITCHFIELD 3 S               49 MPH    1111 AM 10/12   45.07N/94.53W
ST CLOUD AP                  49 MPH    0211 PM 10/12   45.54N/94.05W
OLIVIA AP                    48 MPH    0433 PM 10/12   44.78N/95.03W
NEW ULM AP                   48 MPH    1033 AM 10/12   44.32N/94.50W
SAUK CENTRE AP               47 MPH    0734 AM 10/12   45.71N/94.93W
ROBBINSDALE 1 WSW            47 MPH    1227 PM 10/12   45.02N/93.35W
LONG PRAIRIE AP              46 MPH    0323 PM 10/12   45.90N/94.87W
BENSON AP                    46 MPH    0134 PM 10/12   45.33N/95.66W
GRANITE LEDGE 7 N            46 MPH    0328 PM 10/12   45.90N/93.85W
PRIOR LAKE 2 WSW             46 MPH    1235 PM 10/12   44.71N/93.46W
EDEN PRAIRIE AP              46 MPH    0334 PM 10/12   44.83N/93.46W
Peak Wind Gusts Monday. The entire list from NOAA is here.
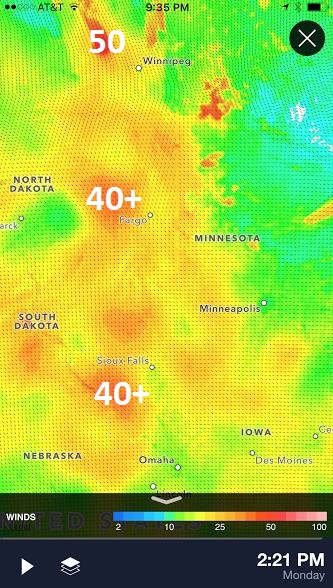
Wild Winds. Here is what I was staring at on my phone yesterday at 2:21 PM: a broad area of (sustained) 40+ mh winds from the eastern Dakotas into western Minnesota. Source: Aeris Enterprise Mobile.
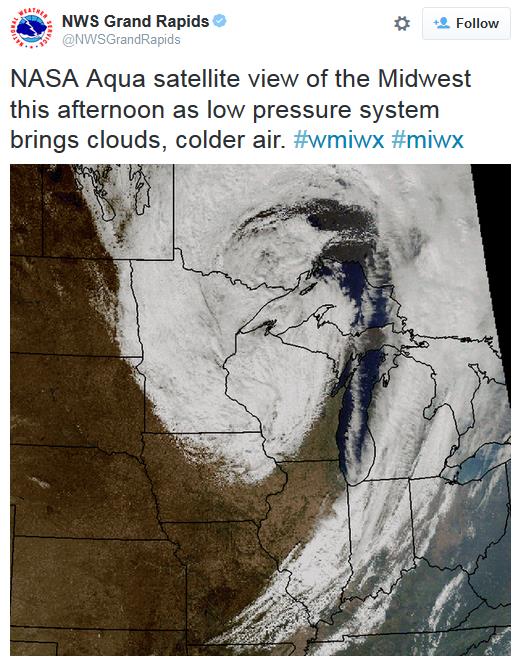
Comma Cloud. From 22,300 miles above the equator storms look like comma-shaped swirls, counterclockwise winds wrapping into the center of low pressure. Today should be an improvement over Monday. Then again just about anything would be.
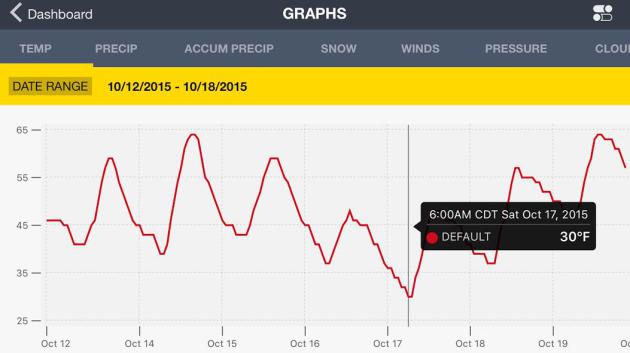
The Big Dip. We knew it was inevitable, and overdue (to the tune of about 10 days). On average the first freezing temperature at MSP International Airport takes place October 7. A model ensemble prints out a temperature of 30F at KMSP Saturday morning at 6 AM. Source: Aeris Enterprise Mobile.
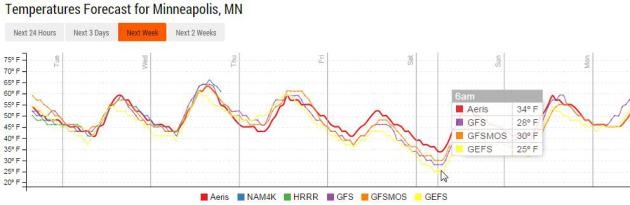
Cold Front With Urban Heat Island. Models shows temperatures close to freezing at KMSP Saturday morning, assuming light winds and clear skies. The immediate downtowns may avoid a frost/freeze, thanks to the urban heat island, but suburban areas may not be quite so lucky. Source: Aeris Enterprise.
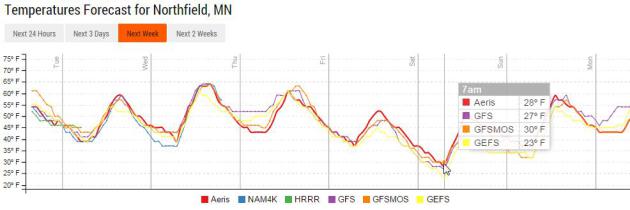
Cold Front Without Urban Heat Island. The story for Northfield (and other outlying exurbs of MSP) is a bit different, temperatures at least 5F colder than the immediate metro area, meaning a good chance of a hard freeze, defined as 3 hours or more colder than 28F, cold enough to kill off most plant life (and bugs!)
Maps Look Like October. Well it’s mid-October; the maps should probably start to look like October at some point. Winds ease today as yesterday’s tightly wrapped storm pushes east. In fact today and Wednesday look pretty nice before the next, reinforcing cold front arrives Thursday with a few showers – setting the stage for a widespread hard freeze late Friday night and Saturday morning. Source: NOAA NAM model.
240-Hour Accumulated Snowfall. NOAA’s GFS model shows a little wet snow pushing across the Great Lakes and New England; a minor slush event over the highest peaks of the Rockies. Otherwise the USA is snow-free into next Thursday, but (stating the obvious) the snow bands are edging ever closer. Source: AerisWeather.

Allergies Are Becoming More Frequent. Why? Here’s an excerpt of an interesting post from The Conversation and Huffpost Healthy Living: “…The reasons for the rising number of allergies are not fully understood, but here are six theories.
1) Decreased exposure to infections or microbes – or both – in early life could lead to an increased risk of allergy. This is commonly referred to as the hygiene hypothesis, first suggested in 1989. Research showing children who have close contact with pets or livestock and those who come from larger families are less likely to develop allergies have indirectly supported the hygiene hypothesis...”
This is the Fourth Year In A Row for a Below Average Tornado Count Across the USA. For the record: Minnesota experienced 24 tornadoes, 20 in Wisconsin – also fewer than average. Meteorologist John Belski has an interesting blog post on another mercifully-slow year for tornadoes at WLKY.com in Louisville; here’s his intro: “The tornado count across the U.S. is up this year over last. In fact this is the most active year since 2011. However, as of now the total count is still about 20% under the average. 2015 tornadoes….. The actual confirmed tornado count is 877, but that is only through July 31. The total through today is probably around 930. The long term average is 1250 to 1300 tornadoes a year in the U.S…”
Image credit: NOAA SPC.
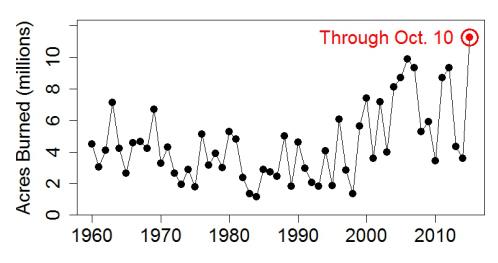
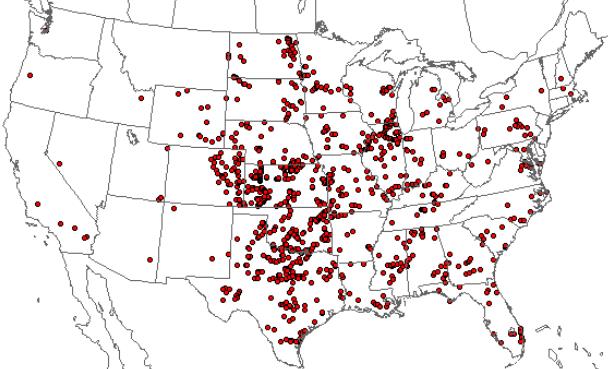
2015: Most Wildfire Acres Burned in USA – Year To Date. Perpetual drought and record heat has taken a toll, and it appears that this year has the dubious distinction of the most acres burned in the historical record. Here’s an excerpt at tamino.wordpress.com: “…Those black dots are yearly totals — the red one, circled, is only the year so far. With nearly three months to go, and October a traditionally bad fire month for California … how much worse will it get?…”
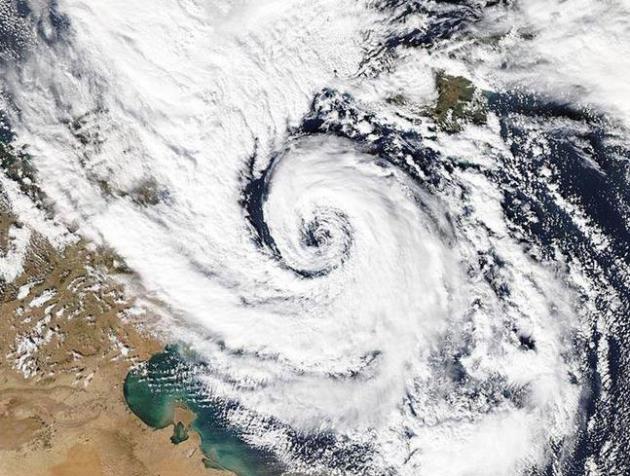
The Storm That Ravaged French Riviera. Could a hurricane spin up in a (warming) Mediterranean Sea? Tropical-storm like cyclones have spun up in the past, a hybrid weather phenomena dubbed a Medicane. Expect the unexpected. Here’s an excerpt from Gulf Times: “…To set off this chain of events, the ocean’s surface temperature has to be above 26C (79F), but in the Mediterranean the storms are slightly different. ‘Medicanes’ have been known to develop even when the sea is significantly cooler. This has prompted some meteorologists to question whether the storms really are hurricanes. Hurricanes that try to develop in the Mediterranean are also limited by space. If you compared the size of the Mediterranean to the Atlantic or the Pacific Ocean, then clearly it is tiny. It also has a large number of islands and peninsulas jutting into it. This means that it is difficult for a storm to spend a significant time over water, as would be necessary for a powerful hurricane to develop. However, despite this, occasionally hurricane-type systems have been spotted in the Mediterranean. They usually originate from other ‘regular’ storms, which then begin to feed off the warm waters of the Mediterranean and begin to take on the characteristics of a hurricane...” (November 7, 2014 file image: wunderground.com)

The World Economic Order Is Collapsing And This Time There Seems No Way Out. Here’s an uplifting story for a Tuesday – I hope he’s wrong, but under the heading of “covering my Doppler” here’s an excerpt of an Op-Ed that left me even more paranoid than usual at The Guardian: “…Yet there is a parallel collapse in the economic order that is less conspicuous: the hundreds of billions of dollars fleeing emerging economies, from Brazil to China, don’t come with images of women and children on capsizing boats. Nor do banks that have lent trillions that will never be repaid post gruesome videos. However, this collapse threatens our liberal universe as much as certain responses to the refugees. Capital flight and bank fragility are profound dysfunctions in the way the global economy is now organised that will surface as real-world economic dislocation...”


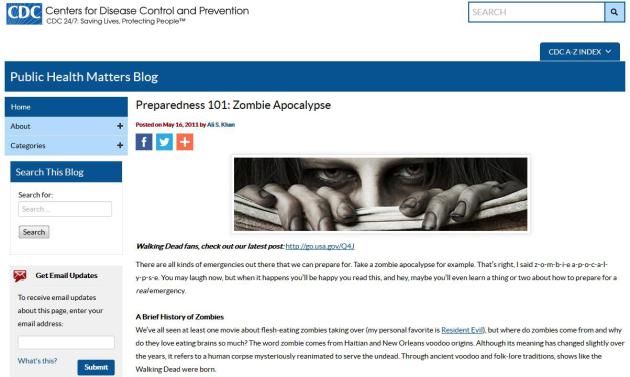
Here’s How Much a Zombie Apocalypse Survival Kit Costs. Someone at CDC has a good sense of humor. Money.com has the details; don’t say you weren’t warned: “…In an effort to promote awareness around disaster preparedness (natural and otherwise), the Centers for Disease Control put together a zombie apocalypse preparation kit that details everything you would need to have on hand in the event the living dead showed up at your front door. The practical suggestions are not much different from what the agency recommends in the event of a flood, earthquake, or other natural disaster. We took the CDC’s recommendations and a few others from ‘zombie expert’ Max Brooks, author of The Zombie Survival Guide, to price out a fairly simple emergency kit that would have you covered for almost any crisis situation…”


TODAY: Mix of clouds and sun, less wind. Winds: NW 10-15. High: near 60
TUESDAY NIGHT: Mostly clear and cool. Low: 43
WEDNESDAY: Plenty of sun, breezy. Winds: NW 10-20. High: 65
THURSDAY: Blustery & showery again. Winds: NW 15-25. Wake-up: 51. High: 57 (falling)
FRIDAY: Lingering clouds, brisk. Wake-up: 42. High: 50
SATURDAY: Early freeze. Bright sun. Wake-up: 32 (colder in the outlying suburbs). Winds: SE 3-8. High: 52
SUNDAY: Dim sun, a milder wind. Winds: S 10-20. Wake-up: 37. High: near 60
MONDAY: Partly sunny, lukewarm again. Wake-up: 49. High: 66
Climate Stories…

The Most Pessimistic Climate Change Scientist Has Had a Sudden Change of Heart. Will technological innovation and renewables trending cheaper than fossil fuels save the day? Here’s an excerpt from The Independent: “…His optimism is founded on the breakneck speed of innovation in wind and solar power in the past two to three years, which means that renewable energy is being deployed on a massive scale and, crucially, at a cost roughly comparable to fossil fuels. Only last week new figures showed that the cost of electricity produced by onshore windfarms in the UK has fallen so much that for the first time it is now cheaper than fossil-fuel energy...”
Choose Science, Stewardship in Understanding Climate Change. My friend, Chief Meteorologist Greg Fishel at WRAL-TV in Raleigh, North Carolina wrote an article explaining the evolution of his views on climate science; here’s an excerpt: “…In closing, I believe science is a gift from God. We benefit from science in our daily lives 1,000 times over through all the conveniences we enjoy. Why have we chosen to turn our back on science when it comes to basic chemistry and physics? It is time to stop listening to the disingenuous cherry-pickers and start taking responsibility for learning the truth about climate change. For those of you who are ardent skeptics, it’s going to be uncomfortable. I know, I have gone through the entire process. But in my mind, I didn’t make a mistake, I simply grew as a human being. There aren’t too many experiences in life that can top that.”
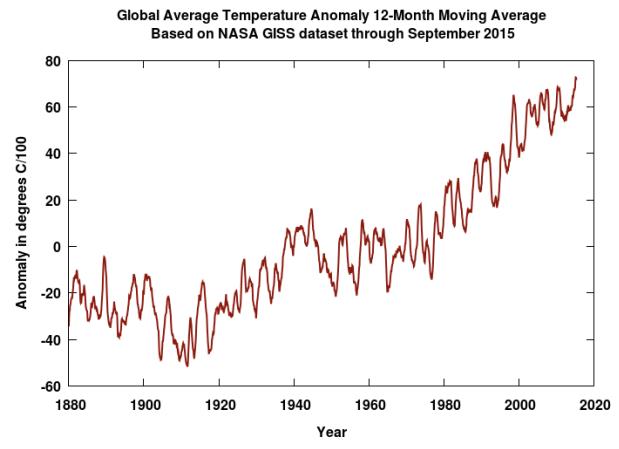
September 2015 Continues Upward Trend in Global Temperatures. Here’s an excerpt of a post from Greg Laden at scienceblogs.com: “The NASA GISS global surface measurement for September is out. I don’t know off hand if there are corrections for earlier months. The data for September show the month as the same as the earlier month, 0.81 degrees C anomaly. The current best estimate of the warming of the Earth’s surface from anthropogenic global warming, using the NASA data and a 12 month running mean, looks like this...”
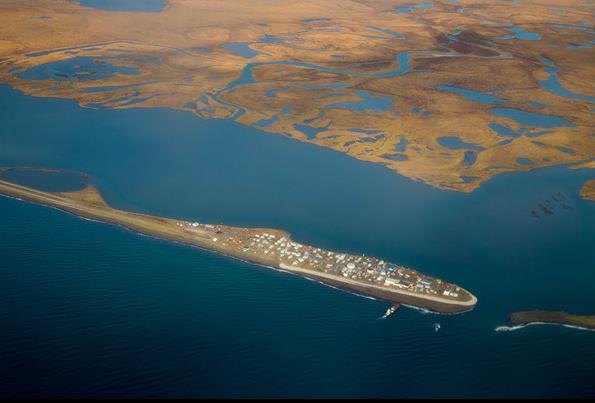
25 Million Americans Could Lose Their Homes to Global Warming. Will You? An alarmist headline? Perhaps, but the rate of sea level rise is alarming, and both Greenland and Antarctica are wild cards. Feeling lucky? Here’s an excerpt from Christian Science Monitor: “Millions of Americans could lose their homes if planet-warming emissions continue unabated through 2100, pushing global sea levels up by more than 14 feet, researchers said. In the United States, between 20 and 31 million people are living on land that would be submerged by rising oceans without aggressive cuts to greenhouse gas emissions, according to a study published on Monday in the Proceedings of the National Academy of Sciences…”
Photo credit above: “This aerial photo shows the island village of Kivalina, an Alaska Native community of 400 people already receding into the ocean as a result of rising sea levels, Sept. 2, 2015, in Kotzebue, Alaska.” Andrew Harnik/AP/File.
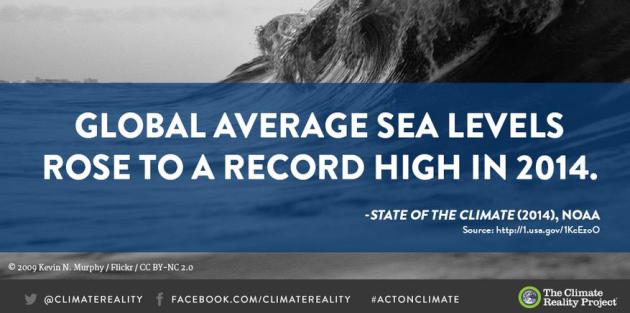
Another Marker. Warming water expands – nothing controversial about that statement. Water can’t expand downward so it rises, impacting sea level rise. This is a fairly big deal, considering 40% of the American population lives in a highly populated coastal area, and 8 of the world’s 10 largest cities are near coastline. Graphic and facts courtesy of The Climate Reality Project.
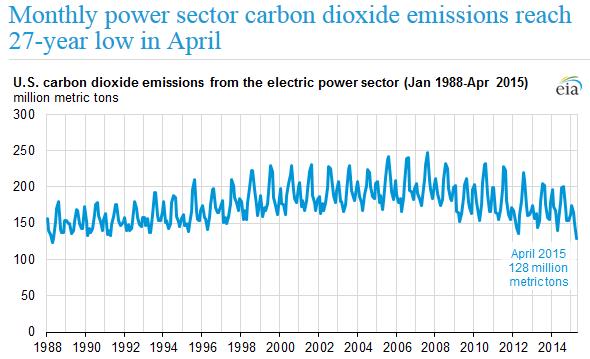
Carbon Emissions from U.S. Power Plants Hit 27-Year Low. The ship is pointed in the right direction, it seems. Here’s an excerpt from Climate Central: “As states begin the long task of reducing greenhouse gas emissions from electric power plants to comply with new federal climate policy, a 27-year low in carbon dioxide emissions earlier this year shows the U.S. may be heading toward meeting its emissions goals. U.S. power plants emitted less carbon dioxide — 128 million metric tons — in April than at any point in since April 1988, according to new U.S. Energy Information Administration data...” (Image credit: EIA).
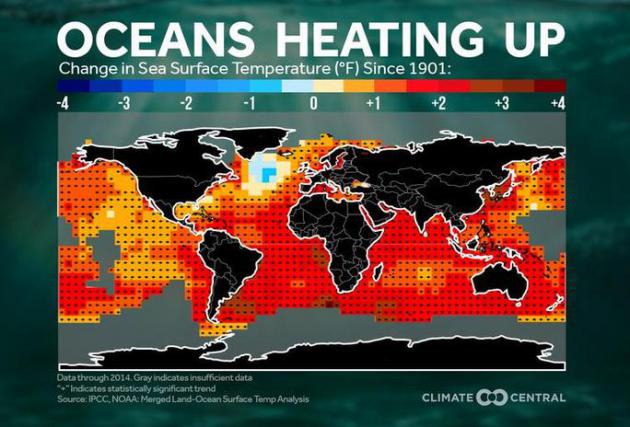
3F Ocean Water Temperature Rise since 1901. Climate Central has details: “This year is on track to be the hottest on record globally. The strong El Niño is likely playing a role as the average global temperature of an El Niño year is 0.4°F higher than a La Niña year. However, the strong El Niño is not solely responsible for the warming planet. Global temperatures have been trending upward since 1950, regardless of whether or not the Pacific Ocean was in an El Niño, La Niña, or neutral phase. In fact, La Niña years in the 21st Century are now warmer than El Niño years just 30 years ago. Similarly, the long term trend of global ocean water temperatures is on the increase, emphasizing that El Niño is only magnifying the ongoing warming trend…”
