Snow Seen From Space
Last week snowstorm brought up to a foot or more of snow to parts of the Twin Cities and surrounding areas. The heaviest was in Owatanna at 17″ !! The Twin Cities officially had 12.4″ on Monday of last week, which was the 12th greatest single day snowfall event on record! The top? 18.5″ on November 1st, 1991 (Halloween Blizzard). The snowy landscape (for some) can be seen via visible satellite from Monday, take a peek.


Snow Depth
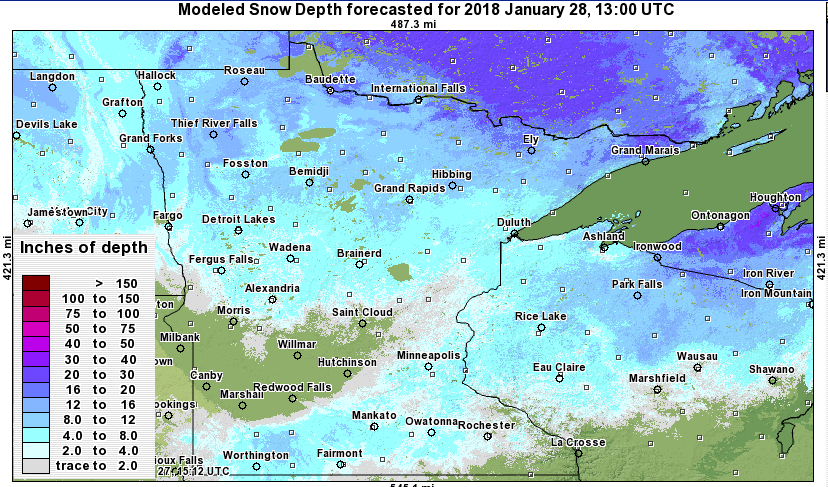
Here’s the snow depth across Minnesota and Wisconsin depicted by NOAA’s NOHRSC. Last weeks snow event is evident by the heavy snow swatch across southern Minnesota into Wisconsin. Note, however, that the heaviest snowpack is across far northern Minnesota. By the way, International Falls is reporting a snow depth of 10″, while the Twin Cities is officially sitting at 4″.
Weather Outlook
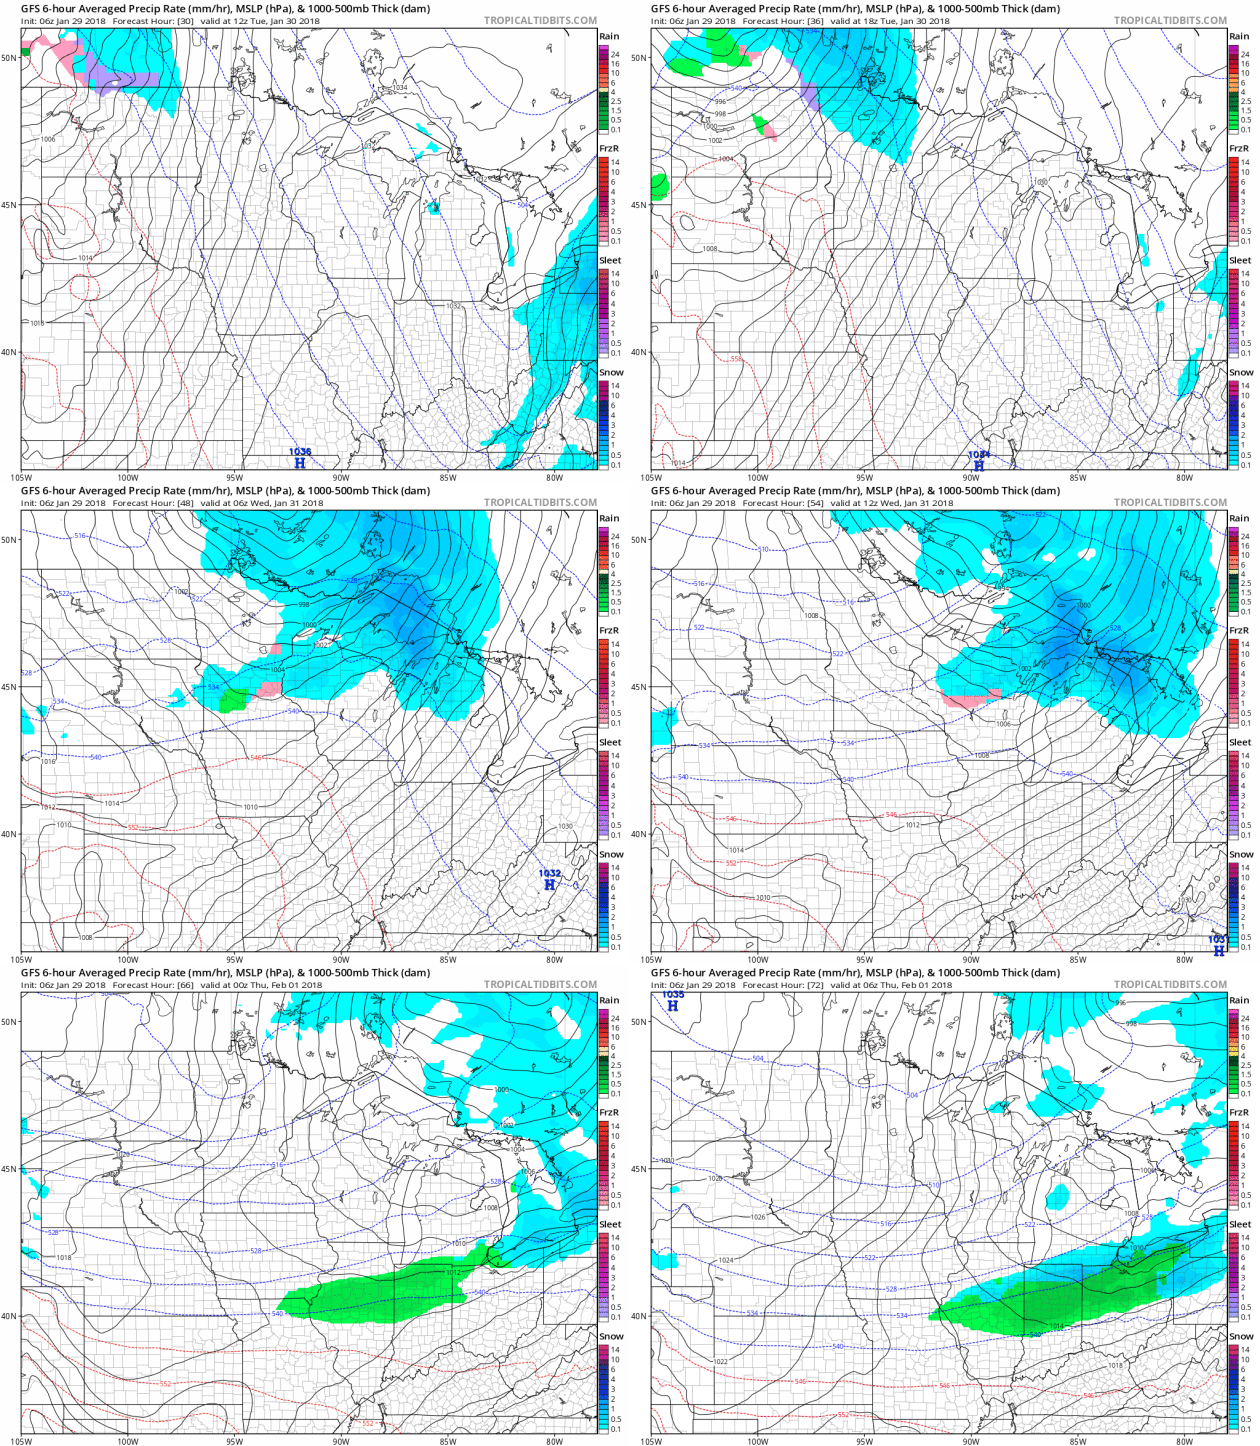
Here’s the weather outlook from AM Tuesday to Wednesday night, which shows a fairly fast moving clipper system rolling into the Great Lakes with a little light snow. While the system won’t bring much snow to the area, it will tap into the colder air across Canada. Temperatures by the end of the week will be quite chilly and just in time for thousands of people coming to town to take part in the Super Bowl festivities.


Snowfall Potential – NWS Forecast

Here’s the snowfall forecast through PM Wednesday, which suggests a light coating possible across the far northern reaches of the state. Some along the international border could see as much as 1″ to 3″+ of snow, while everyone else will likely just see a few light snow showers and flurries. At most, a light dusting would be possible for everyone else.
 
Minneapolis Snow Status
Despite the heavy snow last week, the Twin Cities is still running a fairly decent snow deficit. As of January 28th, MSP was more than 7″ below normal snowfall for the season, but was 7.1″ above normal snowfall for the of January, which by the way is typically the snowiest month of the year, averaging 12.2″!


Mild Through Midweek, Then COLD
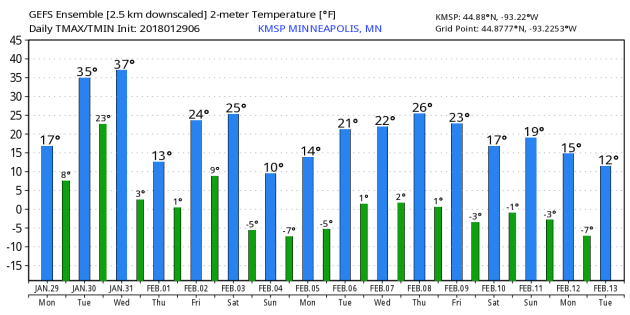
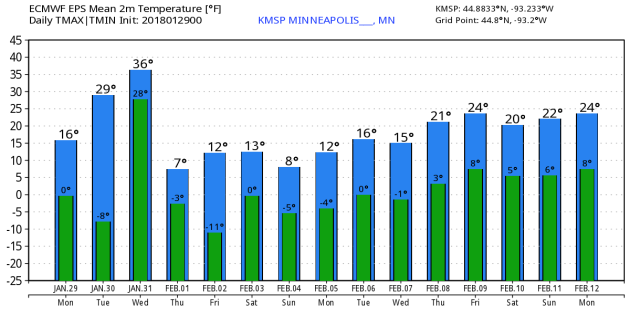
Here’s the temperature forecast through the middle part of February, which shows temps remaining somewhat mild through midweek, before another surge of colder air moves in late week and into the weekend. Temperatures on Wednesday could approach 40F in a few locations across southern MN, but will dip into the single digits and teens with sub-zero overnight lows. If you’re planning on taking part in any of the Super Bowl festivities later this week/weekend again, make sure you bundle up!


_____________________________________________________________________________

Snow Depth 2018
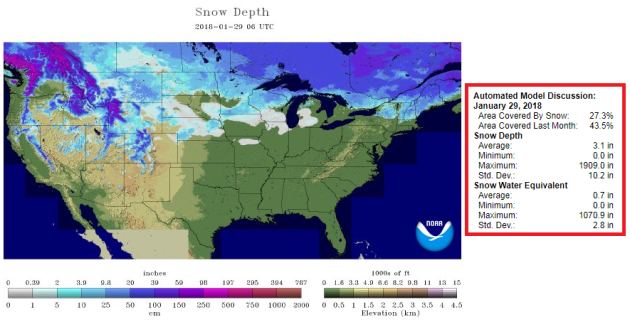
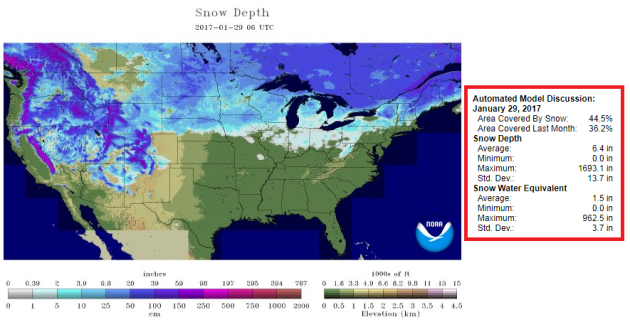
The snow depth map across the country for January 29th suggests that 27.3% of the country is covered in snow, mainly across the northern half of the nation. At this time last year, 44.5% of the nation was covered in snow. As of January 28th, the Twin Cities officially had 3″ of snow on the ground at the MSP Airport, but at this time last year, there was 1″ on the ground. Note also that last year at this time, the Sierra Nevada Range in California had a significantly greater snow pack than what is there now.

Snow Depth 2017
At this time last year, 44.5% of the nation was covered in snow.


 ____________________________________________________________________________
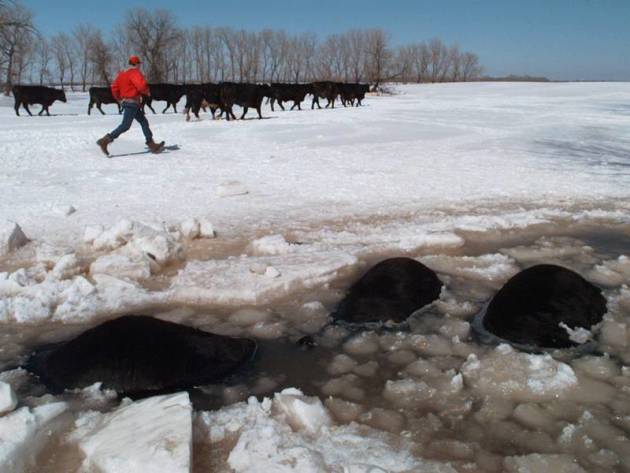
“Minnesota Sees Deadliest Winter In Years”
“Minnesota has already had five ice-related deaths this winter. The state typically averages three during the whole season. Minnesota is on track to have one of its deadliest winters in years. Five people have died this season after falling through ice. The state typically averages three ice-related deaths over the course of the entire winter. The 2015-2016 winter had zero ice-related deaths, while the 2016-2017 winter had two. The last time Minnesota saw ice-related deaths in the double digits was in the 2002-2003 winter, when the state had 10 fatalities. The most recent death this year happened in northern Minnesota where a women drowned after riding an ATV on Rice Lake. Minnesota Department of Natural Resources conservation officer Hannah Mishler has already responded to multiple ice rescue calls. “Ice, especially snow covered ice, is extremely deceptive. You can’t see dangerous cracks or the thickness of the ice under the snow,” Mishler said in a statement.”


Ice Safety!!
Before you go testing the ice on area lakes and ponds, remember that “ICE IS NEVER 100% SAFE!” So when is ice safe? Here is an excerpt from the MN DNR regarding ice safety:
“There really is no sure answer. You can’t judge the strength of ice just by its appearance, age, thickness, temperature, or whether or not the ice is covered with snow. Strength is based on all these factors — plus the depth of water under the ice, size of the water body, water chemistry and currents, the distribution of the load on the ice, and local climatic conditions.”


General Ice Thickness Guidelines

Here are some general ice thickness guidelines from the MN DNR:
For new, clear ice ONLY:

Under 4″ – STAY OFF
4″ – Ice fishing or other activities on foot
5″ – 7″ – Snowmobile or ATV
8″ – 12″ – Car or small pickup
12″ – 15″ – Medium truck

Many factors other than thickness can cause ice to be unsafe.
White ice or “snow ice” is only about half as strong as new clear ice. Double the above thickness guidelines when traveling on white ice.

See more from the MN DNR HERE:


___________________________________________________________________
Temperature Anomaly on Monday
The image below shows the temperature anomaly across North America from Monday, which showed mild air still sitting across parts of the eastern US, but especially across the Western US, where temperatures were nearly 15F to 25F+ above average! The extended forecast suggests another whack of colder air by the end of the week for much of the Central US. This colder air is currently perched across Canada and will begin moving into the Lower 48 by Thursday.
 
Temperature Trend
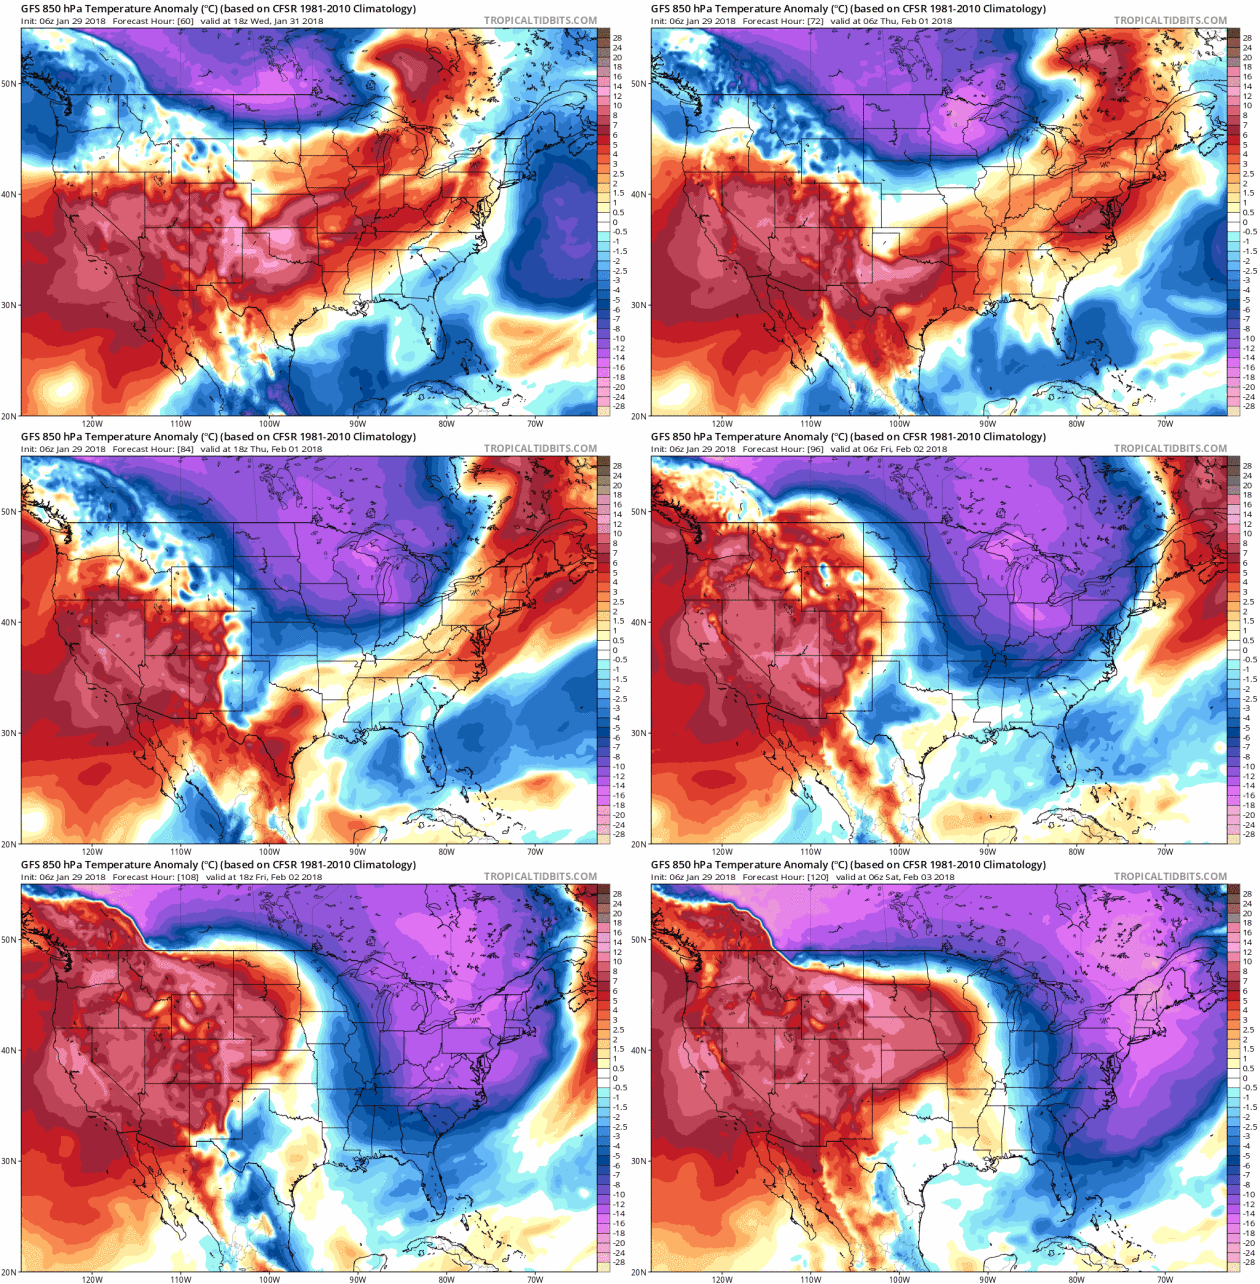
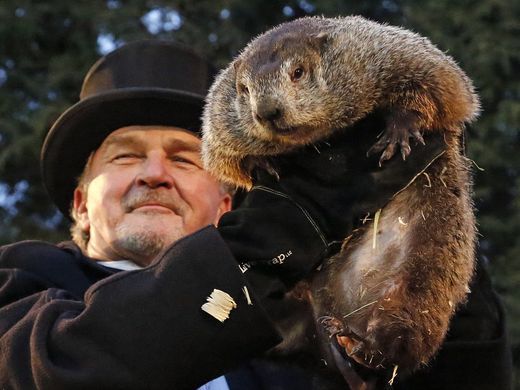
Here’s the 850mb temperature anomaly from midday Wednesday to Friday night, which suggests mild temperatures continuing across the Central US through midweek, but MUCH colder air will settle in by the second half of the week. Keep in mind that Friday is already the 2nd of February and is also Groundhog Day! Punxsutawney Phil might freeze his furry little tail off!


Chilly Groundhog Day 2018 – Friday, February 2nd
MUCH Colder air will spill in across much of the eastern two-thirds of the nation by the end of the week. Here’s a look at daytime highs from average on Friday, which happens to be Groundhog Day! All the furry little forecasters in the Central US will likely freeze their beloved tails off that morning. Maybe that help sway their decision and predict an early spring?


“Groundhog Day 2018: 5 bizarre things you didn’t know about this quirky tradition”

“Punxsutawney Phil has an “inner circle”: Those men in top hats aren’t random. They’re called the “inner circle.” They’re responsible for planning the events around Groundhog Day (no small feat, considering this year’s events span over a week), and caring for Phil. They say his predictions are 100% accurate: Let’s be clear, taken at face value, they’re not. The predictions are actually wrong more than they’re right. But the Punxsutawney Groundhog Club notes that the predictions aren’t geographically specific. So if Phil “predicts” a long winter, that’s probably true – somewhere in the world. They say he is basically immortal. It’s been the same Punxsutawney Phil for all 132 years of the tradition, according to the club. That’s over 15 times longer than the upper end of a groundhog’s typical lifespan. That’s an old groundhog. They say they make him immortal by feeding him the ‘groundhog punch’ every year. They say Phil can communicate. They call it “Groundhogese” and say Phil communicates his predictions to the current president of the inner circle.”
High Temps Tuesday

First things first. Here’s a look at weather conditions across the nation on Tuesday. Temps in the Eastern US will be running a little bit below average, but the western two-thirds of the country looks to be quite mild with temps running nearly 15F to 25F above average.

Tuesday Fire Threat in Texas
Warm, dry and windy weather has prompted critical fire weather concerns across parts of Texas, Oklahoma and New Mexico on Tuesday. Temperatures will be running nearly +25F above average with very low humidty and wind gusts that could approach 40mph+!
“Five Months After Harvey, Texas Is Getting Dangerously Dry”

“When Hurricane Harvey dropped up to 60 inches of water over southeastern Texas, who would have guessed the state would be experiencing a drought less than half a year later? Certainly not John Nielsen-Gammon, the state climatologist and a professor at Texas A&M University. He’s been Texas’ climatologist for nearly 20 years, and he didn’t expect a drought to follow Hurricane Harvey. That being said, it’s not like he’s exactly surprised, either. After all, drought is a normal occurrence in the state. This type of event typically follows La Niña, and that’s what the Tropical Pacific is currently experiencing. During La Niña, which sees a cooling effect throughout the Pacific, Texas sees drier and warmer conditions. That means less rain. The thing that gets Nielsen-Gammon, however, is that the dry winter extends back to September. La Niña, on the other hand, doesn’t begin until November.”

See more from Earther HERE:

_____________________________________________________________________________Weather Outlook Ahead

Areas of snow will spread across the Great Lakes and Northeast through Tuesday with accumulations possibly up to 6″ to 10″ across parts of Lower Michigan. Other locations in the Northeast will generally see lighter amounts of 2″ to 4″+. Pacific moisture will continue to inundate the Pacific Northwest with areas of heavy rain and snow.
5 Day Precipitation Outlook

According to NOAA’s WPC, the 5-day precipitation outlook suggests areas of heavy precipitation continuing in the Eastern US, while the heaviest will continue in the Pacific Northwest. Some spots in the Olympics, northern Cascades and on Vancouver Island could see as much as 4″ to 8″+ liquid! Unreal.

Snowfall Potential Ahead

The snowfall potential through the rest of the week shows pockets of heavy snow across the high elevations in the Western US with feet of snow possible by the weekend! The remnants of this moisture will slide through the Upper Midwest and Great lakes over the days to come with much lighter amounts. However, areas of heavy snow will continue through midweek across parts of the Great Lakes and Northeast where winter weather headlines have been posted.
_____________________________________________________________________
Windy & Warmer Tuesday. Light Snow Late
By Todd Nelson, filling in for Douglas

According to a recent report from NOAA, 2017 was the 3rd hottest on for the entire globe, while the world’s oceans were the hottest ever recorded. Good grief! Alaskans also just experienced its warmest December on record with a staggering statewide average anomaly of 15.7 degrees… what’s going on?

If you’re keeping track, Minnesota’s weather is changing too. Dr. Kenny Blumenfield from the MN DNR State Climatology Office suggested that there are three noticeable trends happening in the state; 1.) Minnesota is becoming warmer and wetter. 2.) Wintertime, nights and cold extremes are warming fastest. 3.) Heavy and extreme rainfall is increasing.

Chew on that for a while.

A fast moving clipper will scoot through the region Tuesday with a few inches of snow across the international border. Other than a light coating, MSP won’t see much later today. It will be windy though!

Temps tumble late Wednesday with face-numbing wind chills in play by the end of the week. Light fluffy snow arrives once again Friday night into Saturday.
________________________________________________________________________

Extended Forecast

TUESDAY: Windy. Light PM snow. Winds: SE 15-30. High: 29.

TUESDAY NIGHT: Light snow coating. Then decreasing clouds. Winds: SSE 5-15. Low: 25

WEDNESDAY: Brighter blue sky. Temps tumble late. Winds: WNW 10-15. High: 32.

THURSDAY: Brisk winds. Face-numbing again. Winds: NW 10-15. Wake-up: 0. High: 7.

FRIDAY: Cold start. Cloudier PM, snow at night. Winds: SSE 5-10. Wake-up: -6. High: 11.

SATURDAY: Snowy start. Fluffy coating possible. Winds: N 10-15. Wake-up: 2. High: 14.

SUNDAY: Chilled sunshine. Less wind. Winds: W 5-10. Wake-up: -2. High: 8.

MONDAY: Another light snow chance. Winds: SW 5-10. Wake-up: 0. High: 12.
_______________________________________________________

This Day in Weather History
January 30th

1994: Duluth has a record low of -35.
_______________________________________________________

Average High/Low for Minneapolis
January 30th

Average High: 25F (Record: 48F set in 1989)
Average Low: 8F (Record: -30F set in 1887)

Record Rainfall: 0.49″ set in 1878
Record Snowfall: 6.4″ set in 2014
_________________________________________________________

Sunrise/Sunset Times for Minneapolis
January 30th

Sunrise: 7:34am
Sunset: 5:18pm

Hours of Daylight: ~9 hours & 43 minutes

Daylight GAINED since yesterday: ~ 2 minutes & 30 seconds
Daylight GAINED since winter solstice (December 21st): 57 minutes
__________________________________________________________

Moon Phase for January 30th at Midnight
0.3 Days Until Full “Snow” Moon

“Usually this title is reserved for a full moon in February, since  world tends to be fully coated in snow by then. But this year is an oddity, in that there will be no full moon in February. (This is true for most locations on Earth, but in some places, including eastern Asia and eastern Australia, the moment of peak fullness will occur on the morning of Feb. 1.) During February, the snow and bitter cold makes hunting difficult, so some tribes called this moon the Full Hunger Moon.

This is the second time the moon turns full in a calendar month, so it is also popularly known as a Blue Moon. On average, full moons occur every 29.53 days (the length of the synodic month), or 12.37 times per year. So months containing two full moons occur, on average, every 2.72 years. This year, however, is a striking exception to this rule, as you will soon see.

Jan. 31 will also be the night of a total lunar eclipse.The Pacific Rim — the lands around the rim of the Pacific Ocean— will have a ringside seat for this event: Totality will last 77 minutes, and at mideclipse, the moon will appear directly overhead (or nearly so) over the open waters of the western Pacific Ocean.

In the western U.S. and western Canada, the eclipse will take place during the predawn hours, but across the rest of North America, the progress of the eclipse will be interrupted by moonset.

_________________________

“How Rare Is The All-In-One Supermoon, Blue Moon, And Lunar Eclipse, Really?”

“This January 31st, something quite rare and special will happen. At 1:30 PM, Universal Time (8:30 AM Eastern / 5:30 AM Pacific), the Moon will reach its full phase for the second time in the month of January, making it a blue Moon. The full Moon also occurs very close to perigee, where the Moon makes its closest approach to Earth in its elliptical orbit, occurring close enough to create a Supermoon, where the full Moon is up to 14% brighter than average. And finally, the Moon will fully slip into the Earth’s shadow during this time, creating a total lunar eclipse. NASA is calling it the “Super Blood Blue Moon.” For observers in North America, it’s the first time all three of these phenomena will line up since 1866. But how rare is it, really, to get a Supermoon, blue Moon, and lunar eclipse all at once?”

See more from Forbes HERE:


_______________________________________________________________________________Temp Outlook For Tuesday

Temps on Tuesday will be a little warmer than what we had on Monday. This warming will be ahead of a clipper system that will bring light snow to the area on Tuesday. Keep in mind that Tuesday will be quite breezy with gusting up close to 30mph at times.


__________________________________________________________________________
8 to 14 Day Temperature Outlook

Here’s the temperature outlook as we head into the 2nd week of February, which suggests that colder than temperatures will be in place across much of the region. While temperatures will likely be colder than average, it doesn’t appear to have as big of a bite that it had at the end of December and early January.

8 to 14 Day Temperature Outlook

As we head into the 2nd week of February, warmer than average temperatures will still be in place across the Southwestern and Southeastern US, while much of the central and northern part of the nation will still be running below average.
____________________________________________________________________________
“The Magnetic Field Is Shifting. The Poles May Flip. This Could Get Bad.”
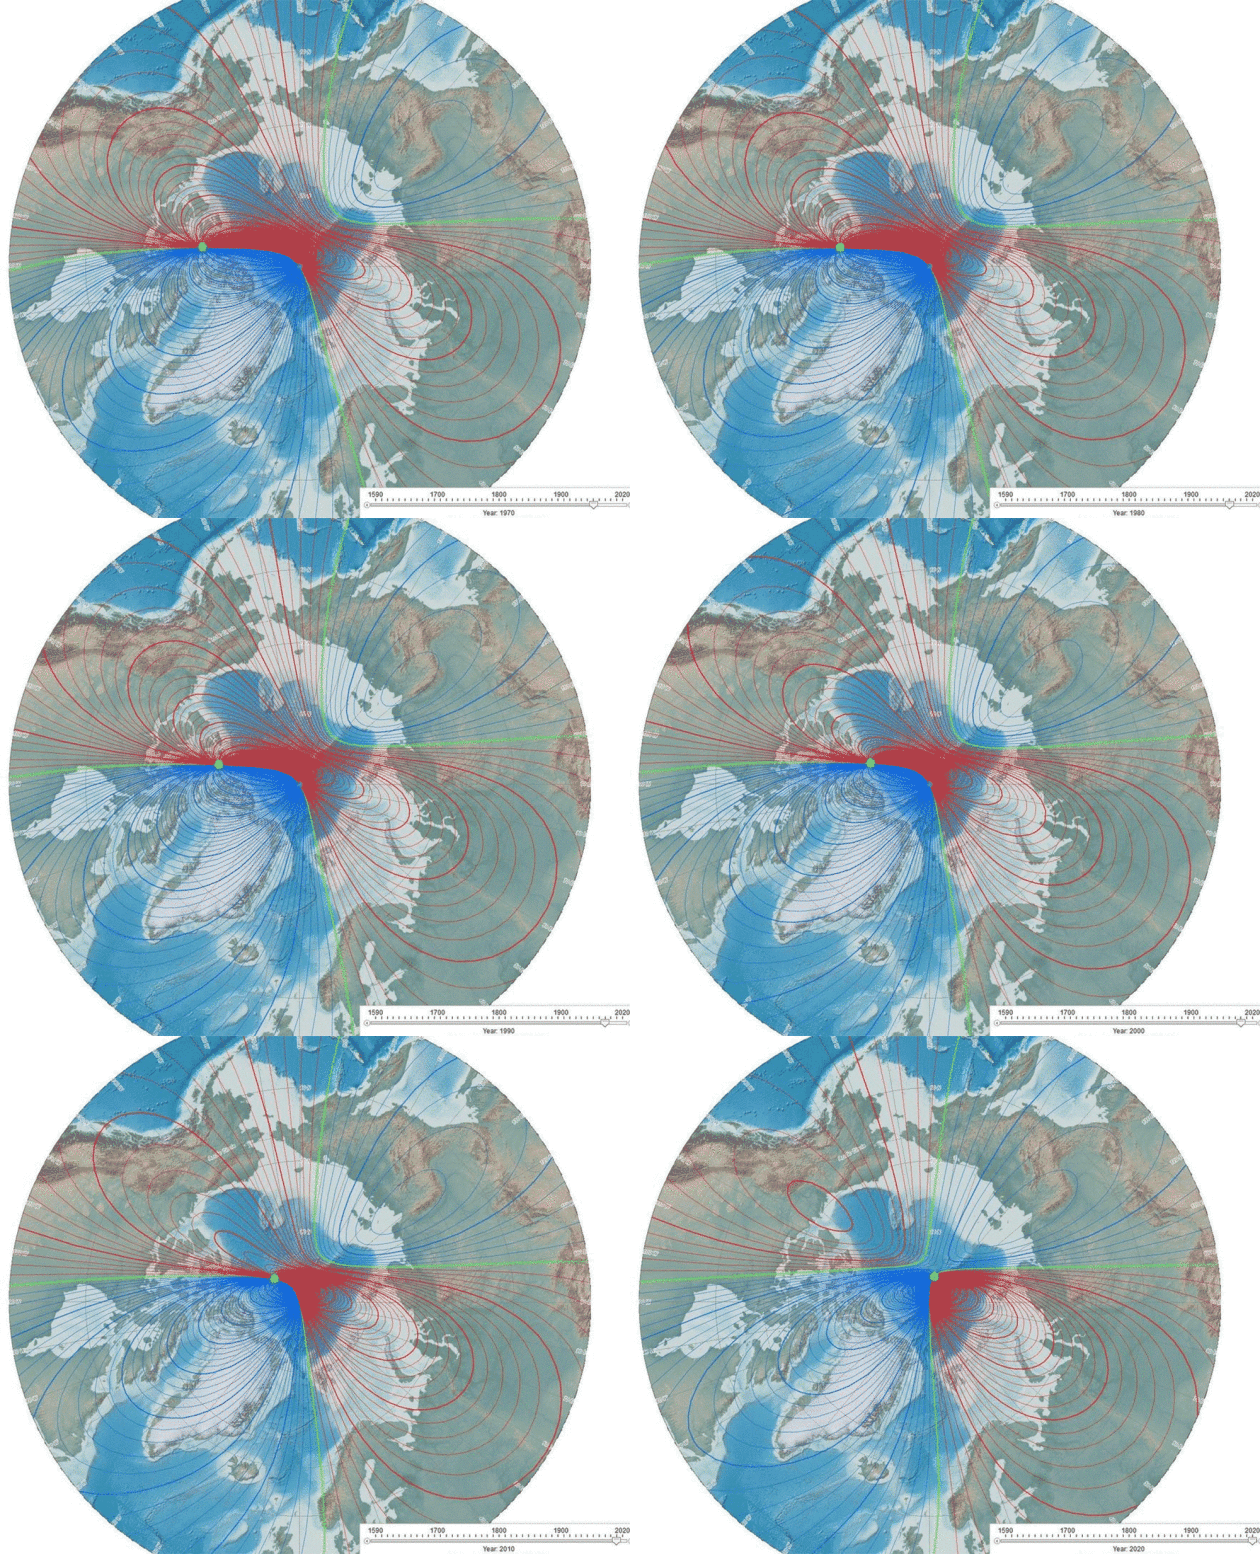
“ONE DAY in 1905, the French geophysicist Bernard Brunhes brought back to his lab some rocks he’d unearthed from a freshly cut road near the village of Pont Farin. When he analyzed their magnetic properties, he was astonished at what they showed: Millions of years ago, the Earth’s magnetic poles had been on the opposite sides of the planet. North was south and south was north. The discovery spoke of planetary anarchy. Scientists had no way to explain it. Today, we know that the poles have changed places hundreds of times, most recently 780,000 years ago. (Sometimes, the poles try to reverse positions but then snap back into place, in what is called an excursion. The last time was about 40,000 years ago.) We also know that when they flip next time, the consequences for the electrical and electronic infrastructure that runs modern civilization will be dire. The question is when that will happen.”

__________________________________________________________________________
“The Troubling Consequences of the Vanishing Ice at Glacier National Park”
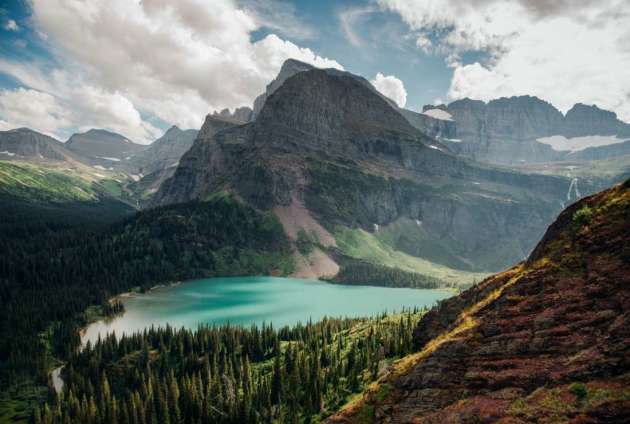
“The very name of Glacier National Park, a 1-million-acre expanse in northwest Montana on the Canadian border, comes from ice. But the name may need to change by 2030: Experts predict the formations could disappear by then. According to the U.S. Geological Survey, the glaciers in Glacier National Park have shrunk by an average of 39 percent since 1966; some lost up to 85 percent of their ice. A 2014 study in Science attributes global loss in glacier mass to both anthropogenic (or human caused) and natural climate changes. The study blames human causes for about a quarter of the loss between 1851 and 2010, but that share increased steadily and accelerated to account for almost two-thirds of the loss between 1991 and 2010. Glaciers are one of the main reasons 2.9 million people visited the eponymous national park in 2016. But the looming loss of these formations has many significant ramifications. Moreover, the changes at the park are representative of what’s happening globally—and visitors can see these changes for themselves.”
 

_____________________________________________________________________________
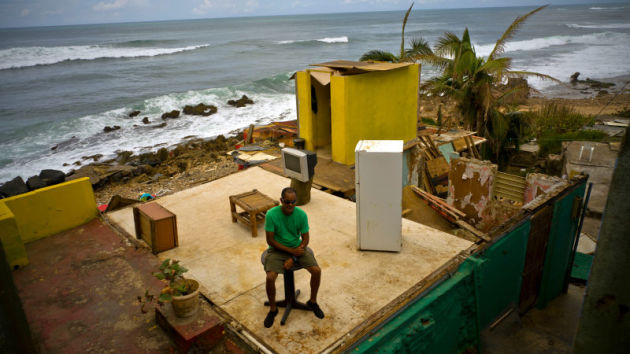
“This Instagram-famous pilot’s photos of thunderstorms, blinding sunrises, and the Northern Lights show what it’s like to work from the cockpit at 37,000 feet”
“34-year-old Christiaan van Heijst, Dutch senior first officer and cargo pilot, flies the Boeing 747-8 and -400 Freighter — and he’s racked up 8,000 hours of flying time. Van Heijst is also a travel blogger and photographer. He takes photos of the incredible views he enjoys from the cockpit via his Instagram account, then writes about them on his blog. From blinding sunrises to the Northern Lights — or navigating his way through a violent front of thunderstorms — scroll down to see some of the insane things he has experienced from 37,000 feet in the air.”

________________________________________________________________________________
“World’s Oceans Were Hottest On Record In 2017, Study Finds”
“The long-term warming trend driven by human activities continued unabated,” researchers said. The world’s oceans in 2017 were the hottest ever recorded, scientists revealed in a new study published on Friday. The findings were based on an updated analysis of the top 6,000 feet of the world’s seas by the Institute of Atmospheric Physics and the Chinese Academy of Science. “The long-term warming trend driven by human activities continued unabated,” researchers said in the study, which was published in the journal Advances in Atmospheric Sciences. “The high ocean temperatures in recent years have occurred as greenhouse gas levels in the atmosphere have also risen.”  Owing to its “large heat capacity, the ocean accumulates the warming derived from human activities; indeed, more than 90 percent of Earth’s residual heat related to global warming is absorbed by the ocean,” according to the researchers. “As such, the global ocean heat content record robustly represents the signature of global warming.”  While ocean temperatures dropped slightly in 2016 because of a massive El Nino effect, the last five years were still the hottest recorded for the world’s oceans. The second hottest ocean year was 2015.”

______________________________________________________________________________
“The flu can kill tens of millions of people. In 1918, that’s exactly what it did.”
“The flu arrived as a great war raged in Europe, a conflict that would leave about 20 million people dead over four years. In 1918, the flu would kill more than twice that number — and perhaps five times as many — in just 15 months. Though mostly forgotten, it has been called “the greatest medical holocaust in history.” Experts believe between 50 and 100 million people were killed. More than two-thirds of them died in a single 10-week period in the autumn of 1918. Never have so many died so swiftly from a single disease. In the United States alone, it killed about 675,000 in about a year — the same number who have died of AIDS in nearly 40 years.”
(Photo Credit: Library of Congress via AP)


____________________________________________________________________________

“Solar Energy Now Creates More Jobs in America Than Any Other Industry”
“Solar energy isn’t just a tool to reduce emissions and help slow climate change – it’s a job creator. According to the most recent National Solar Jobs Census published by The Solar Foundation, the industry creates more jobs than any other sector in the US. According to the census, solar energy adds jobs 17 times faster than the overall economy in the United States. In 2010, there were only 93,000 jobs in solar. The sector has seen a steep rise and six years later 260,077 people were employed in the field. This means that in 2016 one in every 50 new jobs was in the solar industry, and analysts expect the trend to continue. Although the figures presented in the census were originally criticised for underestimating the number of workers operating in the solar industry, The Hillnow reports that “the Census is widely recognised as the most authoritative and comprehensive analysis of the US solar workforce.””
(Photo Credit: Thongsuk Atiwannakul/Shutterstock)

___________________________________________________________________________
“The 2017 Hurricane Season Officially Rewrote the Record Books”
“Even before they made landfall, 2017’s major hurricanes—Harvey, Maria and Irma—were already causing billions in damage. A new update from the National Oceanic and Atmospheric Administration (NOAA) makes clear just how costly this trio of terrors will end up being, estimating that all three storms clock in among the top 5 most expensive hurricanes to ever hit the U.S. According to the NOAA official list of billion-dollar hurricanes, Harvey tied with 2005’s Hurricane Katrina for the most costly on record, coming in with an estimated $125 billion price tag. The damage was largely tied to the storm’s record-setting rains which swamped Houston, the fourth-most populous city in the U.S. Just over five feet of rain fell on the metro area over six days in August, turning the city into a Venetian-looking disaster.”


 ___________________________________________________________________________

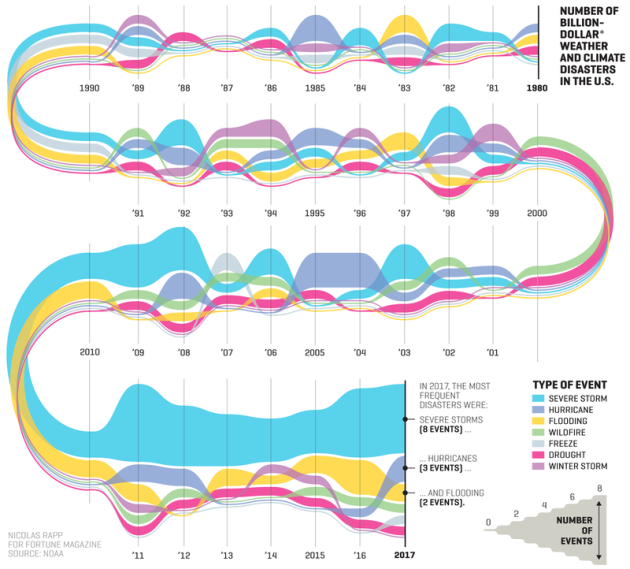
“The Number of Billion-Dollar Weather Disasters in the U.S. Is Surging”

“Extreme weather is becoming more common, and the economic impact is soaring. Last year there were 16 weather events in the U.S. that caused at least $1 billion each in damage, according to the National Oceanic and Atmospheric Administration. The cumulative cost was $306 billion—easily surpassing the previous one-year record of $215 billion set in 2005. In September a report from the nonprofit Universal Ecological Fund, “The Economic Case for Climate Action in the United States,” estimated that total climate-related economic losses and health costs in the U.S. averaged $240 billion a year over the past decade. The authors project the annual cost will rise to $360 billion over the next 10 years.”
See more from Fortune HERE:

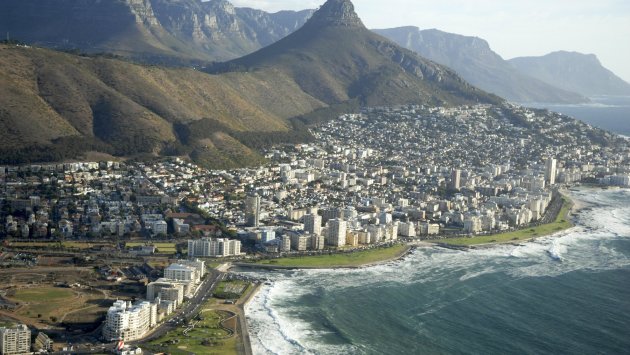
____________________________________________________________________________“CAPE TOWN’S WATER CRISIS IS SO SEVERE, EVEN LUXURY TOURISTS ARE FEELING IT”

“For people who know it, Cape Town is a city that can feel defined by its mind-boggling levels of inequality. But for travelers being catered to by the city’s sophisticated luxury travel market, Cape Town’s rampant challenges often stay shielded from view. However, the city’s increasingly severe water crisis—which has Cape Town officials warning that “Day Zero,” when the city will turn off its taps, could come as soon as late April—is a reality that even the city’s finest hotels aren’t shielding their guests from. In fact, as a whole, five star and ultra luxury properties are responding to the crisis with an urgency that is somewhat surprising—especially when you consider the types of wealthy guests they generally serve.”
See more from Quartzy HERE:


 ______________________________________________________________________________

Thanks for checking in and don’t forget to follow me on Twitter @TNelsonWX