August 16, 1981: Chilly temperatures are felt across Minnesota. Tower reports a low of 33 degrees.
Is this a good time to remind you that the last 12 months have been the wettest on record? Twin Cities statistics go back to 1837. 40.72 inches of rain fell from August 2016 to July 2017.

Upper Midwest Soaker – Gert Veers Out to Sea. Here’s a look out 84 hours, thanks to NOAA’s 12 KM NAM model. A very slow-moving (almost October-like) storm pushes multiple waves of heavy rain and T-storms into the Upper Midwest today and tonight, resulting in some 1-3″ rainfall amounts. New England enjoys a fine Wednesday, with dry weather the rule over the western USA as well. Loop: Tropicaltidbits.com.
Early Cloud Cover Prediction for August 21. No, don’t take this to the bank, because the forecast will change. The map above shows an early forecast (GFS model) of average cloud cover conditions for midday next Friday. We’ll update this and keep our fingers crossed that Mother Nature cooperates. Map: Praedictix.com.
Cloud Cover Prediction for 1 PM Monday. Yes, this is a WAG, not a forecast this far out, but it’ll be vaguely interesting to see how this outlook changes over time. Significant cloud cover is predicted for the Upper Midwest, parts of Wyoming and Colorado, and the southeast and Florida. Your results may vary.
Wednesday Forecast Highs. Steamy heat continues over the southern third of the USA, but a few furnaces may click on from northern Minnesota into the U.P. of Michigan, with wake-up readings in the 50s and highs holding in the 60s with heavy rain. Map: NOAA.
Probability of Precipitation Today. The heaviest, most widespread and organized rains today stretch across the Upper Mississippi Valley, from Minnesota southward down I-35 into Iowa, Missouri and the central Plains. Instability T-storms flare up from the Ohio Valley to the Gulf Coast and Florida.
Ripe for Hurricane Development? A combination of no El Nino (which tends to increase winds over the tropics, shredding developing storms before they can really get going), unusually warm ocean water and less Saharan dust than average may be setting the stage for a busy hurricane season later in August and September.
July 2017 Ties July 2016 for Hottest Month on Record. NASA has details: “July 2017 was statistically tied with July 2016 as the warmest July in the 137 years of modern record-keeping, according to a monthly analysis of global temperatures by scientists at NASA’s Goddard Institute for Space Studies (GISS) in New York. Last month was about 0.83 degrees Celsius warmer than the mean July temperature of the 1951-1980 period. Only July 2016 showed a similarly high temperature (0.82 °C), all previous months of July were more than a tenth of a degree cooler…”
Map credit: “A global map of the June 2017 LOTI (land-ocean temperature index) anomaly, relative to the 1951-1980 June average.”

How to Shelter From Fallout After a Nuclear Attack on Your City. Nothing any of us want to contemplate, but under the old Boy Scout motto of “be prepared” here’s an excerpt from io9: “Terrorists have detonated a low-yield nuclear warhead in your city. How long should you hide, and where, to avoid the worst effects of radioactive fallout? We talked to Lawrence Livermore National Laboratory atmospheric scientist Michael Dillon to find out. Yesterday Dillon published a paper on this topic in the Proceedings of the Royal Society A. He’s spent his career researching how the government should respond to disasters with an airborne component, whether that’s a chemical accident, an epidemic, or nuclear fallout. After poring over dozens of studies on how fallout behaves, and analyzing as many factors as possible related to urban detonations, he’s come up with a disaster plan that he hopes can be implemented by first responders working with governments from the local to the federal level…”
How to Stay Calmer, More Alert and Save the Environment: Bring the Weather Indoors. Kevin Nute has an interesting story at The Washington Post: “A building’s primary purpose may be to keep the weather out, but most of them do such an effective job of this that they also inadvertently deprive us of contact with two key requirements for our well-being and effectiveness: nature and change. In the 1950s, Donald Hebb’s “arousal theory” established that people need a degree of changing sensory stimulation to remain fully attentive. And 30 years later, landmark research by health-care designer Roger Ulrich showed that hospital patients in rooms with views of nature had lower stress levels and recovered more quickly than patients whose rooms looked out at a brick wall. Unfortunately, many buildings — especially in cities — are not blessed with green surroundings. I am part of a group of architects and psychologists at the University of Oregon that has been examining ways to overcome this problem using an aspect of nature available anywhere: the weather…”
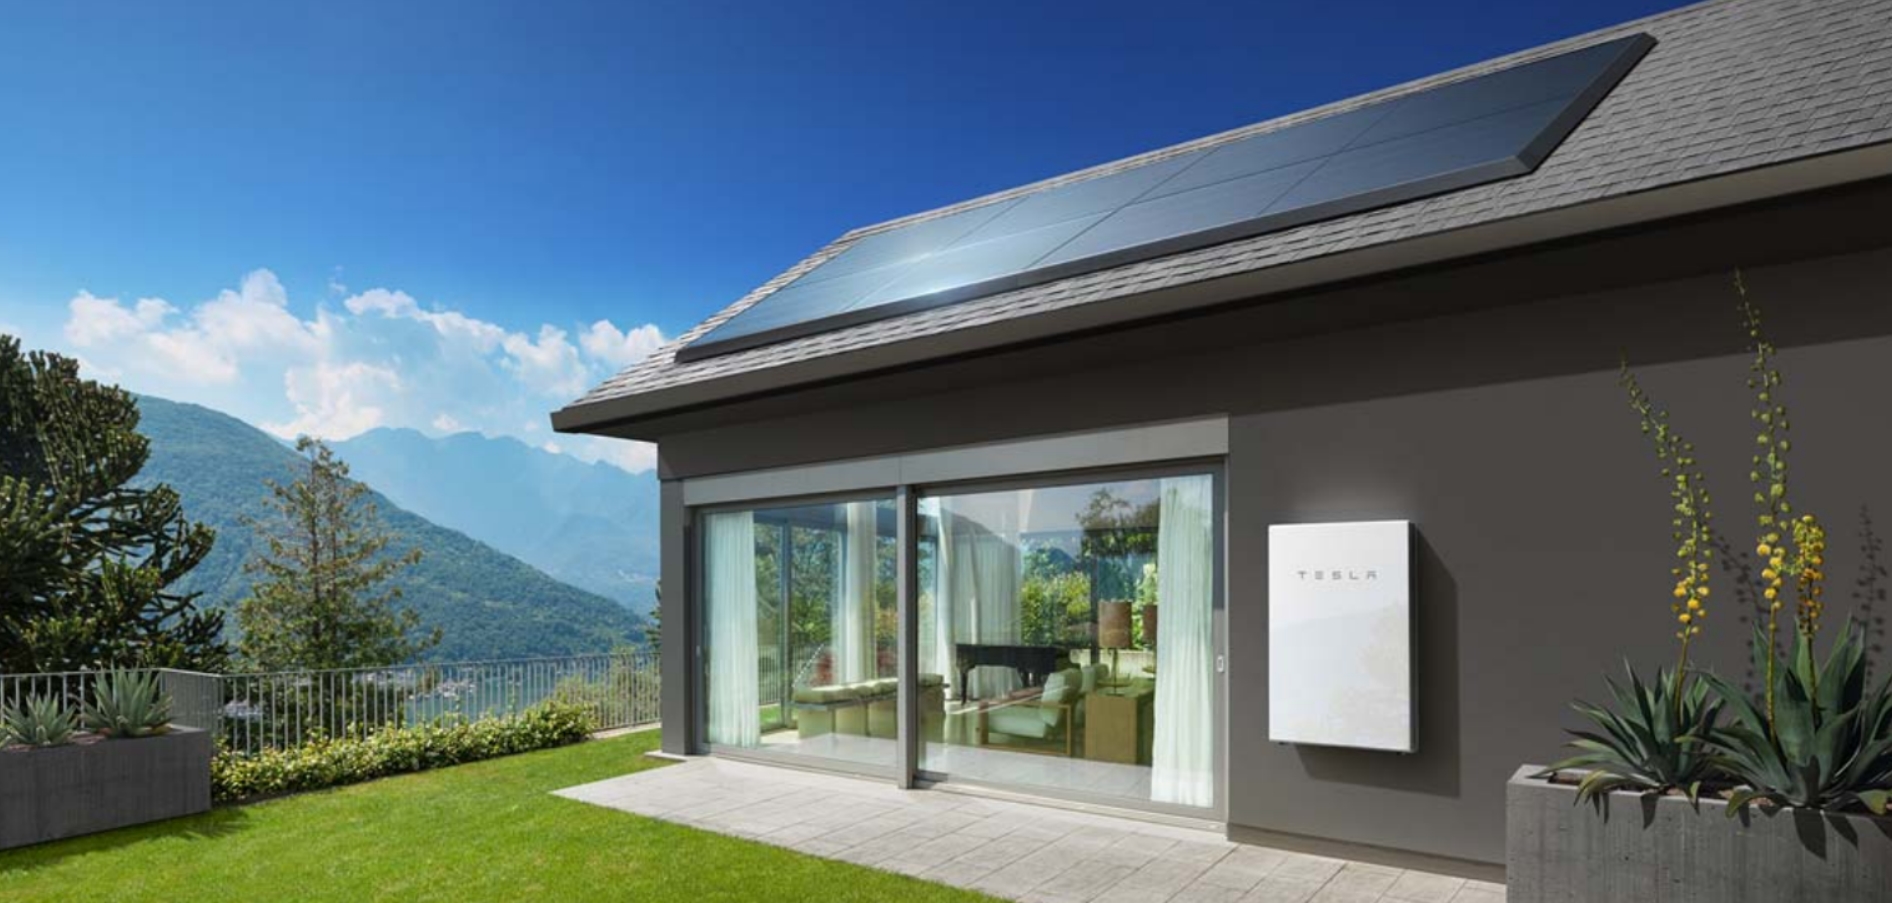
Why 88,000 American Jobs in Solar Energy Are At Risk. TheHill has details: “…Overall job growth in the solar industry is one of the brightest spots in the economy — and smart job growth policy should account for this matured market. Earlier this month, my organization CRES Forum, held a panel discussion to get into the weeds and understand exactly what jobs in the solar industry look like, how the U.S. solar industry is linked to the global economy and why the case before the commission matters. We learned that in 2016, there were over 260,000 jobs in the U.S. solar industry. One in every 50 new jobs created was in the industry, which is growing at 12 times the rate the rest of the economy. And growth in the solar industry is estimated to eventually lead to one million new jobs created across the supply chain through 2050…”
File image: Electrek.
One in Eight American Adults Is An Alcoholic, Study Says. The Washington Post has news of a sharp rise in alcohol abuse: “…A new study published in JAMA Psychiatry this month finds that the rate of alcohol use disorder, or what’s colloquially known as “alcoholism,” rose by a shocking 49 percent in the first decade of the 2000s. One in eight American adults, or 12.7 percent of the U.S. population, now meets diagnostic criteria for alcohol use disorder, according to the study. The study’s authors characterize the findings as a serious and overlooked public health crisis, noting that alcoholism is a significant driver of mortality from a cornucopia of ailments: “fetal alcohol spectrum disorders, hypertension, cardiovascular diseases, stroke, liver cirrhosis, several types of cancer and infections, pancreatitis, type 2 diabetes, and various injuries.”…The Centers for Disease Control and Prevention estimates that 88,000 people a year die of alcohol-related causes, more than twice the annual death toll of opiate overdose…”
Have Smartphones Destroyed a Generation? Are we really on the brink of a teen mental health meltdown related to smartphones and social media? Here’s an excerpt from The Atlantic: “…More comfortable in their bedrooms than in a car or at a party, today’s teens are physically safer than teens have ever been. They’re markedly less likely to get into a car accident and, having less of a taste for alcohol than their predecessors, are less susceptible to drinking’s attendant ills. Psychologically, however, they are more vulnerable than Millennials were: Rates of teen depression and suicide have skyrocketed since 2011. It’s not an exaggeration to describe iGen as being on the brink of the worst mental-health crisis in decades. Much of this deterioration can be traced to their phones. Even when a seismic event—a war, a technological leap, a free concert in the mud—plays an outsize role in shaping a group of young people, no single factor ever defines a generation. Parenting styles continue to change, as do school curricula and culture, and these things matter. But the twin rise of the smartphone and social media has caused an earthquake of a magnitude we’ve not seen in a very long time, if ever…”
Illustration credit: Jasu Hu.
The Surprising Reason Most People Get Cancer. So much for living right – it all comes down to bad luck? Here’s an excerpt from Women’sHealth: “Load up on plant food. Use your gym membership. Apply sunscreen religiously. Steer clear of cigarettes. Taking on healthy behaviors like these is supposed to lower your lifetime cancer risk. Now, along comes a bombshell study that seems to suggest many of these odds-lowering efforts are less impactful than you may have previously thought: The study, from Johns Hopkins University, determined that two-thirds of all adult cancer incidences can be attributed to random gene mutations that drive tumor growth. In other words, most incidences of cancer are caused by plain-old bad luck, according to study authors…”
Apparently Friends Bring You More Health and Happiness Than Your Family. Marie Claire has details of a new study: “…And new research from Michigan State University underline this fact by saying ‘friends are a conscious choice.’ Running over two studies with 300,000 participants from the ages of 15 up to 99 from around the world, the conclusion showed that those who put a high value on friendships were happier and healthier in general…The research also concluded that those with strong social bonds increased their odds of living long by 50% because they can be a buffer against stress and can raise self-esteem – which is why we instinctually stop being friends with people who don’t feel good for us...”
A Theory of Jerks. If everyone around you is an incompetent zero, odds are YOU are the jerk. Or so says the author of a story at Aeon: “…I submit that the unifying core, the essence of jerkitude in the moral sense, is this: the jerk culpably fails to appreciate the perspectives of others around him, treating them as tools to be manipulated or idiots to be dealt with rather than as moral and epistemic peers. This failure has both an intellectual dimension and an emotional dimension, and it has these two dimensions on both sides of the relationship. The jerk himself is both intellectually and emotionally defective, and what he defectively fails to appreciate is both the intellectual and emotional perspectives of the people around him. He can’t appreciate how he might be wrong and others right about some matter of fact; and what other people want or value doesn’t register as of interest to him, except derivatively upon his own interests. The bumpkin ignorance captured in the earlier use of ‘jerk’ has changed into a type of moral ignorance…”
Illustration credit: Paul Blow.

TODAY: Heavy showers, T-storms. Winds: SE 8-13. High: 75
WEDNESDAY: Showers and T-storms, locally heavy rain. Low: 63
THURSDAY: Partly sunny, drying out. Winds: NW 7-12. High: 77
FRIDAY: Humid with PM T-storms likely. Winds: SW 7-12. Wake-up: 61. High: 80
SATURDAY: Partly sunny, lake-worthy. Winds: S 5-10. Wake-up: 62. High: 82
SUNDAY: Mix of clouds and hazy sun, warmer. Winds: S 8-13. Wake-up: 64. High: 85
MONDAY: Few showers and T-storms possible. Winds: S 5-10. Wake-up: 66. High: near 80
TUESDAY: More sun, probably a drier day. Winds: NE 5-10. Wake-up: 67. High: 81
Climate Stories…
138 Dormant Volcanoes Under Antarctica’s Ice. A story at Quartz made me do a double-take: “…The big question is: how active are these volcanoes? That is something we need to determine as quickly as possible,” Robert Bingham, one of the author’s of the paper told The Guardian. “Anything that causes the melting of ice—which an eruption certainly would—is likely to speed up the flow of ice into the sea.” The connection could work the other way around too, according to Bill McGuire, author of Waking the Giant: How a changing climate triggers earthquakes, tsunamis, and volcanoes. Looking at historical records, McGuire said in a previous interview that melting ice caps could cause the Earth’s top layer to “bounce back” and trigger volcanoes…”
Photo credit: “Hidden monsters.” (Reuters/Mark Baker).
Explaining the Lack of Rain in Spain (and Italy). The Economist looks at larger forces driving a hotter, drier climate for the Mediterranean: “...Nor, surprisingly, have scientists agreed on whether the intensity and frequency of droughts is increasing in Europe. Against a background of global warming, that might seem inevitable. But since evaporation (from sea, lakes and rivers) and evapotranspiration (from the land) lead to increased rainfall, higher temperatures do not necessarily cause more droughts. Problems do arise if the offsetting rainfall is unevenly distributed—as seems to be the case in Europe. Evidence has mounted over the past 30-odd years of a shift towards wetter winters in northern Europe and, says Mr Vogt, of “drier conditions in the Mediterranean, especially in spring and summer, the critical times of year for drought”. Gregor Gregoric, who co-ordinates the Drought Management Centre for Southeastern Europe, says that since the 1980s that region has suffered a significant drought on average every five years. Even his lush Slovenian homeland has been hit…” (Photo credit: EPA).
Climate-Risk Disclosure Moves Up Priority List at Vanguard. Pensions & Investments has more details: “Vanguard Group announced Monday that its investment stewardship team has made climate-risk disclosure a priority over the past year. The announcement came as Vanguard disclosed in a news release that money manager Walden Asset Management withdrew a shareholder proposal submitted to some Vanguard mutual funds seeking a report on proxy-voting policies related to climate change. “Climate change represents an evolving set of risks and opportunities for companies in many sectors. Vanguard has prioritized climate risk on our engagement agenda, and we have discussed the topic with more companies over the past year than ever before,” said Glenn Booraem, investment stewardship officer, in the release…”
The Year Trump Was Elected Was So Hot, It Was 1-in-a-Million. The Guardian explains the odds: “2014, 2015, and 2016 each broke the global temperature record. A new study led by climate scientist Michael Mann just published in Geophysical Research Letters used climate model simulations to examine the odds that these records would have been set in a world with and without human-caused global warming. In model simulations without a human climate influence, the authors concluded:
- There’s a one-in-a-million chance that 2014, 2015, and 2016 would each have been as hot as they were if only natural factors were at play.
- There’s a one-in-10,000 chance that 2014, 2015, and 2016 would all have been record-breaking hot years.
- There’s a less than 0.5% chance of three consecutive record-breaking years happening at any time since 2000...”
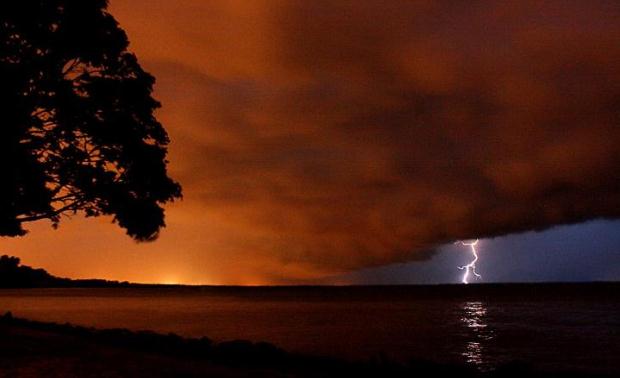
File photo: Brad Birkholz.
