48 F. high in the Twin Cities Friday.
46 F. average high on March 25.
38 F. high on March 25, 2015.
0″ snow on the ground at MSP International Airport.
March 26, 2012: This is the record early ice-out date on Mille Lacs Lake.
March 26, 2007: Temperature records are shattered across much of central and southern Minnesota and west central Wisconsin. The following records were set: 69 at Alexandria, 75 at Mankato, 77 at Little Falls, 79 at St. Cloud, 81 at Minneapolis-St. Paul and Eau Claire, 82 at Redwood Falls, and 83 at Springfield.
Spring Has Sprung, But Don’t Pack Away the (Heavy) Jackets
I forgot how much I missed the sound of chirping birds, a gentle rain pattering on the roof, kids laughing down the street. Spring is in the air, but it appears Old Man Winter won’t go without a scuffle; one last polar punch is a week away.
According to climate guru Mark Seeley March is the 6th warmest since 1895. He writes: “Even more remarkable is the departure in temperature for the past 12 months, going back to April of 2015. The past 12 months have been the warmest in state history, and by a considerable margin.”
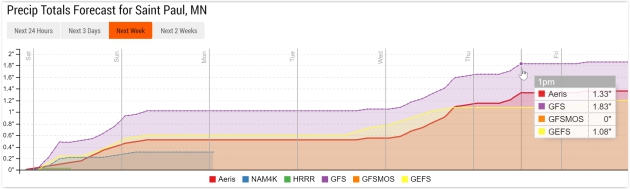
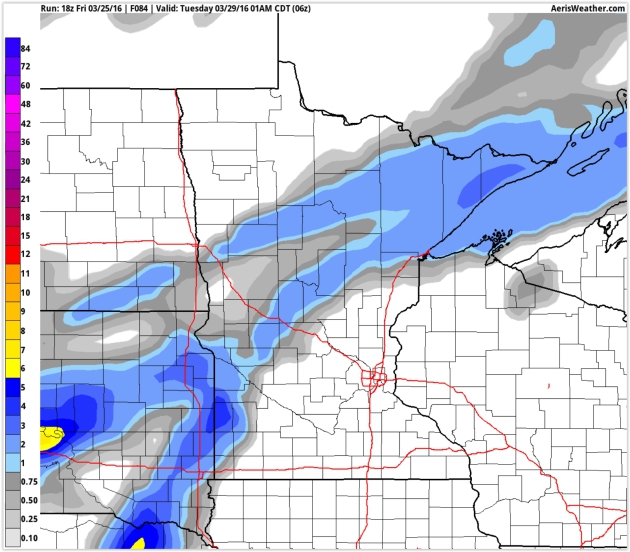
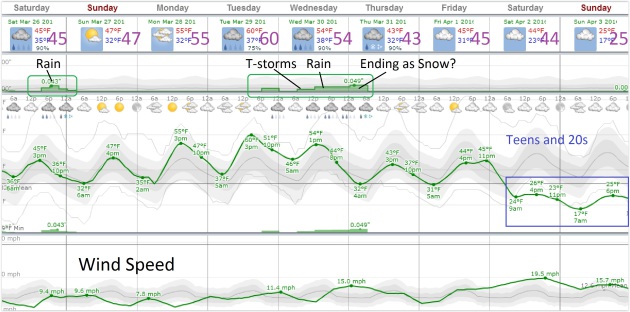
Your daffodils are happy about today’s rain: .25 to .50 inches may fall. Skies clear on Easter Sunday and 50s return early next week, even a shot at 60F and T-storms late Tuesday into Wednesday.
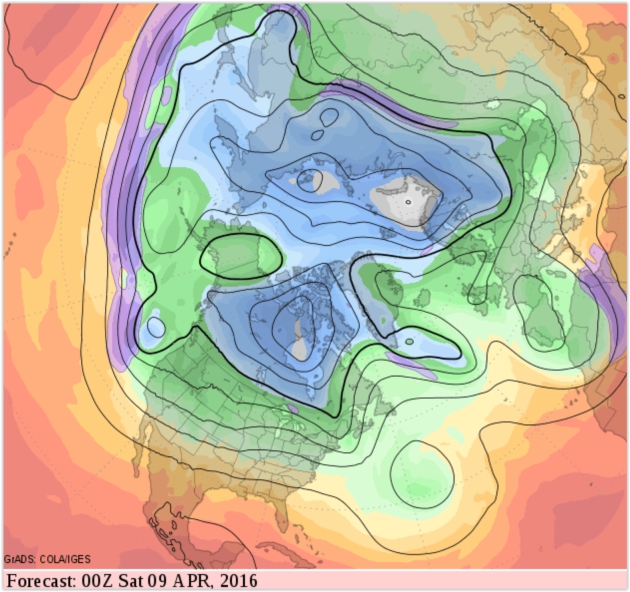
Models bring a shot of truly Siberian air into Minnesota next weekend; a string of days in the 20s and 30s with a formidable wind chill. The first week of April kicks off on a blustery, November-like note.
The sun angle is too high in the sky for it to stay Nanook for long. By the second week of April a zonal, west-to-east wind flow tempts the mercury into the 50s.
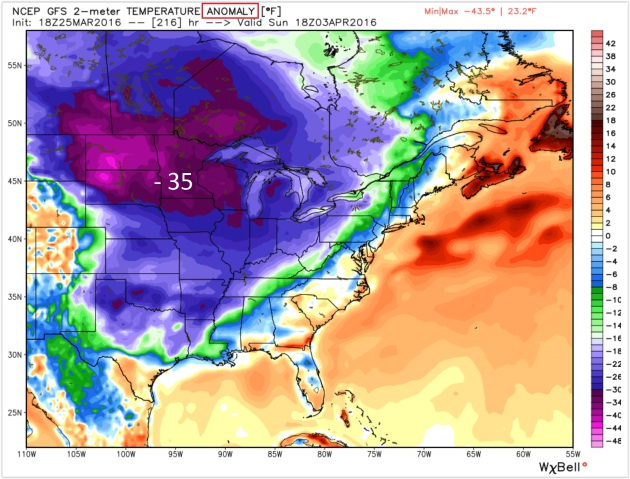
Map credit above: WeatherBell. Don’t panic (much). It won’t be -35F; temperature anomalies are forecast to be 35 degrees colder than average next Sunday, April 3, meaning single digits and teens in the morning; highs probably holding in the 20s. Above zero. We can handle that.
Past 12 Months: Warmest in State History. Dr. Mark Seeley explains in this week’s installment of Minnesota WeatherTalk: “…Statewide temperatures so far this month would rank March as the 6th warmest in state history back to 1895. Even more remarkable is the departure in temperature for the past 12 months, going back to April of 2015. The past 12 months have been the warmest in state history, and by a considerable margin…”
A Rainy Streak. NOAA’s 12 KM NAM model shows another surge of showery rains later today – the atmosphere too stable for thunder and lightning. Source: AerisWeather.
Candy-Coating of Slush. NAM guidance still hints at a slushy coating from near Sauk Rapids to Brainerd and Duluth Saturday night as the atmosphere cools. Just enough to remind locals it’s still March.
Deep Breaths. The sun angle is too high now for it to stay cold for an extended period of time. I still anticipate moderating temperatures by the second week of April; more 50s with a shot at 60F. Big swings.
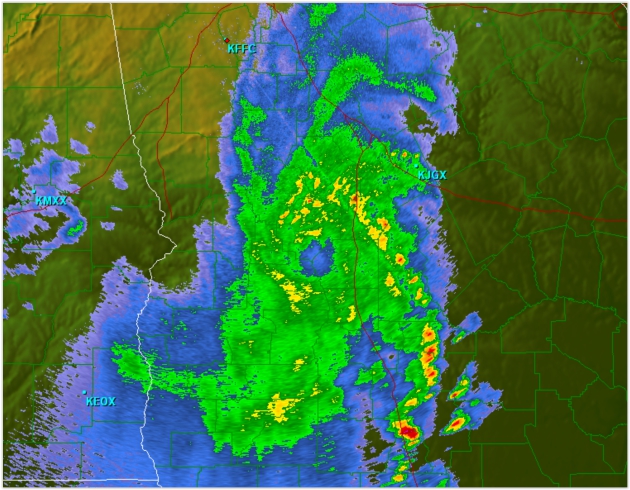
“Landicane?” A meteorology buddy in Atlanta sent me this jaw-dropping radar composite of the MCS (meso-convective system) that roared across the southeast Thursday with 40-60 mph winds and flooding rains. Check out the “eye”. I can’t say I’ve ever seen that before. What the….???
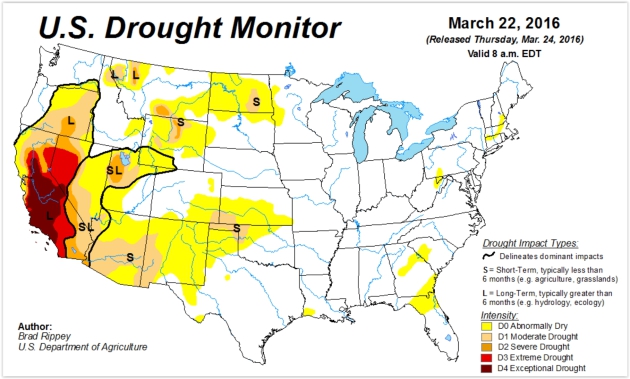
Average Year for Snow is Looking Pretty Nice Across U.S. West. Here’s an excerpt from Bloomberg Business: “…A year ago, just about 60 percent of 11 western states suffered some degree of drought, according to the latest report of the U.S. Drought Monitor in Lincoln, Nebraska. That has dropped to just over 34 percent. That doesn’t mean things aren’t precarious. When the parts of the West listed as abnormally dry are added to the total, almost 68 percent of the land is parched. In California, where drought is moving into its fifth year, just under 99 percent of the state reaches that threshold. El Nino rain has helped some of its reservoirs reach historical average levels, but most are still low...”
Map credit: U.S. Drought Monitor.
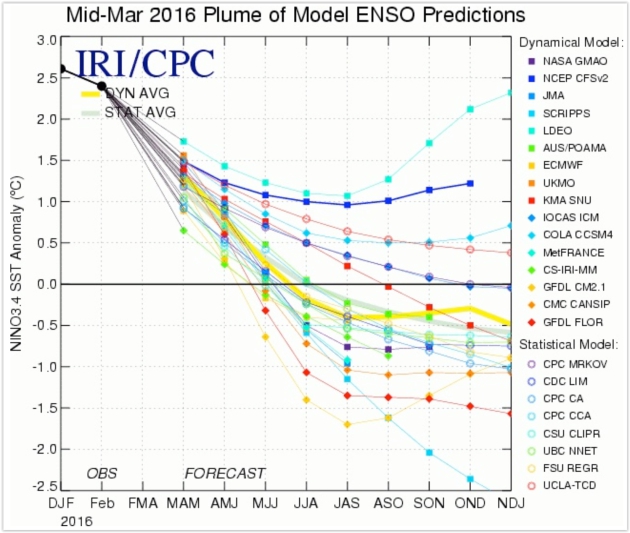
Here Comes La Nina – Or Does It? What History, Models and Experts Tell Us. Bob Henson has an interesting perspective at WunderBlog; here’s an excerpt: “…What’s known as the spring predictability barrier makes this the toughest time of the year to anticipate how the El Niño–Southern Oscillation (ENSO) will behave. ENSO refers to the coupled atmosphere-ocean process that swings between El Niño and La Niña. About half of the time, neutral conditions prevail, with El Niño and La Niña roughly splitting the other 50% of the time. El Niños have been more frequent overall in recent decades, but La Niñas are more likely to recur for two or three years in a row...”
Image credit above: “Projections of various forecast models for the evolution of SSTs in the Niño3.4 region over the next few months. These forecasts were compiled and released in mid-March. El Niño is in place when SSTs are at least 0.5°C above average for five overlapping three-month periods. La Niña is defined the same way, except that SSTs are below rather than above average. The bottom axis shows abbreviations for three-month intervals (e.g., JJA is June-July-August).” Image credit: International Research Institute for Climate and Society.
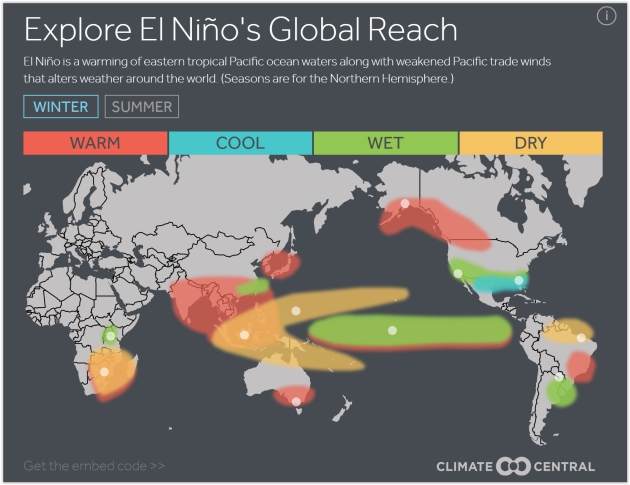
How a Monster El Nino Transforms the World’s Weather. WXshift has a good overview of El Nino’s domino effect on the world’s weather patterns; here’s the intro: “From crippling drought in southern Africa to a record number of February tornadoes in the U.S. Southeast, an exceptionally strong El Niño has been making headlines around the globe as it tampers with the world’s weather. While the event has begun its slow decline, those wide-ranging impacts will continue to be felt for weeks and months to come — good news for those in California, who need El Niño-fueled rains, but bad news for the many areas, like Indonesia, which is suffering from deep drought, food and water shortages, and wildfires. Already this year, El Niño-related weather has cost billions of dollars in damage and left some 100 million people facing food and water shortages…”
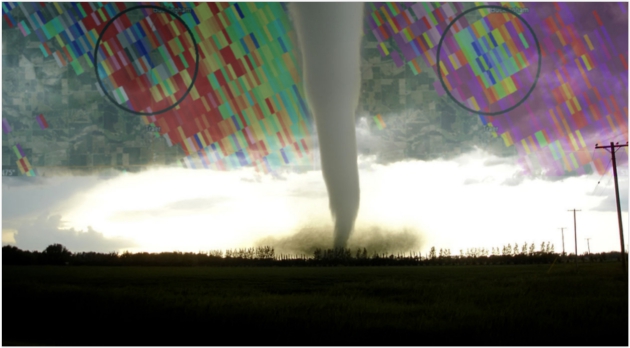
We’ve Come a Long Way Since the First Tornado Forecast. Hard to believe the word “tornado” was banned from predictions for the longest time – for fear of inciting public panic. Jason Meyers at ABC15 explains: “…The National Weather Service gives people an average of 13 minutes warning time for a tornado. But it hasn’t always been that way. It’s hard to believe there was a time when the National Weather Service and its predecessors went as far as banning the use of the word “tornado” in official forecasts and warnings. The thoughts in the early days of the Signal Service and the US Weather Bureau was that using the word “tornado” would cause more panic and harm than an actual tornado...”
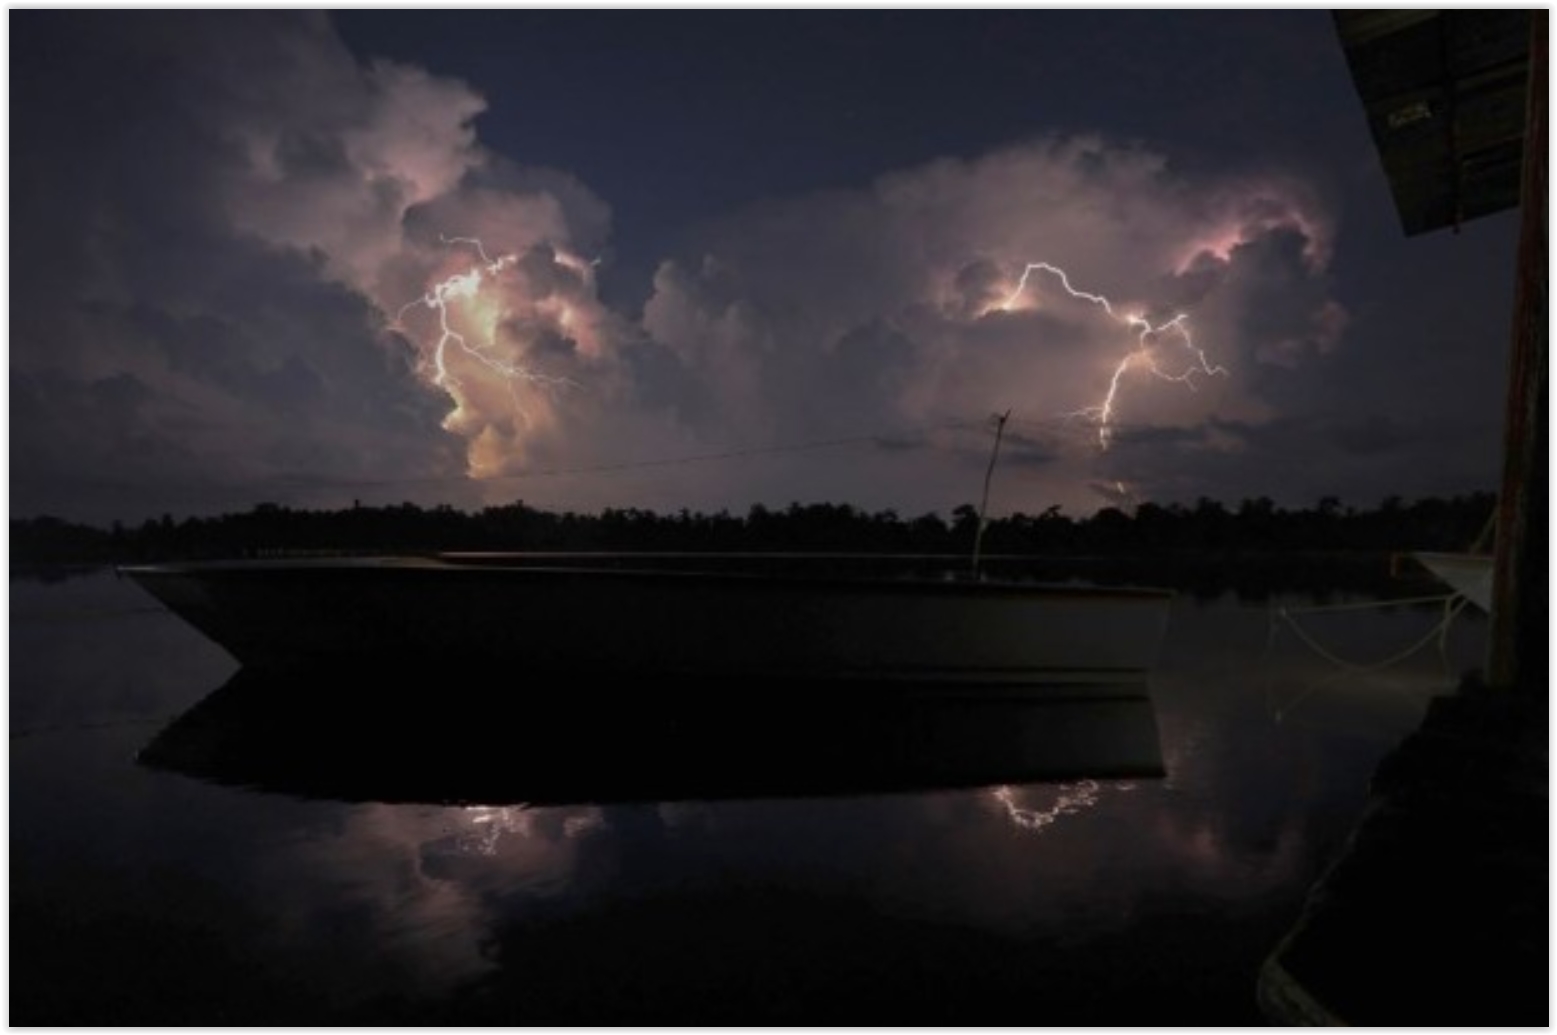
Scientists Crown the Lightning Capital of the World. And here I thought it was Africa’s Congo – here’s an excerpt from CityLab: “Astraphobes who dive under their beds at the first rumblings of a storm should stay away from Venezuela’s Lake Maracaibo, as it’s just been verified as the most lightning-cursed place on the planet. Researchers from Brazil’s Universidade de São Paulo, NASA, and elsewhere poured through 16 years of space observations to give this honorific to what some call South America’s biggest lake (technically, it’s more of a bay or lagoon). Thunderstorms occur an average of 297 nights a year, triggered by a “deep nocturnal convection driven by locally forced convergent flow,” according to a study in this month’s Bulletin of the American Meteorological Society...”
Photo credit above: “Lightning crackles over Lake Maracaibo in Venezuela in this long-exposure shot from 2014.” (Jorge Silva/Reuters).
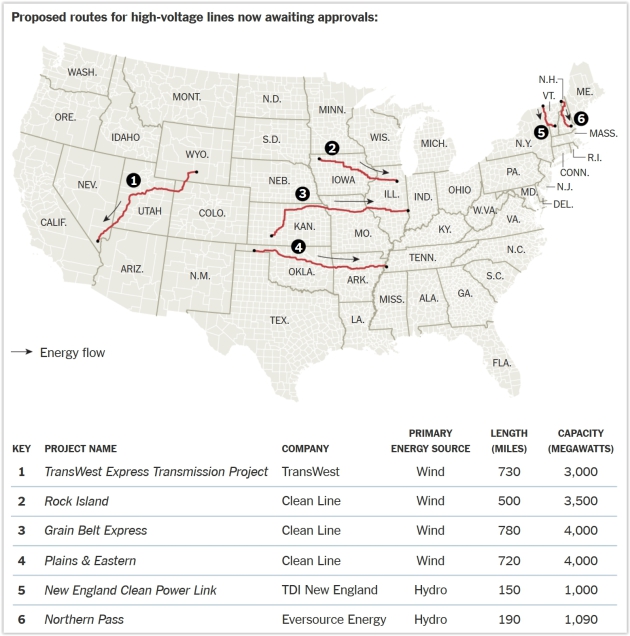
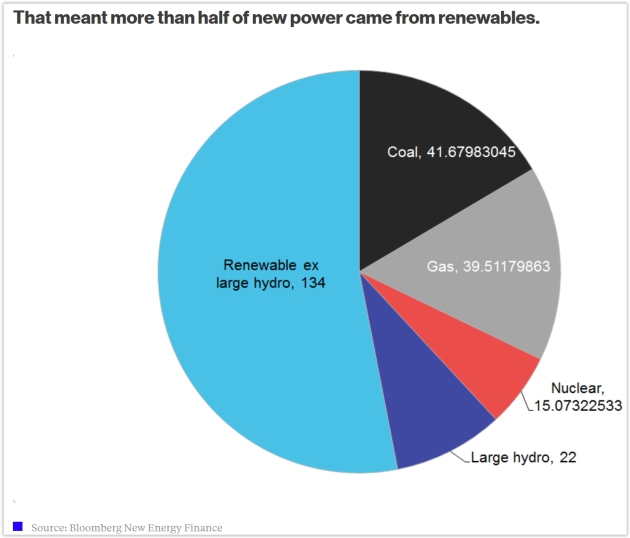
Why Power Markets Tilt Toward Renewables Even With Cheap Oil. Here’s an excerpt from Bloomberg Business: “…The chart above shows the billions of dollars flowing to renewables in both developing and developed economies. It indicates the industry has shifted from a plaything of rich industrial nations into a growing power source for emerging economies — especially places that must import fossil fuels. Government programs to cut pollution in Beijing and New Delhi are one driver. Another is the need for electricity in rural areas far away from a reliable power grid...”
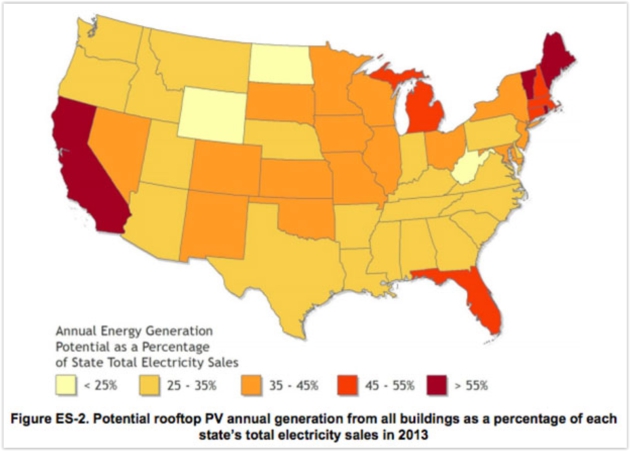
We’ve Barely Begun to Tap The Sun’s Mighty Power. Here’s a clip from Mother Jones: “…Utility-scale solar provides about twice as much power as rooftop panels, so the full potential of solar is likely even higher than what NREL describes in this report. Even 39 percent, though, would be a revolutionary change from where we are now; despite solar’s rapid growth in the last several years, it still accounts for less than 1 percent of electricity consumption. Coal, which is still the nation’s number-one energy source, commands about 32 percent of the market. So the future that NREL is envisioning here would basically flip our energy makeup on its head. The most potential exists in sunny states, obviously, but also in states that have relatively low electricity needs. The map below shows what percentage of each state’s power could be derived from rooftop panels if they were fully utilized...”

What The NFL’s Concussion Scandal Has In Common with Tobacco and ExxonMobil. Grist connects the dots; here’s an excerpt: “…If this sounds familiar, it’s because the NFL’s techniques are like those employed for decades by Big Tobacco to confuse consumers over the scientific research on smoking. In fact, the Times reports, the NFL hired tobacco lawyers, advisors, and lobbyists to help them do exactly that. In the 1990s, for instance, the league employed Dorothy Mitchell, an attorney who had also represented the Tobacco Institute in lawsuits over the health effects of cigarettes and secondhand smoke. All this sounds remarkably like another industry that we now know borrowed tactics from Big Tobacco: oil and gas…” (Image credit: Keith Allison/Flickr Creative Commons).

Bezos Prime. Adam Lashinsky has a revealing article about Amazon’s Jeff Bezos at Fortune. The reincarnation of Steve Jobs? Here’s an excerpt: “…He’s got every reason to cha-cha. More has gone right for Bezos lately than perhaps at any other time during his two-decade run in the public eye. His company is expanding internationally and spreading its hydra-headed product and service offerings in unexpected new directions. Bezos, too, is evolving. Always a fierce competitor and stern taskmaster, he has begun to show another side. With the Post, he’s taken a seat at the civic-leadership table. And with his various projects Bezos is also becoming known as a visionary on topics beyond dreaming up new ways to gut the profit margins of Amazon’s many foes…” (Photograph by Wesley Mann).

Why We Ignore The Litany of Deadly Side Effects in TV Ads for Drugs. If you watch the network news it’s almost all drug ads. They all sound tempting, but which body parts will fall off when I swallow that pill? Here’s an excerpt from Alternet and Salon: “Who doesn’t laugh at drug commercials with their before-and-after scenes of life-changing improvements accompanied by numerous terrifying side effects? But these drug ads continue because they work. Beyond the overt manipulations, there are more covert ones—including techniques that diminish the impact of the required warning section. Former advertising executive Jerry Mander observed that his ex-colleagues in advertising don’t care if you think their commercial is ridiculous or even false, because the image of the product goes into your head anyway, and your insides will always carry this “neuronal billboard”…” (Image: change.org).


EASTER SUNDAY: Partly sunny, pleasant Easter. Winds: NW 8-13. High: 48
MONDAY: Mix of clouds and sun, April-like. Winds: SE 5-10. Wake-up: 35. High: 57
TUESDAY: Balmy for March, late T-storms? Winds: SE 10-20. Wake-up: 42. High: near 60
WEDNESDAY: Heavier rain possible. Mixed rain/snow Wednesday night? Winds: S 15-30. Wake-up: 48. High: 56
THURSDAY: Wet snow tapers, slow clearing. Winds: NW 10-20. Wake-up: 35. High: 43
FRIDAY: Mostly cloudy, chilly again. Winds: NW 15-25. Wake-up: 32. High: 42
Climate Stories…
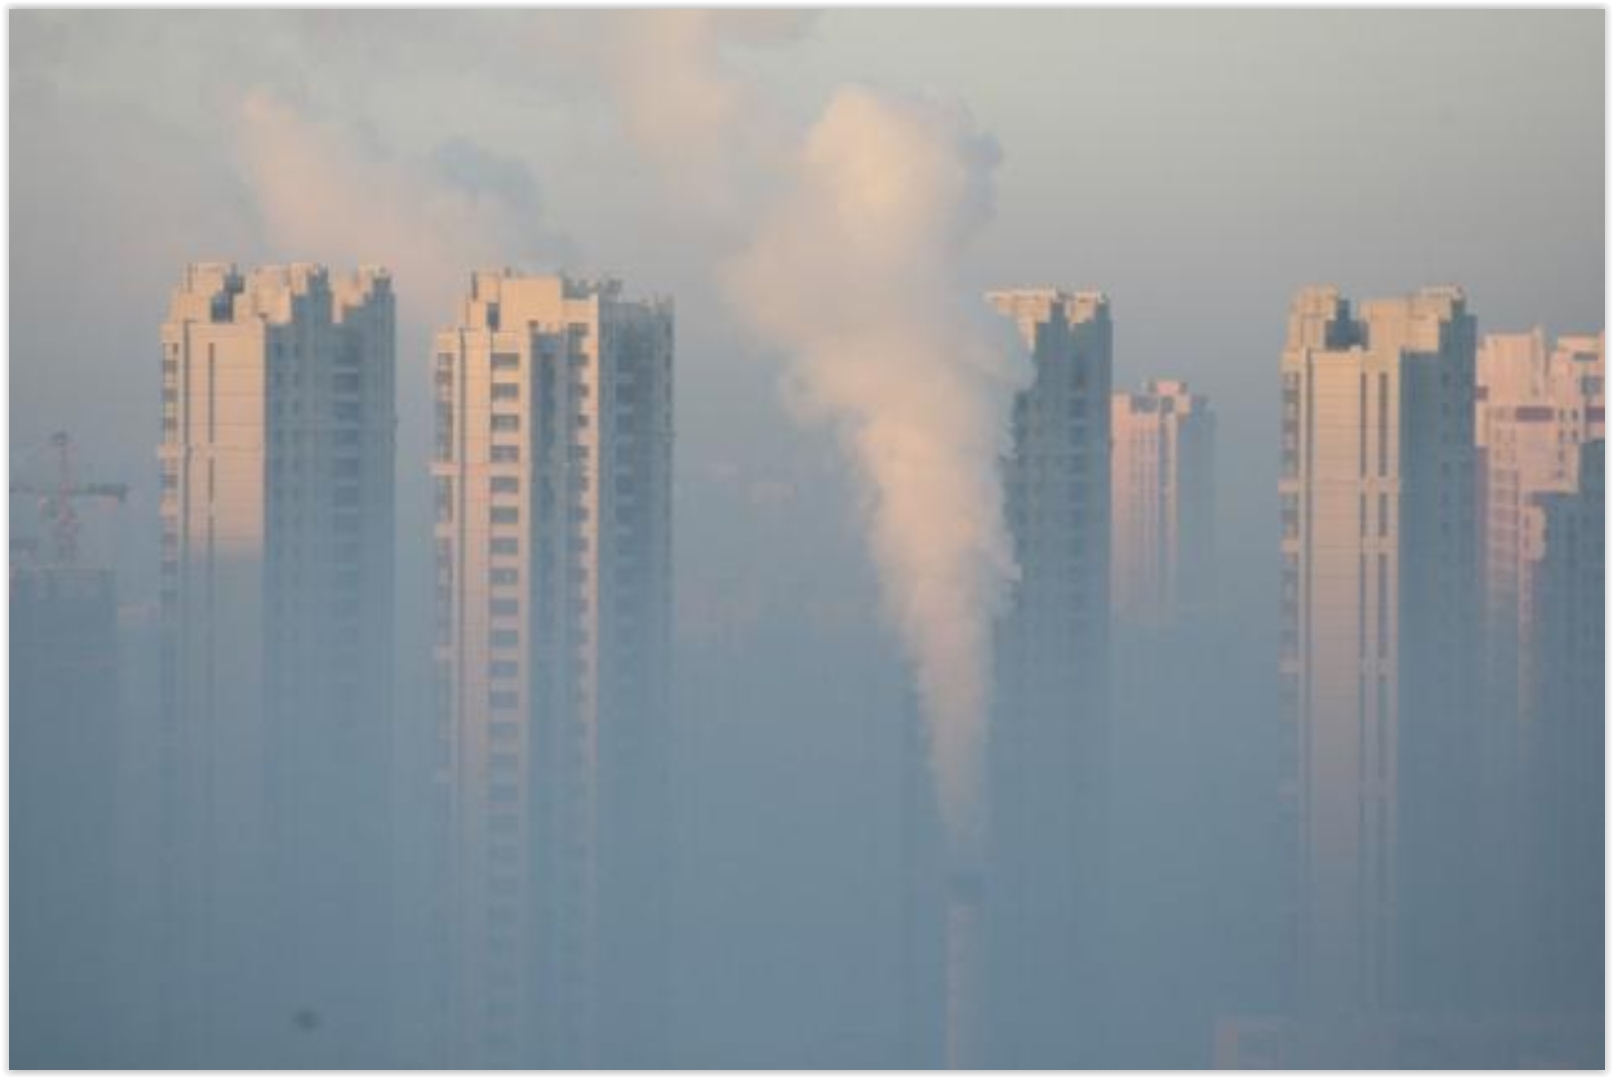
Carbon Emissions Highest in 66 Million Years, Since Dinosaur Age. Here’s the lead to a story at Reuters: “The rate of carbon emissions is higher than at any time in fossil records stretching back 66 million years to the age of the dinosaurs, according to a study on Monday that sounds an alarm about risks to nature from man-made global warming. Scientists wrote that the pace of emissions even eclipses the onset of the biggest-known natural surge in fossil records, 56 million years ago, that was perhaps driven by a release of frozen stores of greenhouse gases beneath the seabed...”
Photo credit above: “A chimney is seen in front of residential buildings during a polluted day in Harbin, Heilongjiang Province, China, January 21, 2016.” Reuters/Stringer.
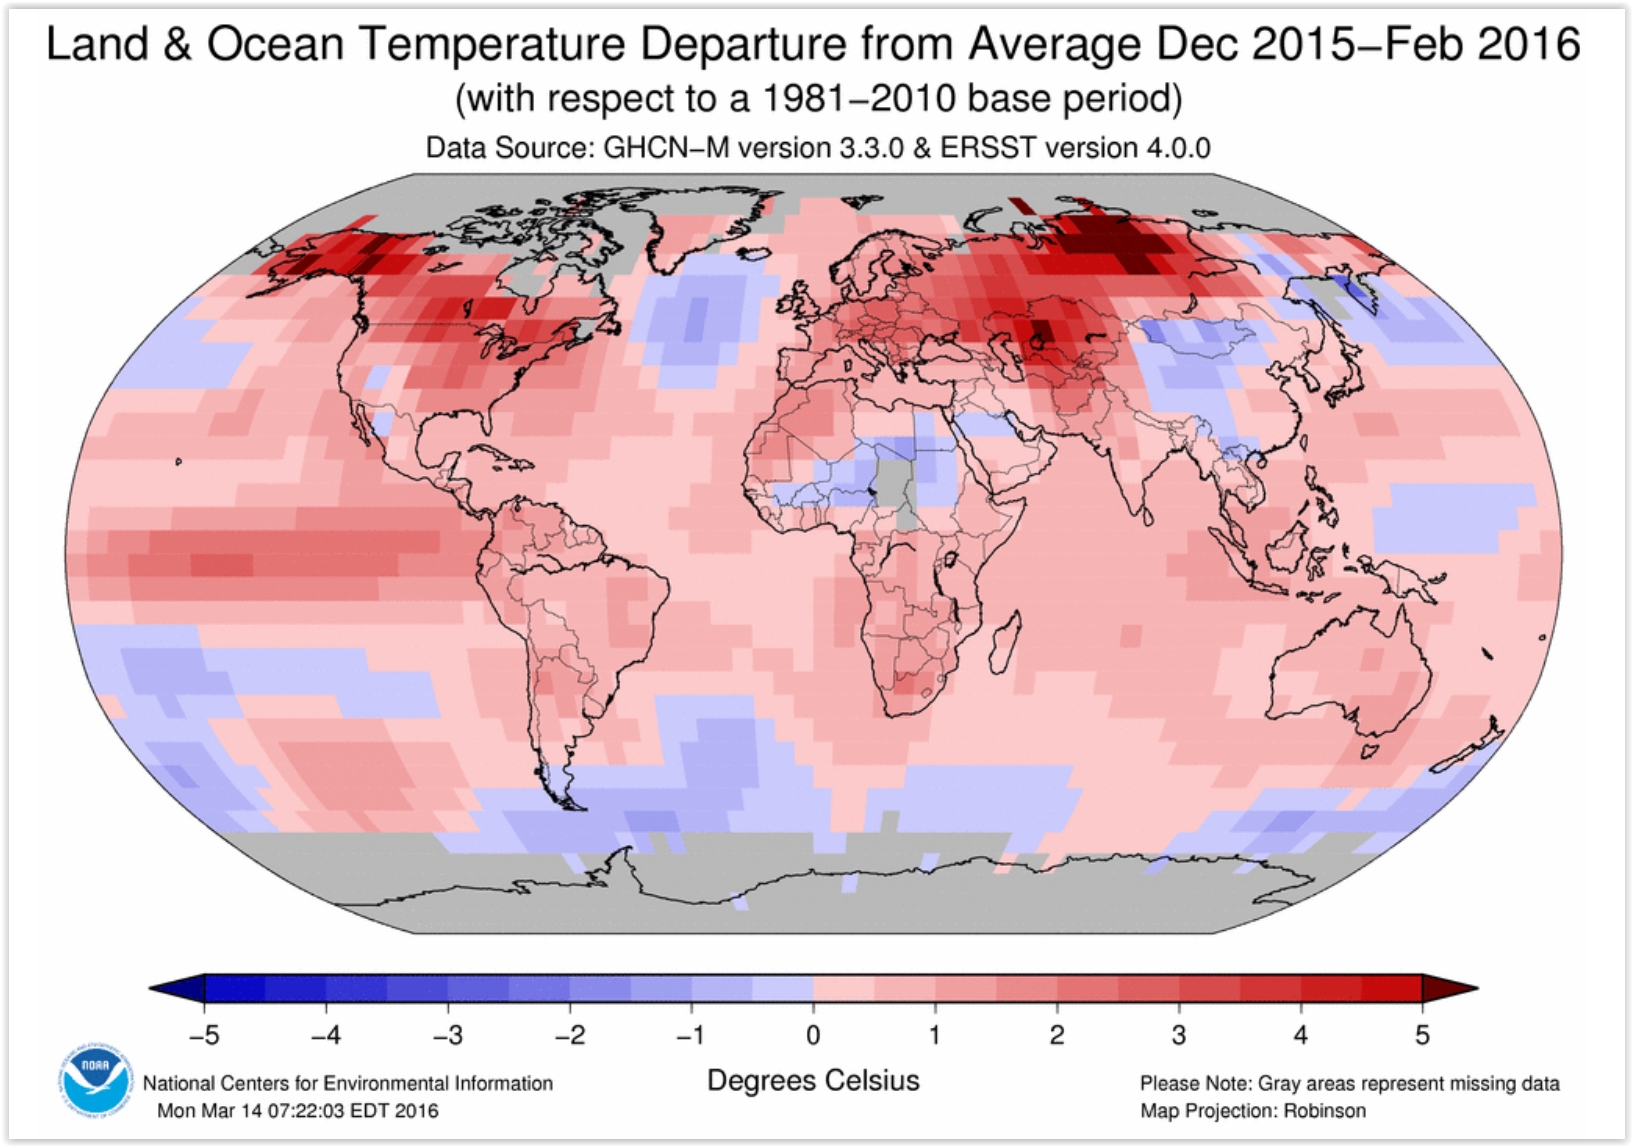
Meteorologists Overwhelmingly Conclude Climate Change is Real and Human-Caused. Here’s an excerpt from Jason Samenow at Capital Weather Gang: “…Seventeen percent of respondents to the survey said their views about climate change had changed over the past five years and, of those, most (87 percent) said they are more convinced than ever that human-caused changes are happening. They were most persuaded by new peer-reviewed studies, the growing scientific consensus on climate change, and evidence of climate change where they live. “[I]t does appear that more meteorologists are now more convinced that human-caused climate change is happening,” said Ed Maibach, lead author of the survey findings and director of George Mason’s Center for Climate Change Communication…”
Map credit above: “Winter 2015-2016 temperature differences from average over globe.” (NOAA).

96% of American Meteorological Society Members Think Climate Change is Happening, Says New Report. Dr. Marshall Shepherd has details at Forbes; here’s a clip: “…The new survey conducted for the AMS by Dr. Ed Maibach (George Mason University) and colleagues clarified several questions. Preliminary results are now available. Key results from the report summary: Nearly all AMS members (96%) think climate change -as defined by AMS-is happening with almost 89% stating that they are either “extremely” or “very sure” it is happening. Only 1% think climate change is not happening. A large majority of AMS members indicated that human activity is causing at least a portion of the changes in the climate over the past 50 years (see summary for details)….Conversely, 5% think the climate is caused largely or entirely by natural events, 6% say they don’t know….”

South Florida’s Mayors Face Reality of Rising Seas and Climate Change. For Miami, The Florida Keys, even Naples and Ft. Myers, it’s gone from theory to “happening right here – right now”. Here’s a snippet of an Op-Ed by Fred Grim at The Miami Herald: “…This sense of emergency shared by the mayors makes for a bizarre contrast to our state leadership. Gov. Rick Scott has donned the mantel as Florida’s denier in chief. (Happily proving it with his veto pen.) Florida’s other leading Florida Republican, Sen. Rubio, once talked about making Florida “the Silicon Valley” of green energy. All that was abandoned when the ever changeable Rubio’s ambition for higher office led him to embrace the tea party’s militant denial of climate science. Rubio must find it a bit disconcerting as he limps back home from his failed political campaign to a community where the civic leadership, Republican and Democrat, has utterly rejected his “I am not a scientist” approach to the climate crisis…”
Image credit: “Miami Beach has put into action an aggressive and expensive plan to combat the effects of sea level rise. As some streets keep flooding from recent king tide events, the city continues rolling out its plan of attack and will spend between $400-$500 million over the next five years doing so.” Emily Michot.
How the U.S. Military’s Not Waiting To Find Out if Climate Change is an Existential Risk. Here’s a clip from a story at The Center for Climate & Security that got my attention: “…Though the term “existential risk” is not found in the directive, the fact that the whole Pentagon organization, across the military readiness, operations and strategy spectrum, will need to put in place specific actions to adapt to climate change, suggests that the issue has reached a level of strategic significance that cannot be ignored. In this context, Johnson interviewed the Center for Climate and Security’s Christine Parthemore to get a better look at the substance of the DoD’s concerns about climate change risks, and what drives them. From the article:
“You can’t be on the ground in Asia, Africa, or the Middle East and not see what’s happening,” said Christine Parthemore, a former Pentagon official who now serves as the executive director of the Center for Climate & Security, a think tank.
“I think that is why we’ve seen so many defense, intelligence, and diplomatic leaders start growing concerned about the security implications of climate change far earlier than our political leaders, academic researchers, or the general public,” she said…”
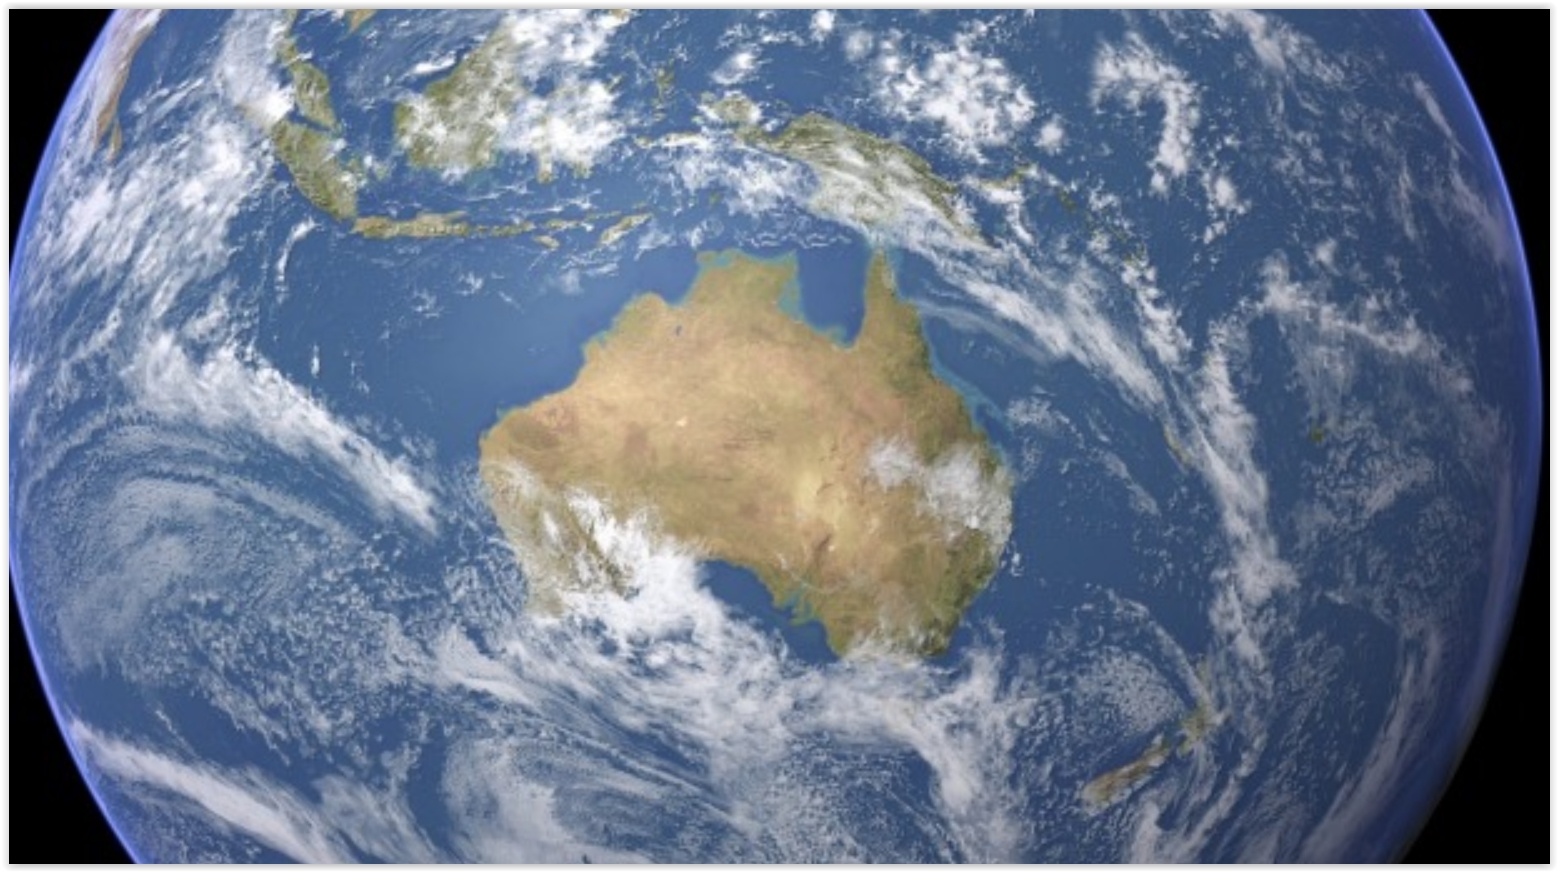
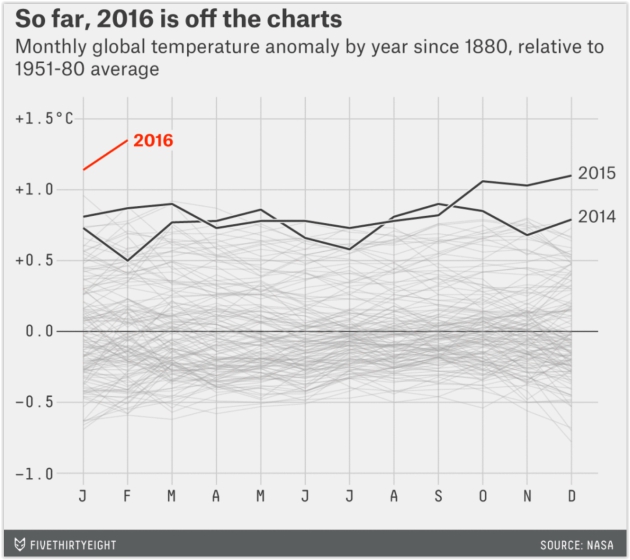
Spike in Global Temperature Fuels Climate Change Fears. According to climate scientist Michael Mann about 50% of the recent (historic) warming is coming from greenhouse gases, 25% from El Nino and another 25% from natural cycles and circulations. El Nino is winding down, but we continue to track unusual warmth. Here’s an excerpt at The Sydney Morning Herald: “…Complacency should be avoided, therefore, when the mercury’s record run inevitably ends in coming months as the El Nino unwinds. “It’s important to take this hot spike as a reminder that this is a really urgent problem” said Professor Rahmstorf, who until last week was also a visiting professorial fellow at the University of NSW. “We are running out of time to avoid a 2-degree world.” The UK Met Office estimated last year we are roughly half way there, based on the estimated average of the 1850-1900 period…”
Image credit above: “Each of the past 10 months has been a record for global surface temperatures, a US agency says.” Photo: Planetary Visions Ltd.

New Hope for U.S. Coastlines Even As Seas Rise. Climate Central takes a look at which shorelines may fare best in the coming years; here’s an excerpt: “Scientists have encouraging news for planners along the Eastern seaboard staring down the worsening crisis of sea level rise: if managed well, most of the region’s shorelines could adapt naturally to the drenching changes that lie ahead. The research, published in the journal Nature Climate Change, offers hope that vulnerable coastal areas could remain above water during the decades ahead, even if some of those areas may change beyond recognition…”
Photo credit above: “A shoreline at Plum Island, a barrier island in Massachusetts.” Credit: Wesley Fryer/Flickr.

How Do You Decide To Have a Baby When Climate Change is Remaking Life on Earth? The Nation has a poignant story; here’s a clip: “…In a 2009 report, statisticians at Oregon State University determined that giving birth to one more American “adds about 9,441 metric tons of carbon dioxide to the carbon legacy of an average female.” Factoring in grandchildren and great-grandchildren, it multiplies her “lifetime emissions” by a factor of nearly six. The OSU study is one of many recent attempts to quantify the environmental impact of parenthood. But it didn’t make sense, I thought, to filter the world’s most pressing environmental dilemma through the private choices of an individual woman. That analysis left out significant pieces of the puzzle. The average woman couldn’t, by herself, wrench billions of barrels of oil and tons of coal out of North American soil and sell them overseas, or stonewall policies that might have steered the US economy away from fossil fuels years ago…” (Illustration by Karl-Raphael Blanchard).
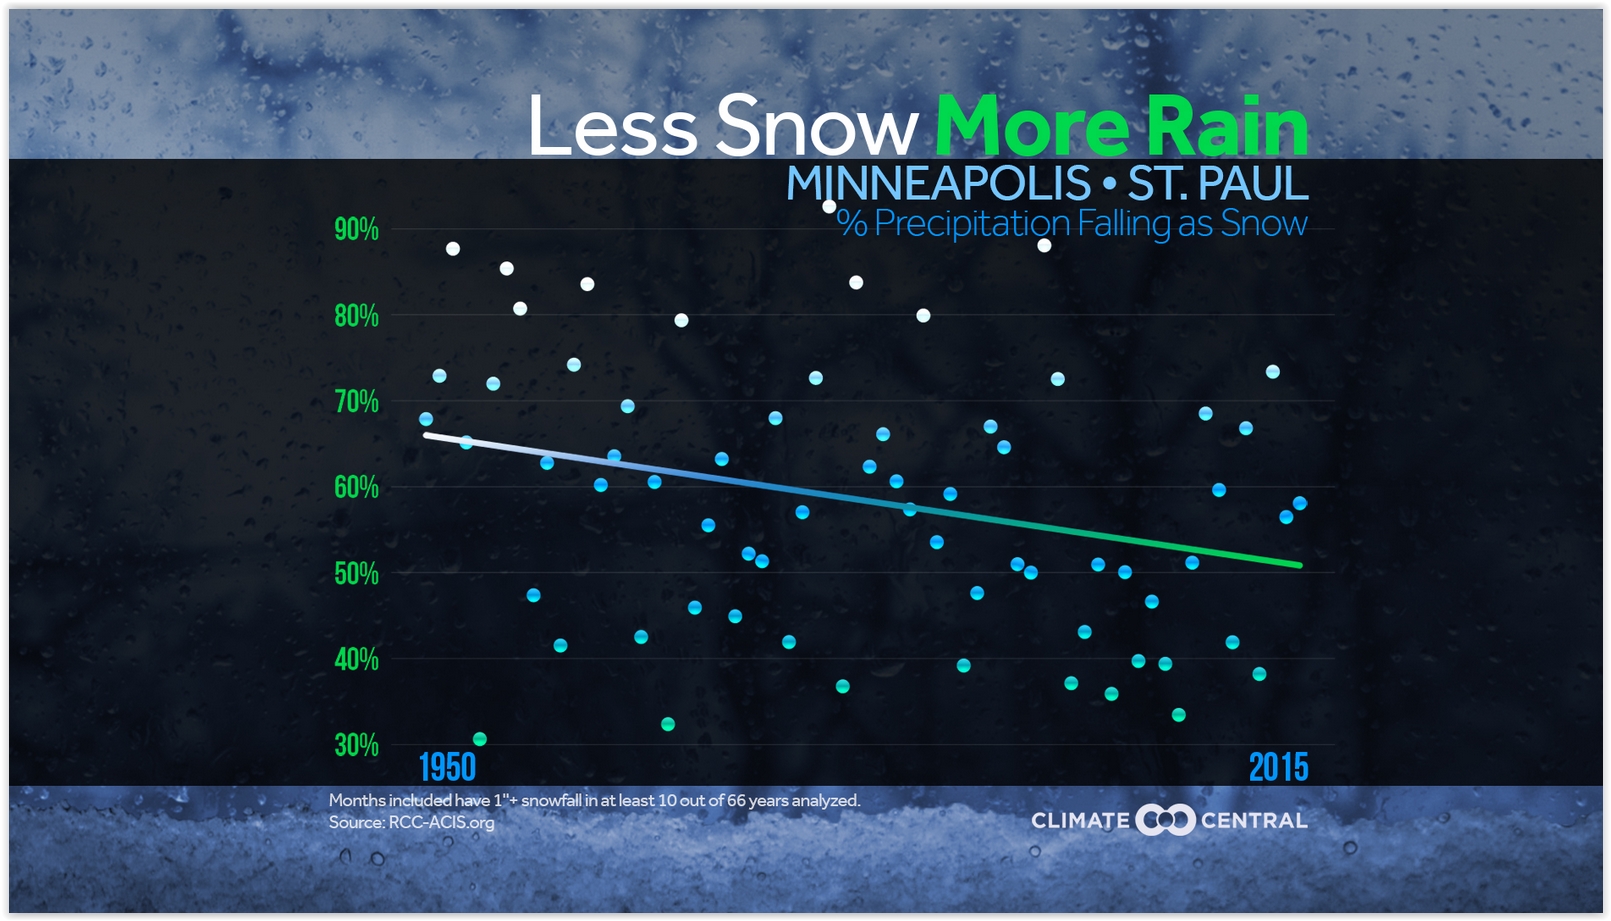
Winter Precipitation: More Rain, Less Snow. Climate Central takes a look a larger trends – here’s an excerpt: “…Even in a warming world, snow will fall. However, the amount of snow and when it falls will likely change as greenhouse gases build up in the atmosphere. We examined cold season precipitation at stations across the country, specifically looking at how much snow is falling compared to rain. Our analysis is consistent with earlier EPA findings. The Northwest and the Upper Midwest are the climate regions seeing the largest decreases in precipitation falling as snow over the past 66 years…”
Leading Climate Scientists: “We Have a Global Emergency”, Must Slash CO2 ASAP. All those predictions James Hansen made back in the 80s have come true; if anything he was conservative, so it might be reckless to ignore his latest findings – and predictions. Here’s an excerpt from ThinkProgress: “…The study is significant not just because it is peer-reviewed, but because the collective knowledge about climate science in general and glaciology in particular among the co-authors is quite impressive. Besides sea level rise, rapid glacial ice melt has many potentially disastrous consequences, including a slowdown and eventual shutdown of the key North Atlantic Ocean circulation and, relatedly, an increase in super-extreme weather. Indeed, that slowdown appears to have begun, and, equally worrisome, it appears to be supercharging both precipitation, storm surge, and superstorms along the U.S. East Coast (like Sandy and Jonas), as explained here...” (Map credit: Climate Central).
James Hansen’s Apocalyptic Sea Level Study Lands to Mixed Reviews. Climate Home has the update.
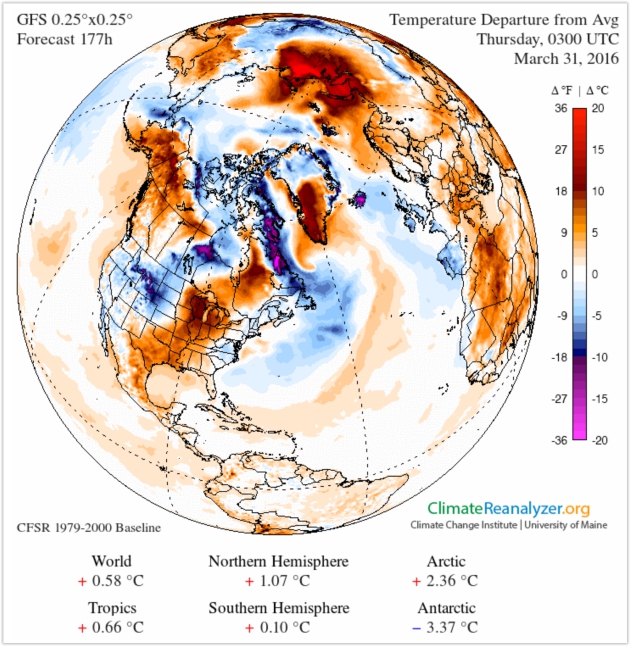
The Arctic Is Thawing Much Faster Than Expected, Scientists Warn. Chris Mooney reports at The Washington Post: “Amid blowout warm temperatures in the Arctic this year, two new studies have amplified concerns about one of the wild cards of a warming planet — how quickly warming Arctic soils could become major contributors of greenhouse gases to the atmosphere, causing still greater warming. In a major international study published last week in Nature Geoscience, a team of researchers from regions ranging from Alaska to Russia report that permafrost is thawing faster than expected — even in some of the very coldest areas…” (Map credit: Climate Reanalyzer).
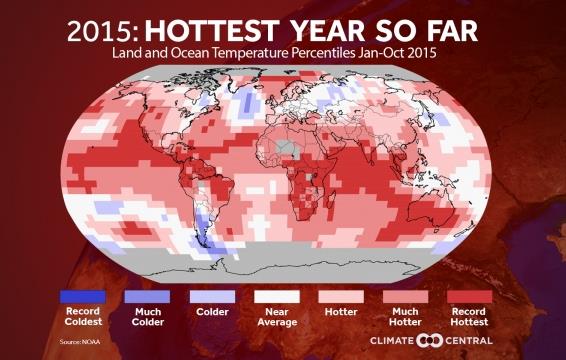
When Will The World Really Be 2 Degrees Hotter Than It Used To Be? Meteorologist Eric Holthaus has the story at FiveThirtyEight; here’s an excerpt: “Climate data is a fussy thing, with a bunch of different organizations measuring data against a bunch of different baselines. But all of them agree on one thing: Last month, the Earth endured a heat wave that has had no equal in the hundred-plus years humans have been keeping close track of our home planet’s climate. Take data from NASA, which showed that February was (by far) the most unusually warm month since it began keeping records: 1.35 degrees Celsius above the 1951-80 global temperature average and, depending on how you do the math, as much as 2 degrees above pre-industrial levels…”
