.png)
.png)
.png)
 Weather Outlook

__________________________________________________________________________
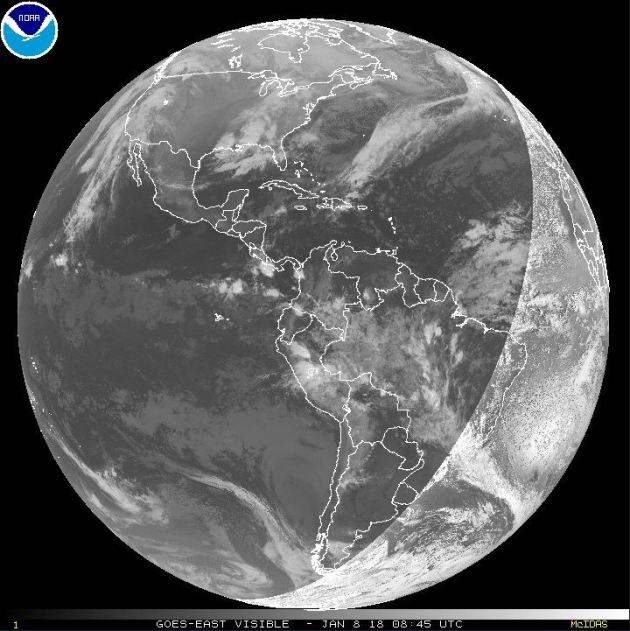
Great Lakes Ice Coverage
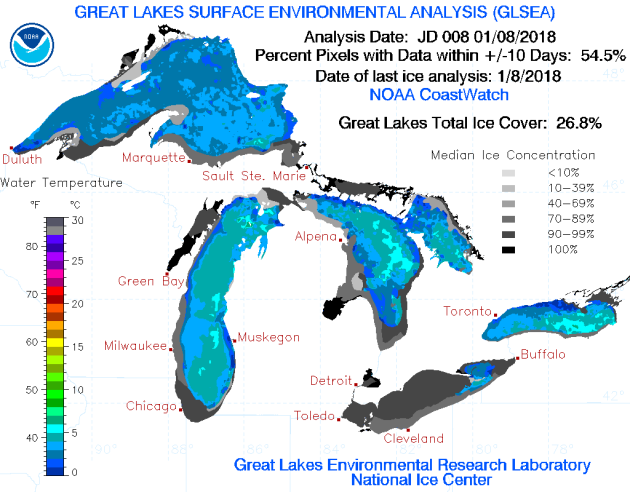
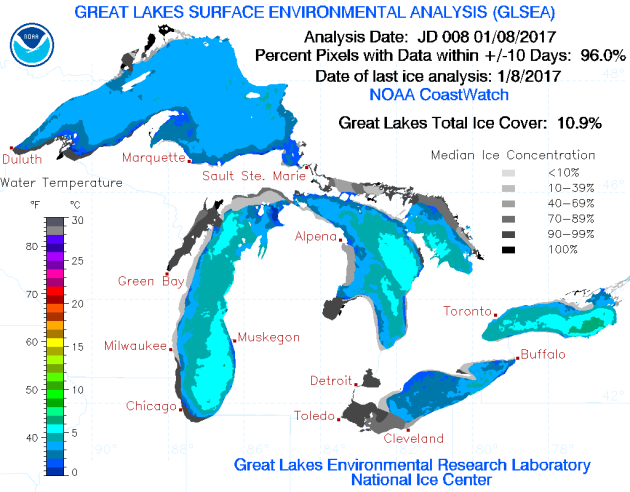
_________________________________________________________________________
____________________________________________________________________________
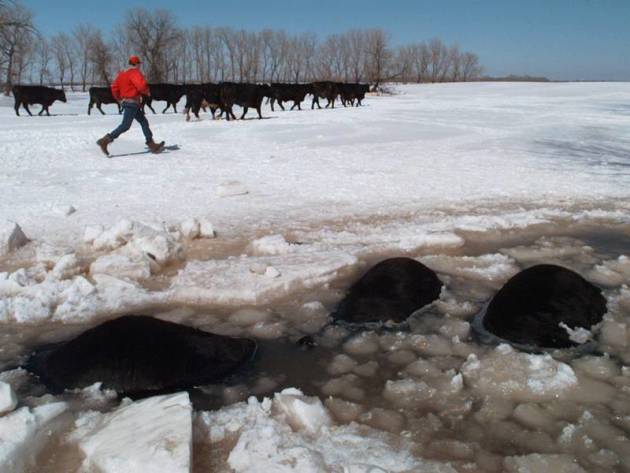
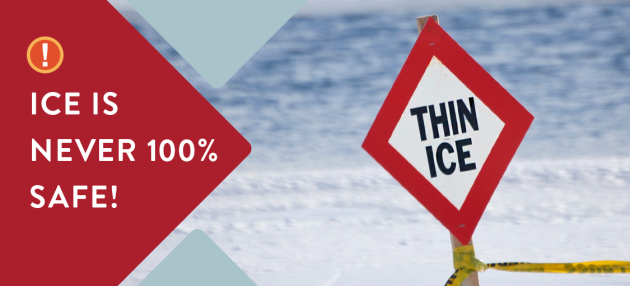
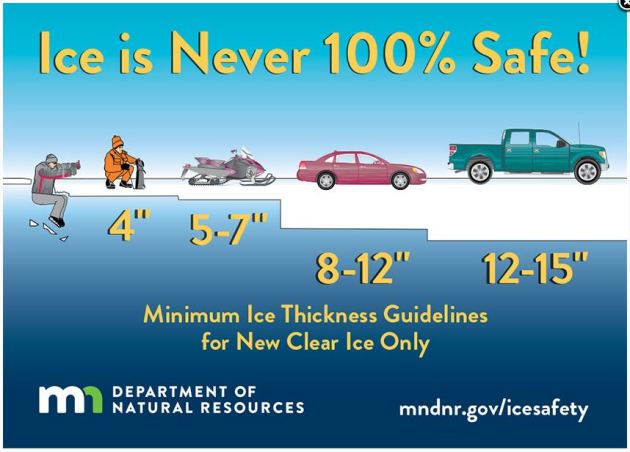
General Ice Thickness Guidelines
Under 4″ – STAY OFF
4″ – Ice fishing or other activities on foot
5″ – 7″ – Snowmobile or ATV
8″ – 12″ – Car or small pickup
12″ – 15″ – Medium truck
Many factors other than thickness can cause ice to be unsafe.
White ice or “snow ice” is only about half as strong as new clear ice. Double the above thickness guidelines when traveling on white ice.
___________________________________________________________________
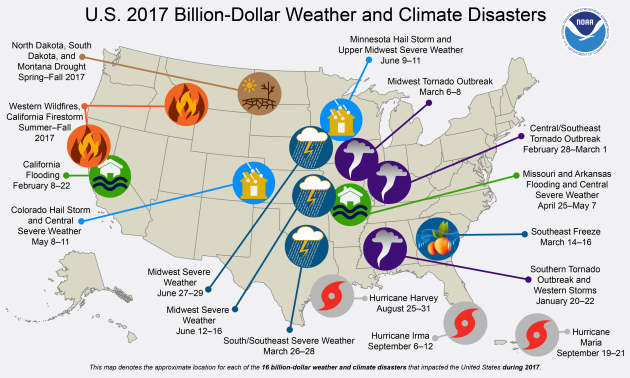
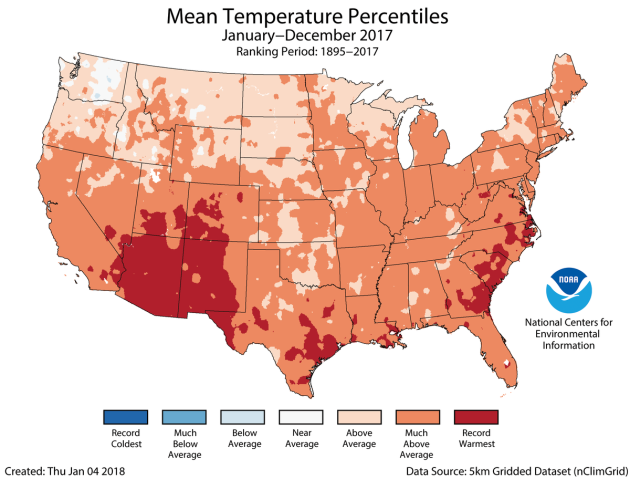
In 2017, there were 16 weather and climate disaster events with losses exceeding $1 billion each across the United States. These events included 1 drought event, 2 flooding events, 1 freeze event, 8 severe storm events, 3 tropical cyclone events, and 1 wildfire event. Overall, these events resulted in the deaths of 362 people and had significant economic effects on the areas impacted. The 1980–2017 annual average is 5.8 events (CPI-adjusted); the annual average for the most recent 5 years (2013–2017) is 11.6 events (CPI-adjusted).”
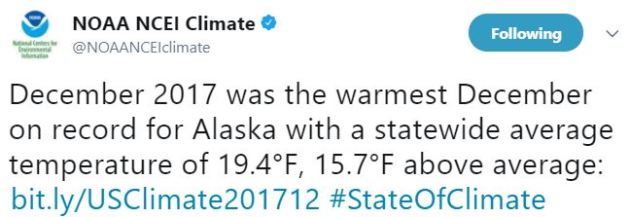
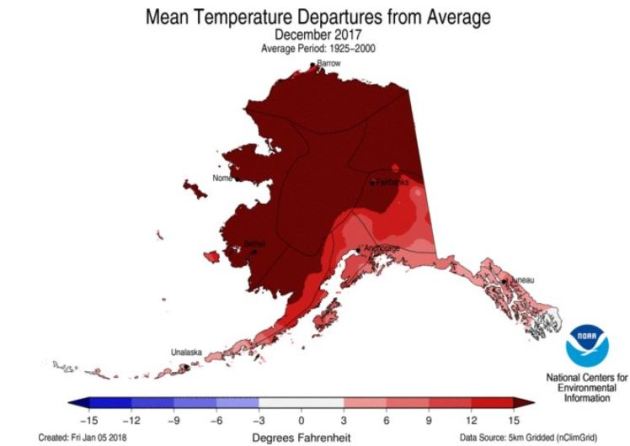
____________________________________________________________________________Warmest December on Record For Alaska!
According to NOAA, December 2017 was the WARMEST December on record with an average temperature of 19.4F, which was nearly 16F above average! WOW! The average December temperature in the Twin Cities finished -0.8F below average.
_____________________________________________________________________________
.png)
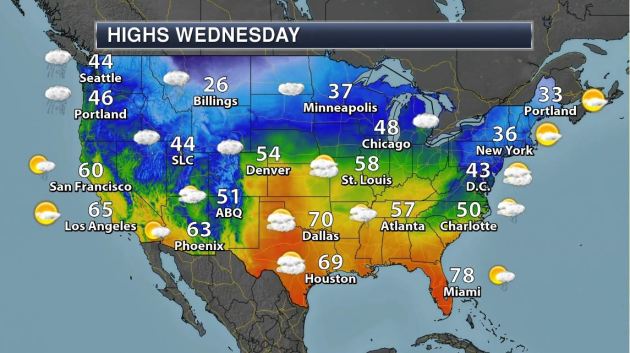
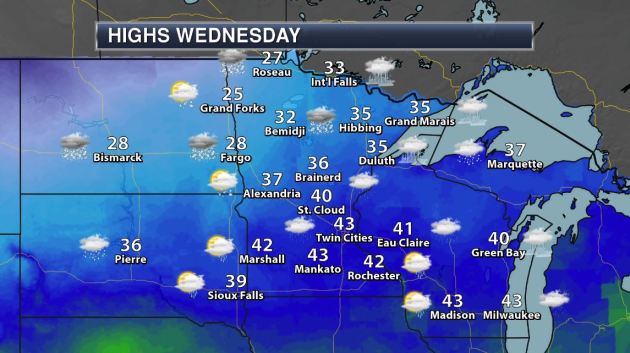
High Temps Wednesday
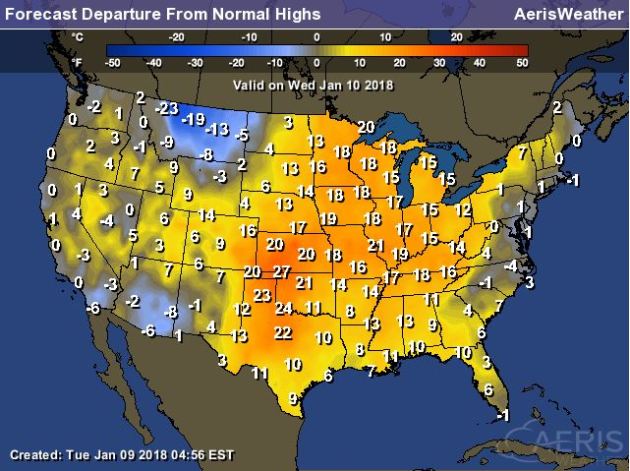
Temps across much of the nation will be warmer than average for January 10th, which will be a BIG difference from where most of us where over the last couple of weeks.
.gif)
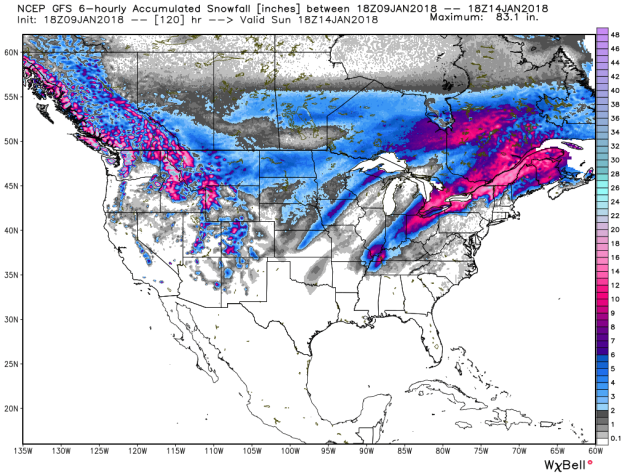
According to NOAA’s WPC, the 5 day precipitation outlook suggests areas of heavy precipitation across the Western US with several inches of liquid possible in the high elevations. There could be feet of snow in the mountains through the weekend, especially in the Cascades. Several inches of liquid will also be possible east of the Mississippi as heavy rain changes to snow later this week and into the weekend.
.gif)
1.) Much below normal temperatures for parts of the Plains, Mississippi Valley, Great Lakes, and Appalachians, Fri-Tue, Jan 12-16.
2.) High winds for parts of the Great Lakes, Sat, Jan 13.
3.) Heavy precipitation for parts of the Great Lakes, Ohio and Tennessee Valleys, Central and Southern Appalachians, Mid-Atlantic, and Northeast, Fri-Sat, Jan 12-13.
4.) Heavy precipitation for the South Coast of Alaska between Kodiak and Yakutat, and parts of the Alaska Panhandle, Fri-Sun, Jan 12-14.
5.) Much above normal temperatures for parts of southern Alaska near Kodiak Island, Anchorage, and south of the Alaska Range, Sat-Sun, Jan 13-14.
6.) Periods of high Winds for the South Coast of Alaska, parts of Southwest mainland Alaska, the Alaska Peninsula, and the Alaska Panhandle, Fri-Mon, Jan 12-15.
7.) Periods of high significant wave heights for the South Coast of Alaska and the Alaska Panhandle, Fri-Mon, Jan 12-15.
8.) Slight risk of much below normal temperatures for much of the eastern third of the CONUS (except New England and eastern New York), Wed-Thu, Jan 17-18.
9.) Moderate risk of much below normal temperatures for parts of the Ohio Valley and Great Lakes, Wed, Jan 17.
10.) Slight risk of much below normal temperatures for parts of the Northern Plains and Upper Mississippi Valley, Sat-Tue, Jan 20-23.
11.) Slight risk of heavy precipitation for much of the western and central CONUS, Wed-Sun, Jan 17-21.
12.) Moderate risk of heavy precipitation for parts of the Great Basin, California, and the central and Northern Rockies, Wed-Fri, Jan 17-19.
13.) High risk of heavy precipitation for parts of the Great Basin and California, Wed-Fri, Jan 17-19.
14.) Moderate risk of heavy precipitation for parts of the central and southern Plains and Middle Mississippi Valley, Wed-Fri, Jan 17-19.
15.) Moderate risk of heavy precipitation for parts of the Middle and Upper Mississippi Valley, Fri-Sun, Jan 19-21.
16.) Slight risk of heavy precipitation for parts of the northeast, Sun-Tue, Jan 21-23.
17.) Severe drought for parts of the Northern Plains, the Southwest, the central and southern Plains, the central and southern Mississippi Valley, and Hawaii.
.png)
_____________________________________________________________________
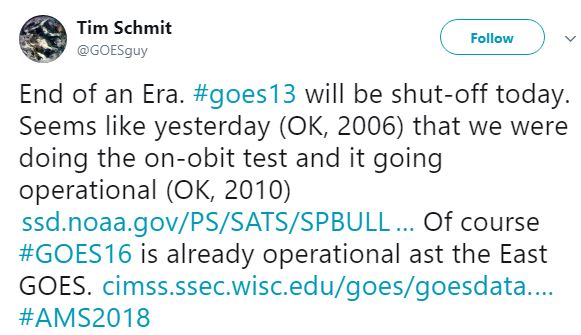
Three times more spectral information
Four times greater spatial resolution
Five times faster coverage
Real-time mapping of total lightning activity
Increased thunderstorm and tornado warning lead time
Improved hurricane track and intensity forecasts
Improved monitoring of solar x-ray flux
Improved monitoring of solar flares and coronal mass ejections
Improved geomagnetic storm forecasting
____________________________________________________________________
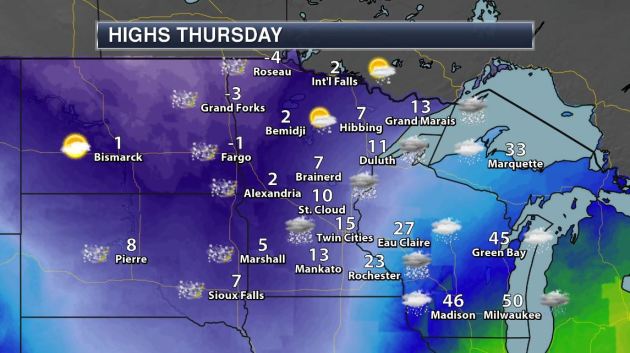
Warm Wednesday, Snow Thursday and a Frigid Friday
By Todd Nelson, filling in for Douglas.
Drip, drip, drip… that’s the sound of what’s left of our measly snow pack melting across the region again today.
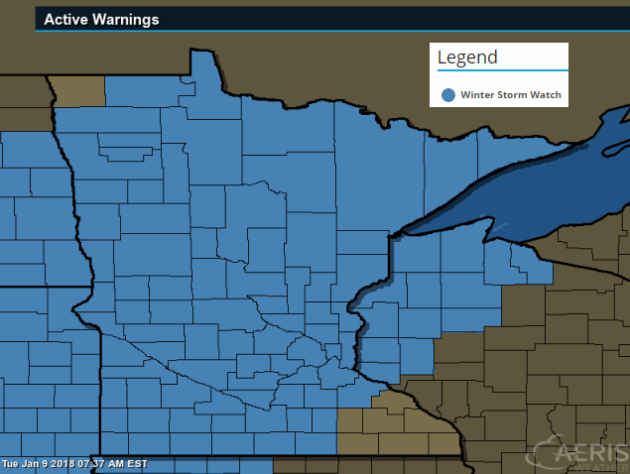
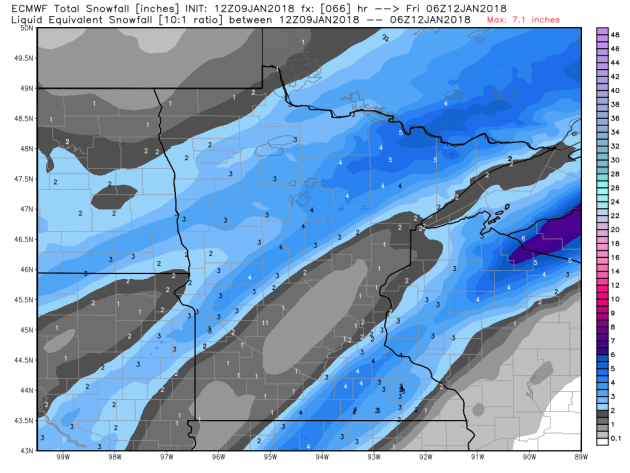
Our well deserved thaw continues one more day as highs flirt with 40 degrees ahead of a fairly potent storm system that will bring snow, strong wind and another shot of Arctic air to the Upper Midwest through the end of the week. Rumors of snow have been spreading like wildfire at the water cooler, but this particular storm doesn’t look like a major snow maker.
Weather models have been hinting at a very narrow band of plowable snow (only a county-wide) setting up over southeastern Minnesota into western Wisconsin; A near miss for the Twin Cities once again?? Those hoping for a blockbuster storm, this isn’t it. Areas that don’t get hit by the narrow band of heavy snow will see lighter amounts, but blustery winds Thursday could still cause blowing snow and travel issues!
Temps will tumble Thursday as our next batch of Arctic air arrives. The weekend will be face-numbing, better suited for peering out the window. UGH!
________________________________________________________________________
Extended Forecast
WEDNESDAY: Cloudy and mild with areas of drizzle developing late. Winds: S 5-10. High: 42.
WEDNESDAY NIGHT: Wintry mix turns to snow. 1″ to 2″ possible by morning. Winds: NNW 10-15. Low: 12.
THURSDAY: Snow early (heaviest just southeast of the Twin Cities), then turning blustery and colder. Winds: NW 15-30. High: 15 and falling.
FRIDAY: Another cold shot. Light snow at night. Winds: NE 5-10. Wake-up: -8. High: 6.
SATURDAY: AM flurry. Arctic PM sunshine. Winds: NW 5. Wake-up: -6. High: 2.
SUNDAY: Clipper arrives late. Fluffy coating. Winds: S 5. Wake-up: -13. High: 4.
MONDAY: Still cold. A few flakes possible. Winds: NW 5-10. Wake-up: -11. High: 2.
TUESDAY: Last really cold day. Winds: SSW 5-10. Wake-up: -12. High: 5.
_______________________________________________________
This Day in Weather History
January 10th
1990: A January ‘heat wave’ forms. MSP Airport warms to 49 degrees.
1975: The ‘Blizzard of the Century’ begins. Also called the ‘Super Bowl Blizzard,’ it was one of the worst blizzards ever. The pressure hit a low of 28.62. This was the record until 1998.
_______________________________________________________
Average High/Low for Minneapolis
January 10th
Average High: 23F (Record: 52F set in 2012)
Average Low: 7F (Record: -30F set in 1886)
Record Rainfall: 1.13″ set in 1975
Record Snowfall: 4.0″ set in 1976
_________________________________________________________
Sunrise/Sunset Times for Minneapolis
January 10th
Sunrise: 7:49am
Sunset: 4:52pm
Hours of Daylight: ~9 hours & 2 seconds
Daylight GAINED since yesterday: ~ 1 minute & 29 seconds
Daylight GAINED since winter solstice (December 21st): 16 minute
__________________________________________________________
Moon Phase for January 10th at Midnight
2.4 Days Before Last Quarter Moon
_________________________
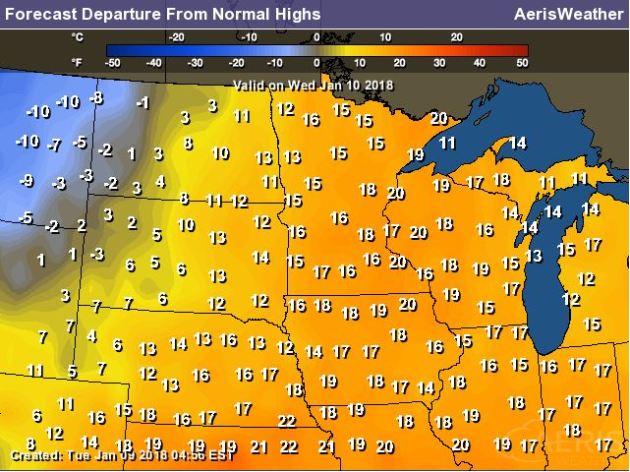
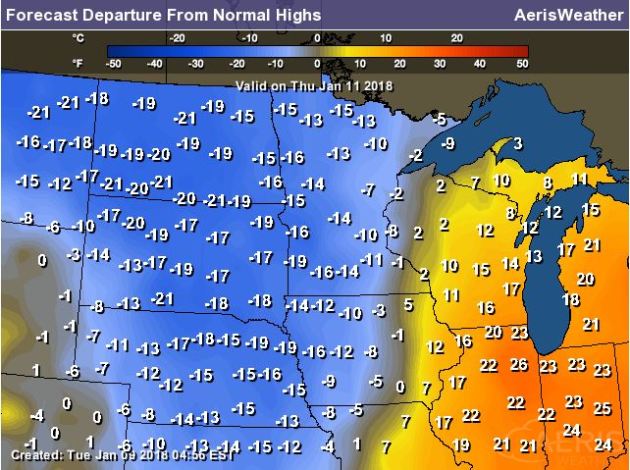
High temps on Wednesday will be MUCH warmer than it has been over the last couple of weeks. This will likely be some of the warmest weather we’ve seen since just before Christmas! Highs across the state of MN will be nearly +5F to +20F above average!
__________________________________________________________________________
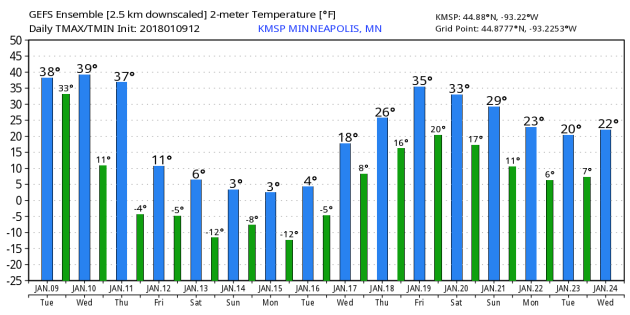
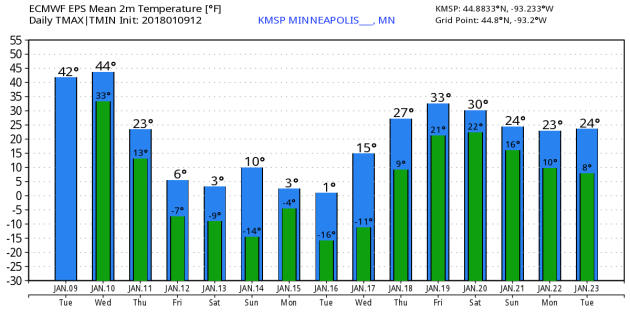
Here’s the temperature outlook as we head through the 3rd weekend of January, which suggests that warmer than average temperatures will be in place again across much of the Midwest! It will come after another shot of cold air that will move in later this week and slide out sometime late next week.
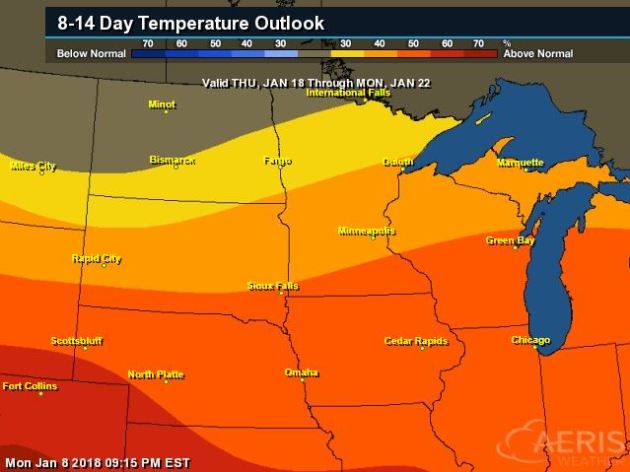
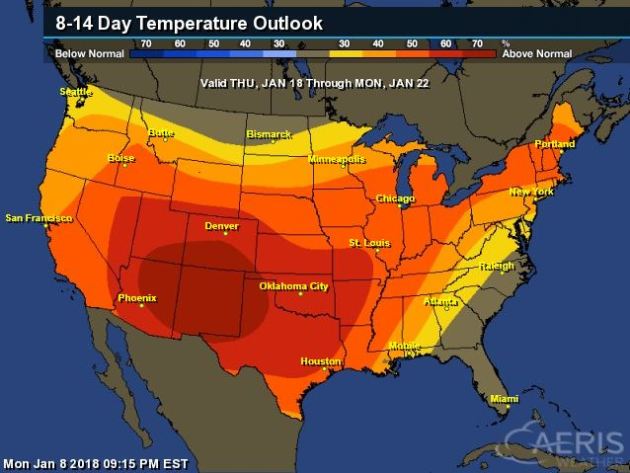
8 to 14 Day Temperature Outlook
How the tides have turned! Here’s the extended temperature outlook from January 18th to January 22nd, which suggests warmer than average temperatures across much of the nation! This will be a dramatic shift in what many of us had over the last couple/few weeks!
______________________________________________________________________________
_______________________________________________________________________________
___________________________________________________________________________
- Winter cold kills more than twice as many Americans as summer heat does.
- In one study, men rated pictures of women’s breasts and bodies as more attractive in the winter months, while they rated pictures of women’s faces the same. Researchers believe men don’t see women’s bodies as much during the winter, so they’re more excited when they do.
- The Southern Hemisphere typically has milder winters than the Northern Hemisphere. This is because the Southern Hemisphere has less land and a more maritime climate.
- While it seems counterintuitive, Earth is actually closest to the sun in December, even though winter solstice is the shortest day of the year.
See more from Fact Reviewer HERE:
___________________________________________________________________________
“How to keep your skin from falling off this winter”
“After spending the weekend in sub-zero weather, my lips are so chapped I can’t even think of a joke about how chapped they are. The state of my lip skin is frankly no laughing matter at this time. But luckily, there are ways to avoid losing your skin to a brutal winter. Why does my skin give up on being skin every winter? In theory, your skin—your largest organ—serves to keep water sealed within your body. But even if your skin is usually dewy and perfect, it probably flakes on the job a bit during the winter months.”
See more from Popular Science HERE:

____________________________________________________________________________
“EVERY STATE, RANKED BY HOW MISERABLE ITS WINTERS ARE”
“In most of America, winter sucks. It is cold out. You don’t feel like doing anything, so you get fat. Pipes freeze. Lips, noses, and cheeks get chapped and raw. Black ice kills. Snow hats look cool until you have to take them off indoors and then your hair looks shitty. It’s horrible. As two people who grew up in the Midwest and New England, Matt and I have both experienced the personal hell that is winter’s awkwardly long, frigid embrace, but we had yet to figure out which, amongst all of the 50 states, could hold up the title as the state with the worst winter. And so began an intense period of research and debate, factoring in everything from weather patterns, average temperatures, and how effective and quickly their department of transportation clears highways, to interviews with locals and the historical success rates of their winter-season sports teams. This is one of those things where you probably actually want to finish last.”
____________________________________________________________________________
“I’m sick of ‘supermoons’ and ‘superstorms’ and ‘bomb cyclones’”
“It used to just get cold. It used to just snow. The moon used to just be . . . the moon. Sometimes the moon was a little sliver. Sometimes it was full. Mostly it was in between. Not anymore. These days, nothing can be normal. Now a full moon is a “supermoon.” A cold snap is a “polar vortex.” A snowstorm is a “bomb cyclone.” Really? A bomb cyclone? That doesn’t even make sense. Shouldn’t it be cyclone bomb? Actually, it should be: “It’s January. It’s going to be cold. It may get windy. It may snow.” But I guess that wouldn’t sell cereal. Here’s my plan for making America great again: Get rid of all these superfluous superlatives. They’re like the “Breaking News” graphic that runs endlessly along the bottom of the CNN feed, purporting to herald something special but serving merely to numb us with its needless overuse. [This researcher helped coin the term ‘bomb cyclone.’ He did it to keep people safe.] I blame the wind chill, invented in the 1970s to let the TV Weather Guy pad his report. The wind chill was the perfect data point for the Me Decade. No longer was it good enough to just tell us what the thermometer said. We had to know how the thermometer made us feel. Awww, Mercury’s in retrograde and I feel fwozen.”
See more from WashingtonPost HERE:
____________________________________________________________________________
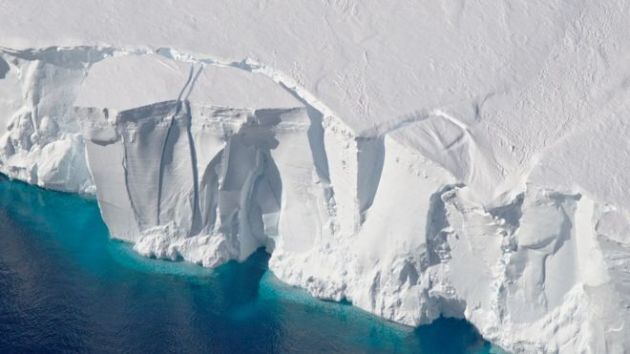
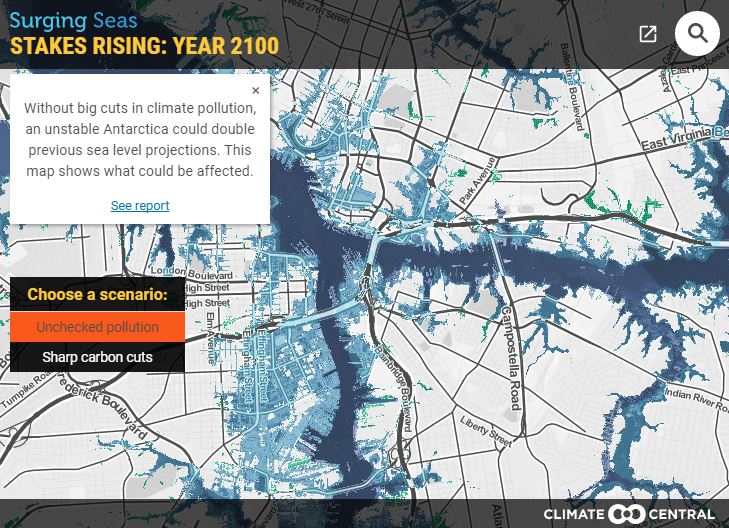
“Antarctic Modeling Pushes Up Sea-Level Rise Projections”
“Antarctic ice sheet models double the sea-level rise expected this century if global emissions of heat-trapping pollution remain high, according to a new study led by Dr. Robert Kopp of Rutgers University and co-authored by scientists at Climate Central. Global average sea level is expected to rise by one foot between 2000 and 2050 and by several more feet by the end of the century under a high-pollution scenario because of the effects of climate change, according to the projections in the new peer-reviewed study. It shows 21st century sea-level rise could be kept to less than two feet if greenhouse gas emissions are aggressively and immediately reduced, reflecting a larger gap in sea-level consequences between high and low emissions scenarios than previous research has indicated. The study provides a median projection for sea-level rise of 146 cm (4’9”) during the 21st century under a high-pollution scenario known as RCP8.5 (see Table 1), when results from new modeling of Antarctic ice sheet behavior are included. The Intergovernmental Panel on Climate Change’s most recent report, published in 2014, which assumed the Antarctic ice sheet would remain stable, provided a median projection for the same scenario during a similar time period of 74 cm (2’5”).”
See more from Climate Central HERE:
_____________________________________________________________________________
Thanks for checking in and don’t forget to follow me on Twitter @TNelsonWX