81 F. high in the Twin Cities Thursday.
82 F. average high on June 26.
89 F. high on June 26, 2013.
Saturday: wetter day of the weekend.
Sunday: warmer day of the weekend with more sun, slight severe T-storm risk.

Good Timing?
Breaking news: we may have to sacrifice this weekend for a blue-sky, 3-star, award-winning 4th of July. That’s the weather headline.
Our in-house statistician informs me that the first 26 days of June brought 86 percent of the moisture we normally see during an ENTIRE meteorological summer; June 1 to August 30. We’ve picked up 82 percent of the moisture we see during an entire year, on average.
Translation: our state is seriously saturated and any heavy rain this weekend will almost immediately run off into streets and streams. Models print out 1-2 inches of additional rain by Monday, but that’s an average. Some communities will see more, others less.
T-storms with downpours arrive today and Saturday; a few storms Sunday may spark damaging winds, hail and an isolated tornado – as highs surge well into the 80s and an unstable atmosphere begins to bubble and boil.
A strong surge of cooler, drier Canadian air arrives next week. Sweatshirts may be required by midweek up north, but an expansive bubble of high pressure treats us to bright sun, light winds and low humidity July 3-4, then (wait for it..) more T-storms next weekend.
Think of it as karma. We’ve earned a memorable 4th.
* Photo credit upper left: Brad Birkholz.
1.26″ rain predicted for MSP (00z NAM model).
1.6″ rain by Monday (12z ECMWF model).
2.9″ rain forecast for the next 16 days (18z GFS model).
10.85″ rain so far in June in the Twin Cities.
11.67″ all-time June rainfall record (1874).
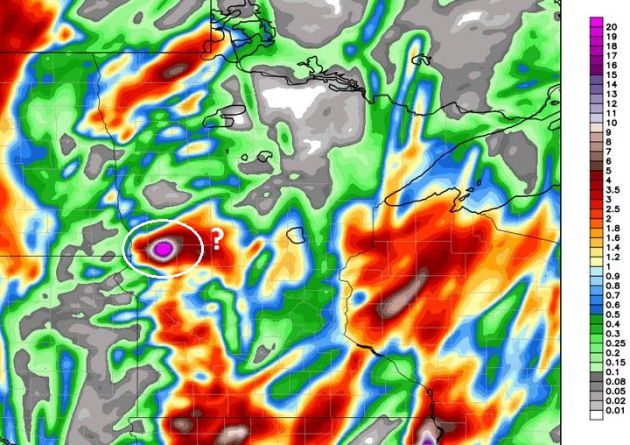
A Glitch in the Matrix? I sure hope Alexandria doesn’t pick up 17-20″ of rain. The odds of that actually verifying are slim to nil. But it shows you how moist the atmosphere will be; precipitable water amounts 2 to 3 times higher than average, resulting in a potential for more downpours. The 4 km WRF model shows thhe best chance of heavy 2-4″ rains by Saturday evening over west central and far southern Minnesota. Source: Weather Bell.
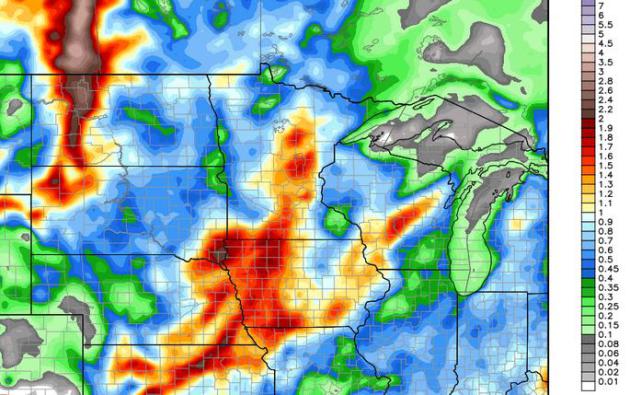
Rainfall Projections by Sunday Evening. NOAA’s 12 km NAM model shows some 1-2″ rainfall amounts in a wide swath from Walker and Brainerd into the Twin Cities and south central/southwestern Minnesota, which seems realistic by Sunday evening. Locally, some farms and gardens could pick up twice that amount.

Another Weekend – Another Sloppy Front. A very slow-moving cool frontal boundary limps across the Dakotas into Minnesota this weekend, sparking showers and heavy T-storms. I still believe Saturday will be the wetter day, overall. Expect more sun and warmer temperatures Sunday, when a few storms may turn severe. 84-hour Future Radar from NOAA.
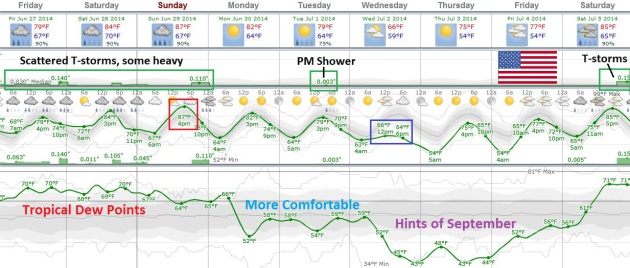
Big Swings in Moisture and Temperature. After a tropical weekend with T-storms and dew points near 70 a vigorous (for late June) cool front pushes cooler air out of Canada by the middle of next week. Some guidance keeps highs in the 60s to near 70F Wednesday before temperatures mellow into the mid and upper 70s on the 4th of July; 80s with more T-storms by Saturday, July 5. Graphic: Weatherspark.
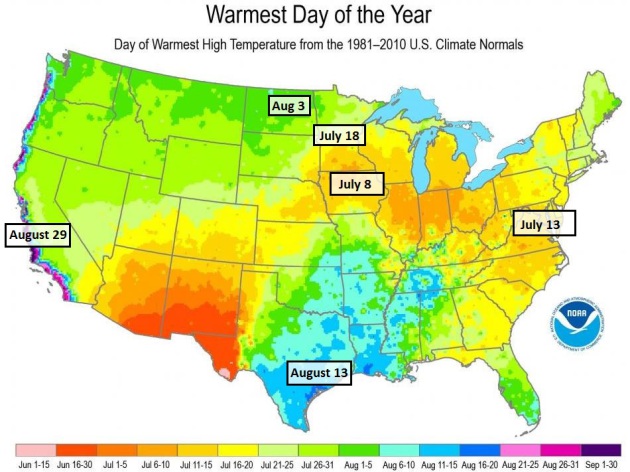
Historic Data: Warmest Day of the Year? Here’s an interesting graphic from NOAA NCDC, showing the statistical (mean) date of the warmest day of the year, ranging from August 3 in North Dakota and the Red River Valley to July 18 at St. Cloud, July 8 in the Twin Cities and much of southern Minnesota to August 13 at Houston and late August along the California coast.
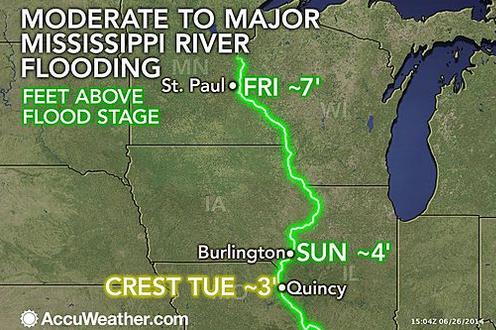
Mississippi River Flooding to Impact Communities, Port Operations. AccuWeather.com has a good summary of the muddy consequences of historic levels of rain in recent weeks across the Upper Midwest; here’s an excerpt: “High water will continue to impact communities and barge operations along the upper Mississippi River into early July as more rain moves into the area. Low-lying areas not protected by levees, such as farmland, homes, businesses and some roadways, are being inundated as river levels surpass flood stage. Excessive rainfall, in some cases near a foot over the past month, has pushed the upper Mississippi River past flood stage from Minnesota and Wisconsin to Iowa, Illinois and northern Missouri...”
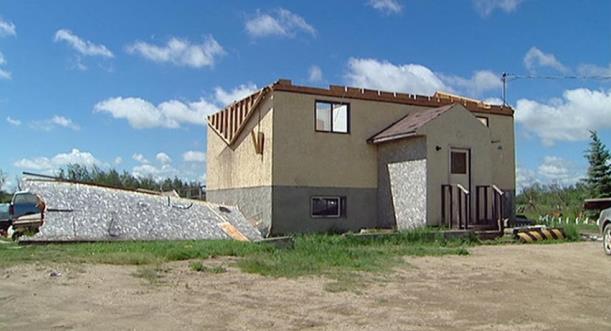
U.S. Tornado Warning System Far Surpasses Canada’s. CBC News in Saskatchewan has the article; here’s the introduction: “Environment Canada’s severe weather warning system is lagging far behind the American system in several ways, potentially putting lives at risk. That’s the conclusion of Saskatchewan storm chaser Greg Johnson, who has tracked tornadoes on both sides of the border for a decade. Johnson says that Environment Canada has “a communication problem where they don’t just readily share the information, it’s not available quickly.” “They don’t have a really good mechanism for getting that information that they do have out to the public.” Johnson said that compared with the United States, it’s as though Canada has no warning system at all…”
Photo credit above: “A roof was torn off a home on the Kawacatoose First Nation in Saskatchewan after a tornado struck in 2010.” (CBC)

School Buys Tornado Helmets. This story from AP and krmg.com made me do a double-take, but it makes perfect sense: a relatively low-cost, high-impact way to cut down on blunt force head trauma. Most tornado-related injury and death is related to flying debris; wearing a helmet, any helmet, can help to lower the risk. This school district is the third in Oklahoma to invest in helmets. Here’s an excerpt: “The Duncan Board of Education has approved the purchase of 4,500 skateboard helmets for students and employees to wear in case of a tornado. The board spent $34,650 on the helmets with funds raised by the Cover Our Kids campaign in Duncan. The campaign was created in response to the May 2013 tornado in Moore, which killed seven schoolchildren…”
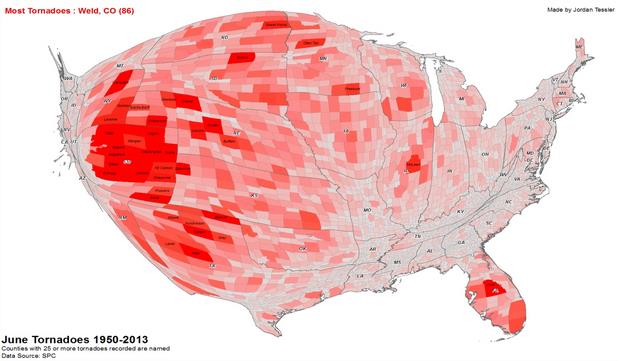
4 Maps Uncover Summer Tornado Hotspots. Colorado in June. Who knew? Here’s an excerpt from the Washington Post’s Capital Weather Gang: “…June is the most active of the summer months for tornadoes (intensity and frequency) and – more than the other summer months – geographically concentrated in the Plains, as shown in these cartograms of total tornado count by county by month. The counties are distorted based on their total tornado count in each month relative to a national average. Solid red counties have 25 or more tornadoes in the month shown…”
Map credit: Jordan Tessler.

USDA Forecasts Higher Fruit, Dairy Prices Due To Bad Weather, Disease. The Wall Street Journal has the story – here’s a clip: “U.S. consumers face higher prices for oranges and other fresh fruit because of adverse weather and widespread disease in Florida and California, federal forecasters said Wednesday. The Agriculture Department said fresh fruit prices will rise between 5% and 6% this year, a sharp increase over its estimate last month of 3.5% to 4.5%. The government also elevated its forecast for dairy prices after an especially chilly winter curbed milk output in the Midwest, and it warned that prolonged drought in California could have significant, lasting effects on fruit, vegetable, dairy and egg prices…”

Rumble in the Jungle: Does High Humidity Trigger More Hamstring Injuries? Here’s an excerpt of an interesting story at USA Today: “…Hamstring injuries occur when the quadriceps muscle that contracts to move the leg forward overpowers the hamstring. Athletes playing in higher-than-normal heat and humidity could be at greater risk to injury because those conditions cause greater fatigue, Casa said. “I believe that most of the 32 teams underutilize science to prevent injury and maximize performance when it comes to maximizing intense exercise in the heat,” he said…”
Photo credit above: “United States’ DaMarcus Beasley is taken off the field with an injury during the group G World Cup soccer match between the United States and Portugal at the Arena da Amazonia in Manaus, Brazil, Sunday, June 22, 2014.” (AP Photo/Marcio Jose Sanchez).
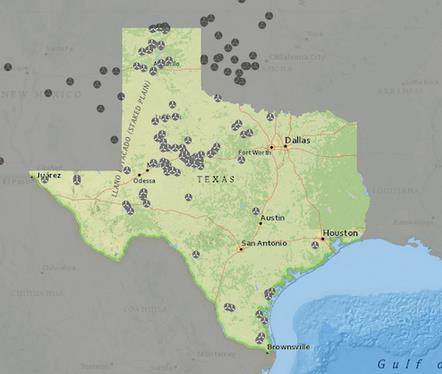
Texas Breaks Wind Power Production Record. Wind power providing 29% of the state’s energy needs at a single snapshot in time? This is impressive; here’s an excerpt from a story at Climate Central: “Texas, the nation’s largest wind power producer, hit a major milestone in March when it produced more wind power in a given moment than ever before, according to a new Energy Information Administration report. It may have set a national record for a state’s wind power production, too. The Lone Star State hit “peak wind” at 8:48 p.m. on March 26, when the state’s wind farms produced 10,296 megawatts of electricity. At that moment, wind turbines provided enough electricity to supply power for 29 percent of the total electricity load of the state’s main power grid…”
Map credit above: “Texas’ wind farms are concentrated mostly along the Gulf Coast in the Panhandle region, and in far West Texas.” Credit: EIA.

Tesla Model X On Track To Ship. Full disclosure: I am a (very happy) Tesla owner. My car insurance has come down by $600/year, and I have yet to see any significant increase in electricity rates, even though I plug my car in every night (in my garage) and have 200 miles of range the next day. But an all-wheel drive SUV? It seems better suited for Minnesota’s highways; snow-covered 5-6 months out of the year. And as prices continue to fall and as battery technology becomes cheaper and more efficient, I suspect more people will be driving without stopping at their favorite local gas station. My goal: put solar panels on the roof, a big battery in the garage, and drive for free, year-round. Free has a nice ring to it. Here’s an excerpt from The Los Angeles Times: “…Development of Tesla’s second model had suffered through some delays the company worked on the design of the vehicle’s distinct gullwing doors and other features. The Model X will give Tesla a much-needed second model while it develops a less expensive, smaller electric car that expects to help the automaker ramp up its sales to hundreds of thousands of vehicles annually, Irwin said. Tesla currently sells only the Model S, an electric sports sedan that starts at about $71,000 and climbs above $100,000 depending on options and features...”
Image credit: Tesla Motors, which has more information on the 2015 Tesla Model X here.

Google Launches Android Wear, Hoping For A Wearable Revolution. Just tell me when I can install the implants directly into my brain ok? Here’s a clip from Gizmag: “…Android Wear is the company’s software platform for linking smartwatches from companies including LG, Samsung and Motorola to Android phones and tablets. A preview of Wear was introduced this spring, but today Google provided more details on how it will work and made it clear that the company is investing heavily in the notion that wearables are the future, even as early smartwatches have failed to impress most consumers. Android Wear takes much of the functionality of Google Now and makes an attached smartwatch the home for receiving notifications and context-based information and suggestions that currently live within Now on Android devices…”

New York Is The Most Welcoming City In The World, And Paris Is The Least. Here’s a clip from an interesting story at Huffington Post: “…In a recent survey, money-saving site Coupon Codes Pro asked thousands of “global travelers” which cities they’ve found the most — and least — welcoming on their travels. The site provided globetrotters with a list of world cities and asked them to pick the “most welcoming” ones, as well as call out any places that had been particularly “unwelcoming” to them in the past (a highly scientific process, no?)…”

TODAY: Mostly cloudy and unsettled, few T-storms likely. Dew point: 68. Winds: SE 15. High: 82
FRIDAY NIGHT: More showers and T-storms, some heavy. Low: 70
SATURDAY: Sticky and windy with lot’s of clouds, numerous T-storms. Winds: S 15-25. High: 83
SUNDAY: Sunny start, severe PM T-storms? Wake-up: 71. High: 87
MONDAY: Partly sunny, cooler and drier. Wake-up: 67. High: 82
TUESDAY: Fresh Canadian air. AM sun – PM clouds. Wake-up: 64. High: 78
WEDNESDAY: Sun & clouds. Hints of September in the air. Dew point: 47. Wake-up: 59. High: 69
THURSDAY: Bright sun, less wind. Perfect. Wake-up: 51. High: 74
4th of July: Sun dimmed by high clouds, still comfortable. Winds: SW 5-15. High: 79
Climate Stories…

What Are They Teaching Your Kids About Global Warming? The National Journal takes a look at the fine line many high school science teachers are being forced to walk when discussing the science of climate change; here’s a clip: “…All this puts science teachers in an awkward position: Scientists insist that teaching the controversy—and not the consensus—is a dereliction of duty and a propagation of falsehood. But a powerful conservative coalition opposes any effort to standardize a consensus curriculum, and they’ve had success in blocking such a standard from taking effect. The end result: a patchwork of climate instruction guidelines that largely leaves teachers to their own devices, facilitating massive disparities in global-warming education from school to school and state to state. “There’s a lot of variability in how this is taught right now,” said Minda Berbeco, the National Center for Science Education’s programs and policy director. “What’s really troubling is a lot of students are not receiving accurate scientific information…”
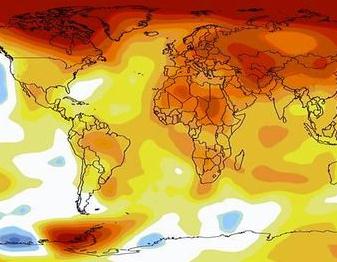
Rising Temperatures Drive People To Relocate. Here’s a snippet of an interesting article at Scientific American: “…A new study published this week in the Proceedings of the National Academy of Sciences follows more than 7,000 households in Indonesia over 15 years to conclude that sudden disasters in fact have a much smaller impact on provincial migration than heat stress. Rainfall, it finds, also affects decisions to move, but far less so than rising temperatures. “We can now say something intelligent about the conditions under which people move,” said Michael Oppenheimer, a professor of geosciences and international affairs at Princeton University and a co-author of the study…”
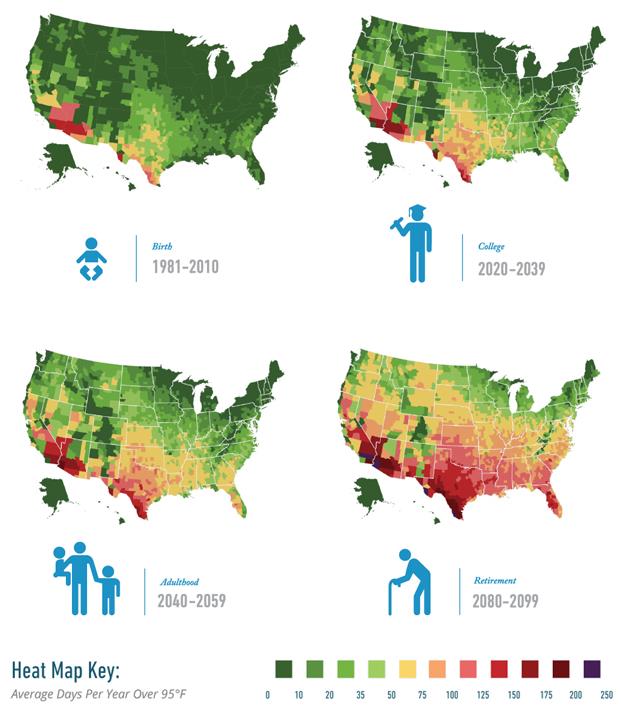
These Maps Show How Many Brutally Hot Days You Will Suffer When You’re Old. But what if you’re already old? Make sure the retirement home has a good cooling system, preferably powered by renewables, just in case the grid goes down. Here’s an excerpt from Climate Desk: “…If you’re aged 4-33 right now, the map above shows you how many very hot days—those with temperatures over 95 degrees Fahrenheit—you’re likely to experience by the time you’re elderly. It comes from a new report by the economics research firm Rhodium Group, which was commissioned by former NYC Mayor Michael Bloomberg; Henry Paulson, the Republican Treasury Secretary under George W. Bush; and Tom Steyer, the billionaire Bay Area entrepreneur and environmentalist. The report’s primary focus is the economic impact climate change will have on the US, and the dollar figures are just as extreme as the temperature data: up to $507 billion worth of property below sea level by 2100, and up to $108 billion per year in property damage from hurricanes…” (Image credit: Risky Business).

Global Warming To Disrupt Economy By Mid-Century, Report Finds. The Christian Science Monitor has a story and video recap of this week’s “Risky Business” report focused on economy/business impacts of climate volatility; here’s an excerpt: “If global warming continues unchecked, it is likely to cost the US economy hundreds of billions of dollars in lost productivity, inundated housing and infrastructure along coasts, and plunging crop yields in key farming regions by mid-century. Those are among the conclusions of a report, notable for its bipartisan representation, released Tuesday on the economic risks the US faces from climate change. Participants include business leaders, current and former investment executives, and former US Cabinet secretaries…”
