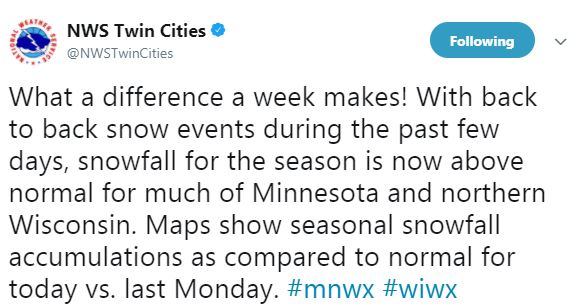
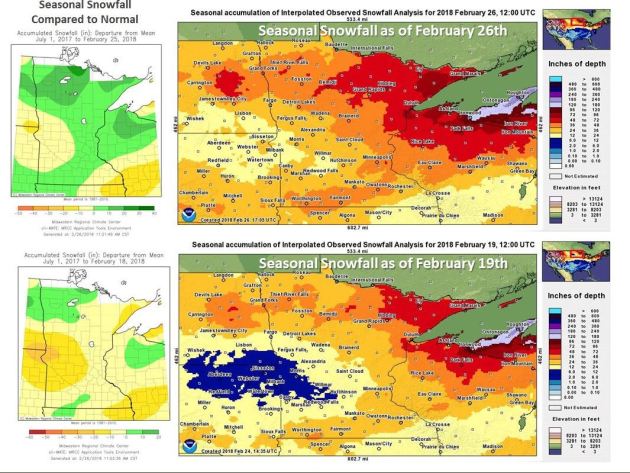
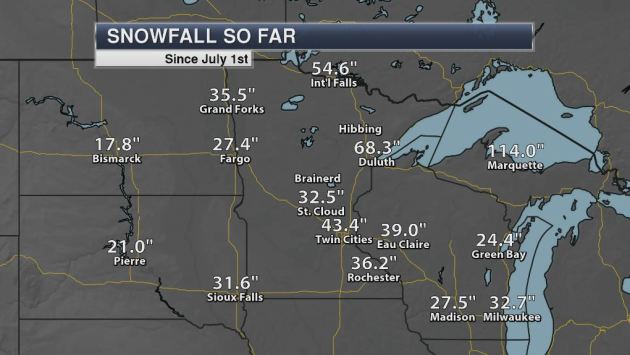
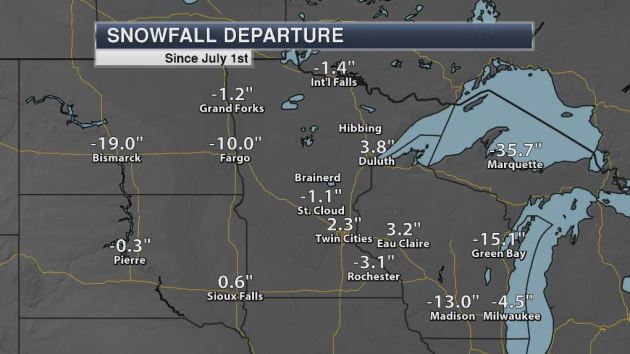
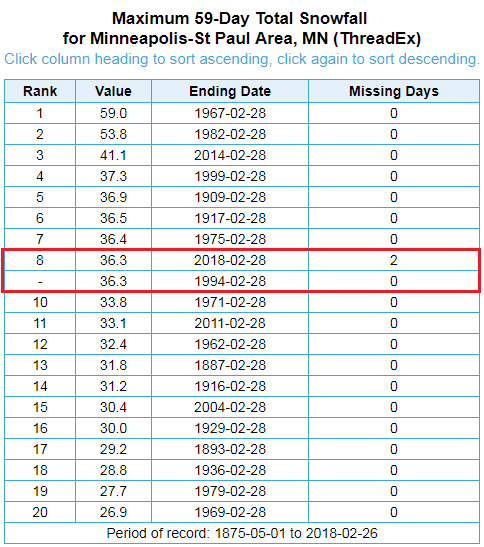
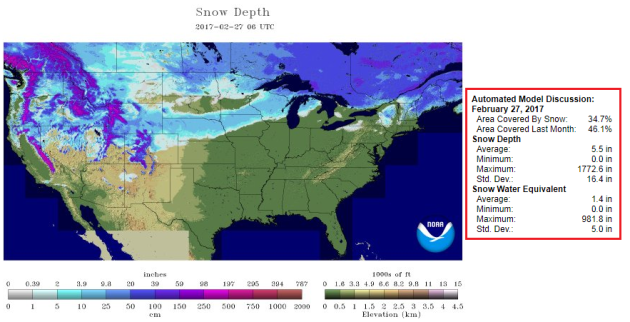
Seasonal Snowfall
_________________________________________________________________________
____________________________________________________________________________
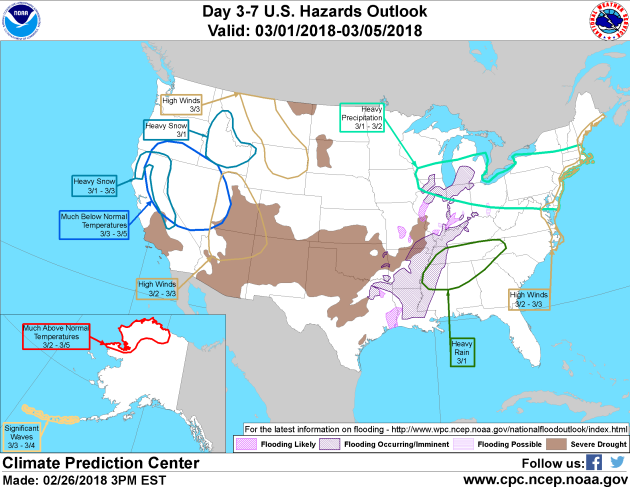
1.) Heavy rain across portions of the Lower Mississippi Valley, the Southern Appalachians, and the Tennessee Valley, Thu, Mar 1.
2.) Heavy precipitation across portions of the Northeast, the Central Appalachians, the Middle Mississippi Valley, the Mid-Atlantic, the Upper Mississippi Valley, the Great Lakes, and the Ohio Valley, Thu-Fri, Mar 1-Mar 2.
3.) High winds across coastal parts of the Northeast and Mid-Atlantic, Fri-Sat, Mar 2-Mar 3.
4.) Heavy snow across portions of northern California, Sierras, and Cascades, Thu-Sat, Mar 1-Mar 3.
5.) Heavy snow across portions of the Northern Rockies and the Northern Great Basin, Thu, Mar 1.
6.) High winds across portions of the Central Plains, Northern Plains, and Northern Rockies, Sat, Mar 3.
7.) High winds across portions of the Central Great Basin, the Southwest, and Central and Southern Rockies, Fri-Sat, Mar 2-Mar 3.
8.) Much below normal temperatures across portions of California, the Central Great Basin, the Pacific Northwest, the Northern Great Basin, and the Southwest, Sat-Mon, Mar 3-Mar 5.
9.) Flooding possible across portions of the Ohio Valley.
10.) Flooding occurring or imminent across portions of the Lower Mississippi Valley, the Tennessee Valley, the Great Lakes, the Middle Mississippi Valley, the Upper Mississippi Valley, the Southern Plains, and the Ohio Valley.
11.) Flooding likely across portions of the Middle Mississippi Valley, the Lower Mississippi Valley, the Southern Plains, and the Ohio Valley.
12.) High significant wave heights for coastal portions of the Aleutians, Sat-Sun, Mar 3-Mar 4.
13.) Much above normal temps across portions of the North Slope of Alaska, Fri-Mon, Mar 2-Mar 5.
14.) Slight risk of much below normal temperatures for portions of the northwestern quarter of the CONUS, Tue-Thu, Mar 6-Mar 8.
15.) Moderate risk of much below normal temperatures for portions of the Northern Plains and the Northern Rockies, Tue-Thu, Mar 6-Mar 8.
16.) Slight risk of much below normal temperatures for parts of mainland Alaska, Tue-Thu, Mar 6-Mar 8.
17.) Slight risk of heavy precipitation for portions of the Central Great Basin, and California, Thu-Sat, Mar 8-Mar 10.
18.) Severe Drought across the Central Plains, the Central Rockies, the Lower Mississippi Valley, the Central Great Basin, the Northern Plains, the Southern Rockies, the Middle Mississippi Valley, California, the Southern Plains, and the Southwest.
___________________________________________________________________________
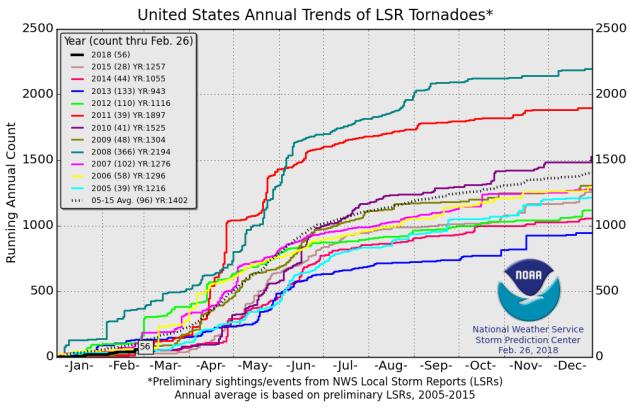
2018 Tornadoes So Far…
According to NOAA’s SPC, there have been 56 preliminary tornaoes so far this year (February 26th), which is more than what we had at this time in the last couple of years. Interestingly, there were 366 tornadoes at this time in 2008; that year ended with 2,194 tornadoes, which is nearly 800 more than the short-term 2005-2015 average.
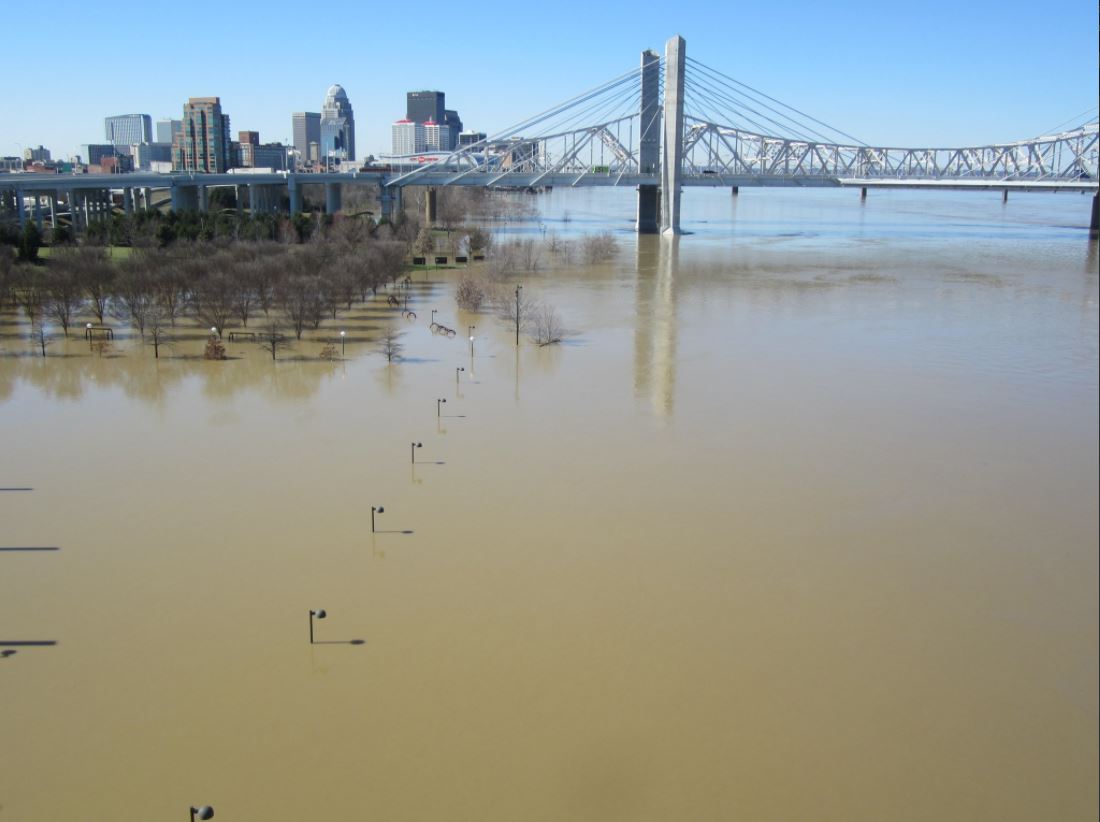
______________________________________________________________________________Major River Flooding
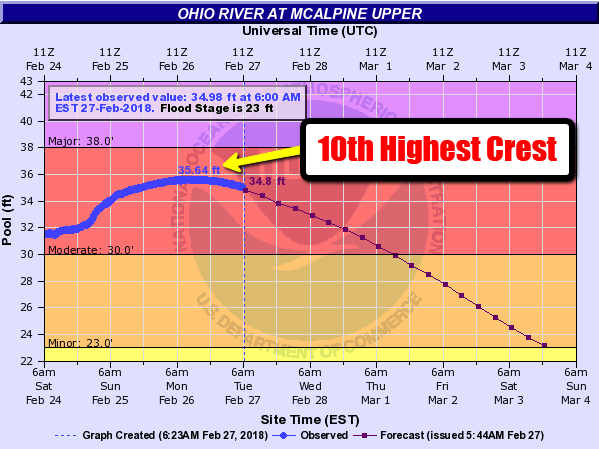
There has been some major river flooding ongoing across the Ohio Valley thanks to extreme rainfall over the past 5 to 7 days. Thanks to @NWSLouisville for the flooding picture out of Louisville, KY, where the Ohio River reached moderate flood stage last week and may not fall below that mark until this Friday! Interestingly, the Ohio River in Louisville (McAlpine Upper reached a crest of 35.64ft, on Monday afternoon, which is the 10th highest crest this river gauge has ever reached!
Major River Flooding
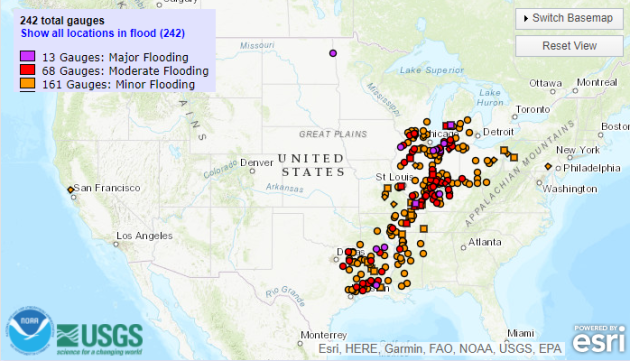
According to NOAA, there were 242 river gauges in flood stage as of Tuesday morning, 13 of which where at Major flood statge!
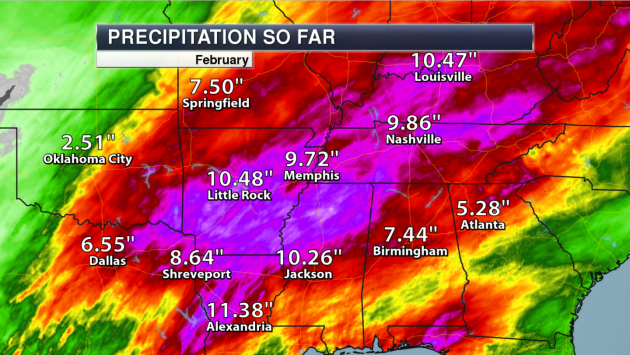
February Rainfall
WOW! How about those numbers! A corridor of heavy precipitation this month helped push February precipitation numbers into Double digits for a number of locations! In fact, there was so much precipitation that Louisville, KY and Evansville, IN have seen their wettest February on record!!
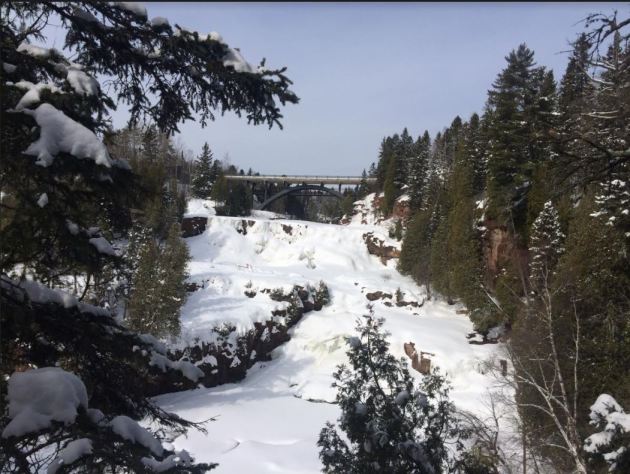
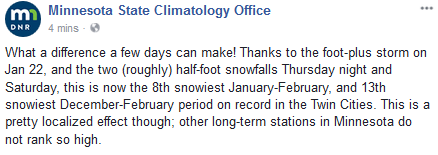
_____________________________________________________________________________“Minnesota Sees Deadliest Winter In Years”