Painting of IRMA During IRMA
WOW – this is too neat not to share. A woman who stayed up all night during IRMA painted this and it has been making the rounds on the internet! Great job Gina !!
Here’s what she had to say about the painting: Was up pretty much all last night during the storm watching over the horseys, so I did a candlelight watercolor painting of Mizz Irma ☺️ ? ⛈ ?

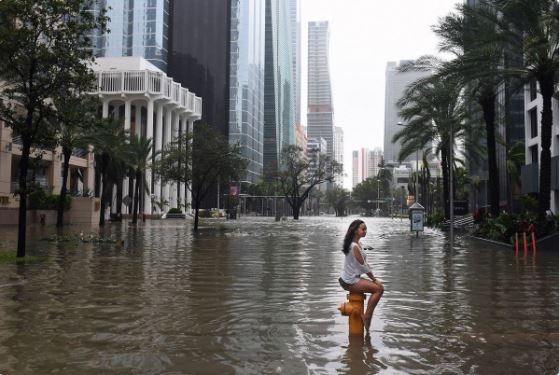
“Why Hurricane Irma wasn’t far worse, and how close it came to catastrophe”
Hurricane Irma has wrought havoc all over Florida and is no slouch of a storm. But, while extremely costly, it may not rank among the state’s worst-ever hurricane disasters, as had been feared. Leading up to its back-to-back landfalls in the Florida Keys and on Marco Island, several twists of fortune eased the pain the storm inflicted on the state. And only slight deviations would have made the storm’s outcome much more severe. The first stroke of good luck for Florida occurred when the center of a Category 5 Irma scraped along Cuba’s north coast. This, of course, turned into Cuba’s misfortune. But Irma’s interaction with land weakened the storm from a potentially catastrophic Category 5 to a Category 3. “When Irma approached the Florida peninsula, there was no “good” course for it to follow. Devastation was guaranteed from a storm so big and so strong (attested to by the 6 million-plus power outages), but the track it ultimately pursued was better than some alternatives. The dangerous right-front quadrant with the worst winds and biggest surge targeted the stretch from Everglades City to Marco Island, a less populated zone than many others. If the right-front quadrant had instead targeted Miami, for example, the storm surge disaster would have been unimaginably bad. “The storm surge flooding in Miami [on Sunday] is a mere fraction of what would have happened if the core of #Irma had been farther east,” tweeted Rick Knabb, a hurricane expert at the Weather Channel and former director of the National Hurricane Center.”
See more from The WashingtonPost HERE:
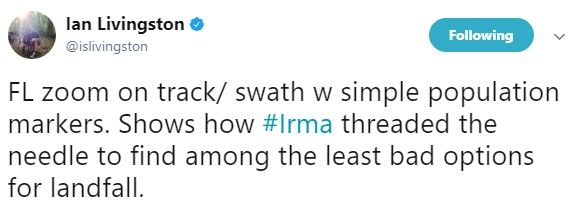
IRMA Threaded The Needle
Take a look at this Tweet from @islivingstion, which shows the path of IRMA and where the hurricane/tropical storm force winds were located in relation to heavily populated areas. Note that while there where hurricane force winds across a wide area in Florida, the worst on the eastern/northeastern side of the storm fell across “Everglades City to Marco Island, which is a less populated zone than many others.”
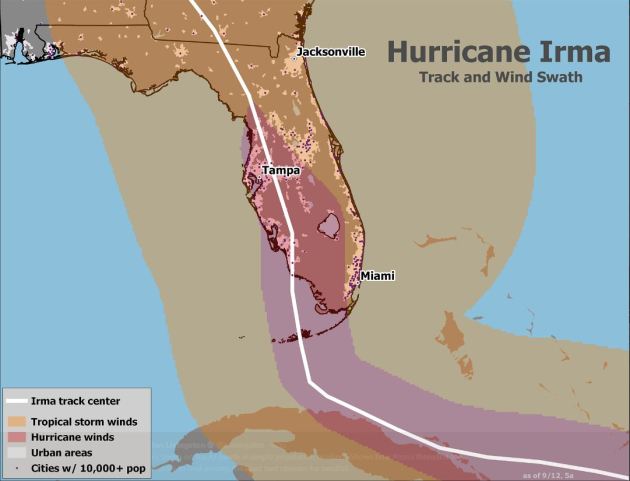 __________________________________________________________
“Irma’s track forecast was adequate, but there’s significant room for improvement”
“Hurricane forecasting is unique. In other storms — severe weather, blizzards, nor’easters — anyone can make their own maps or create their own forecast. But during a hurricane, everyone relies on one organization to be the authority in the Atlantic Ocean: the National Hurricane Center. If there’s an active storm, the Hurricane Center issues updates every three or six hours, depending on whether the storm is threatening land. Given the stakes, the adjustments tend to be slow and methodical. The “cone of uncertainty” is there to show you where the track could eventually wind up — it’s actually just the historical error bounds on NHC forecasts. While a majority of storms stay in the cone, some do not. And of course, impacts often stretch well beyond the cone, especially close in, where the cone is tiny. Before U.S. landfall, NHC issued 45 main forecasts for Irma, plus a bunch of intermediate ones. Their first was way back on Aug. 30, when Irma was just off the coast of Africa. By most metrics, the forecast was a good one. The idea of a major hurricane was there, the track fell within all the cones.”
See more from WashingtonPost HERE:
(Irma forecast points at one, two, three and four days out compared with the actual. (Ian Livingston/The Washington Post))
________________________________________________________
IRMA Deforested Islands in the Caribbean
WOW! Take a look at some of the NOAA satellite images from before and after Hurricane IRMA went through the Caribbean. Note how green the islands are from trees and plants before and how they’ve turned brown from being nearly devegetated!!
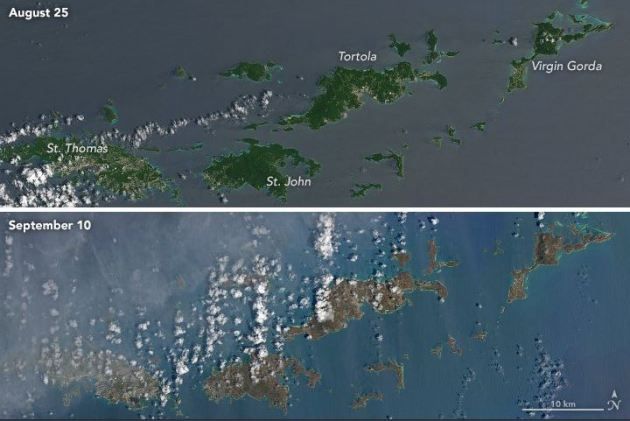
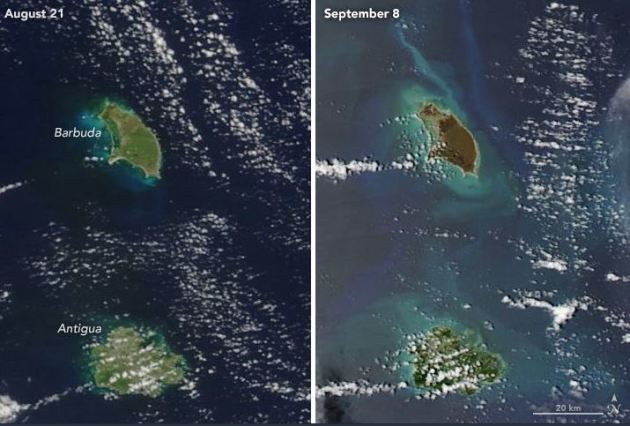
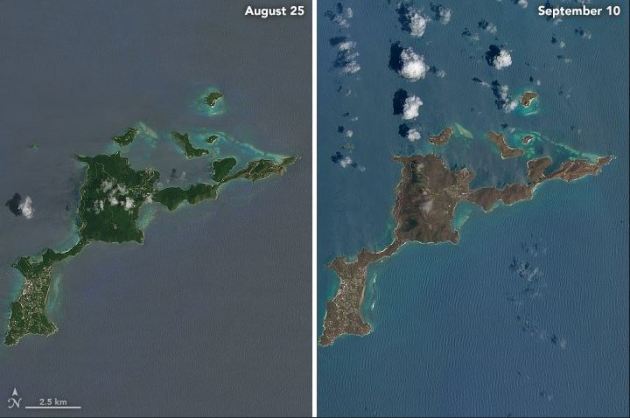
See more from NYTimes.com HERE:
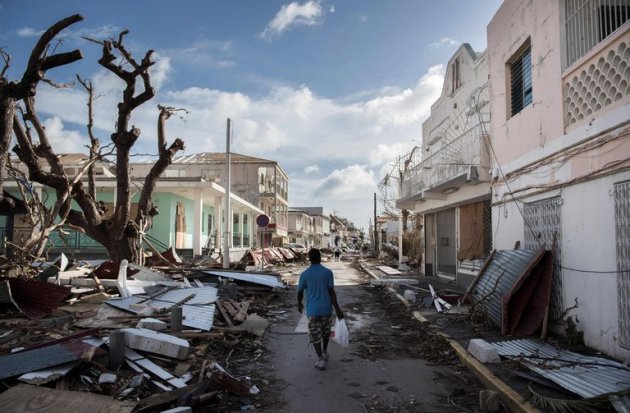
(A street in St. Martin after Hurricane Irma. Residents spoke of a disintegration in law and order as survivors struggled in the face of severe food and water shortages. CreditMartin Bureau/Agence France-Presse — Getty Images via NYTimes.com)
__________________________________________________________
________________________________________________________________
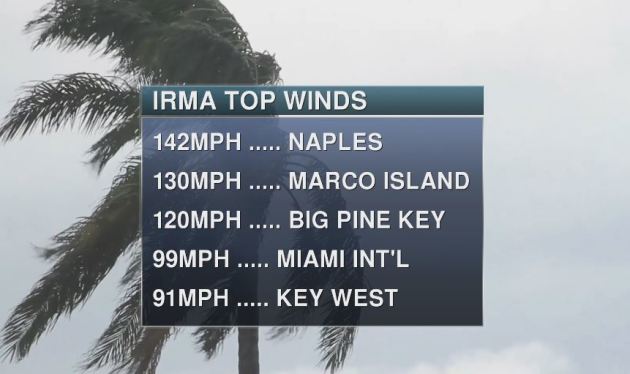
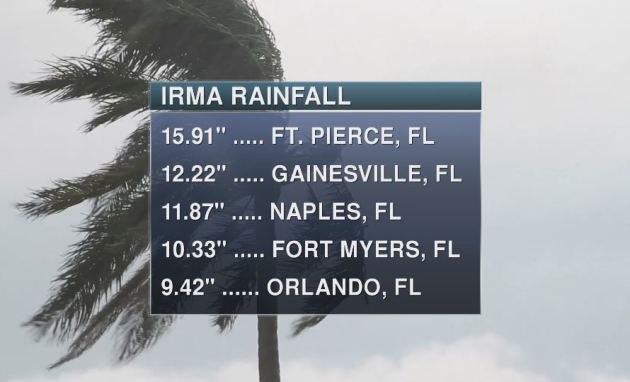
Impressive IRMA Stats
Thanks to Philip Klotzbach who is a meteorologist at CSU specializing in Atlantic basin seasonal hurricane forecasts for putting together these records from Hurricane IRMA… WOW – there certainly are a lot of them! Take a look: Hurricane Irma Meteorological Records/Notable Facts Recap Intensity/Day Measures
– 185 mph lifetime max winds – tied with Florida Keys (1935), Gilbert (1988) and Wilma (2005) for second strongest max winds of all time in Atlantic hurricane. Allen had max winds of 190 mph in 1980
– 185 mph lifetime max winds – the strongest storm to exist in the Atlantic Ocean outside of the Caribbean and Gulf of Mexico on record
– 185 mph max winds for 37 hours – the longest any cyclone around the globe has maintained that intensity on record. The previous record was Haiyan in the NW Pacific at 24 hours
– 914 mb lifetime minimum central pressure – lowest since Dean (2007) and 10th lowest in satellite era (since 1966)
– 914 mb lifetime minimum central pressure – lowest pressure by an Atlantic hurricane outside of the western Caribbean and Gulf of Mexico on record
– First Category 5 hurricane in the Atlantic since Matthew (2016) and first Category 5 hurricane in the tropical Atlantic (7.5-20°N, 60-20°W) since Hugo (1989)
– 3.25 day lifetime as a Category 5 hurricane – tied with Cuba (1932) for longest lifetime as Category 5
– 3 consecutive days as a Category 5 hurricane – the longest in the satellite era (since 1966)
– 12.75 named storm days – the most since Nicole (2016) and tied for 23rd most in satellite era
– 11.25 hurricane days – the most since Ivan (2004) and tied for 9th most in satellite era (since 1966) – satellite-era record is Ginger (1971) with a whopping 19.5 hurricane days
– 8.50 major hurricane days – the 2 nd most in satellite era (since 1966) – trailing Ivan (2004).
– 3.75 major hurricane days in the tropical Atlantic (7.5-20°N, 60-20°W) – trailing only Luis (1995) for major hurricane days in the tropical Atlantic
ACE Measures
– Generated the most Accumulated Cyclone Energy by a tropical cyclone on record in the tropical Atlantic (7.5-20°N, 60-20°W)
– Generated more Accumulated Cyclone Energy than the first eight named storms of the Atlantic hurricane season (Arlene-Harvey) combined
– Generated the most Accumulated Cyclone Energy in a 24-hour period on record, breaking old record set by Allen (1980)
– 67.5 Accumulated Cyclone Energy – the 2nd most by an Atlantic hurricane in satellite era (since 1966) – trailing only Ivan (70.4)
– Generated enough Accumulated Cyclone Energy to satisfy NOAA ACE definition for an average Atlantic hurricane season
– Generated more Accumulated Cyclone Energy than 18 entire Atlantic hurricane seasons in the satellite era (since 1966)
Landfall Records
– Leeward Islands: Strongest storm on record to impact the Leeward Islands defined as 15-19°N, 65-60°W for this calculation, with max winds of 185 mph. Okeechobee Hurricane (1928) and David (1979) were previous strongest at 160 mph
– Turks and Caicos: Closest approach of a Category 5 hurricane on record
– The Bahamas: First Category 5 hurricane to make landfall since Andrew (1992)
– Cuba: 160 mph, 924 mb – Category 5 – First Category 5 hurricane to make landfall since the Cuba Hurricane of 1924
– Continental United States: 1 st Landfall (Cudjoe Key, FL): 130 mph, 929 mb – Category 4
– First Category 4 hurricane to make landfall in Florida since Charley (2004) and major hurricane to make landfall in Florida since Wilma (2005)
– 929 mb pressure is tied for 7th lowest on record for U.S. landfall with Lake Okeechobee Hurricane of 1928 2 nd Landfall (Marco Island, FL): 115 mph, 940 mb – Category 3
– Exact same latitude/longitude as well as same Saffir/Simpson Category at landfall as Wilma (2005): 25.9°N, 81.7°W
______________________________________________________________
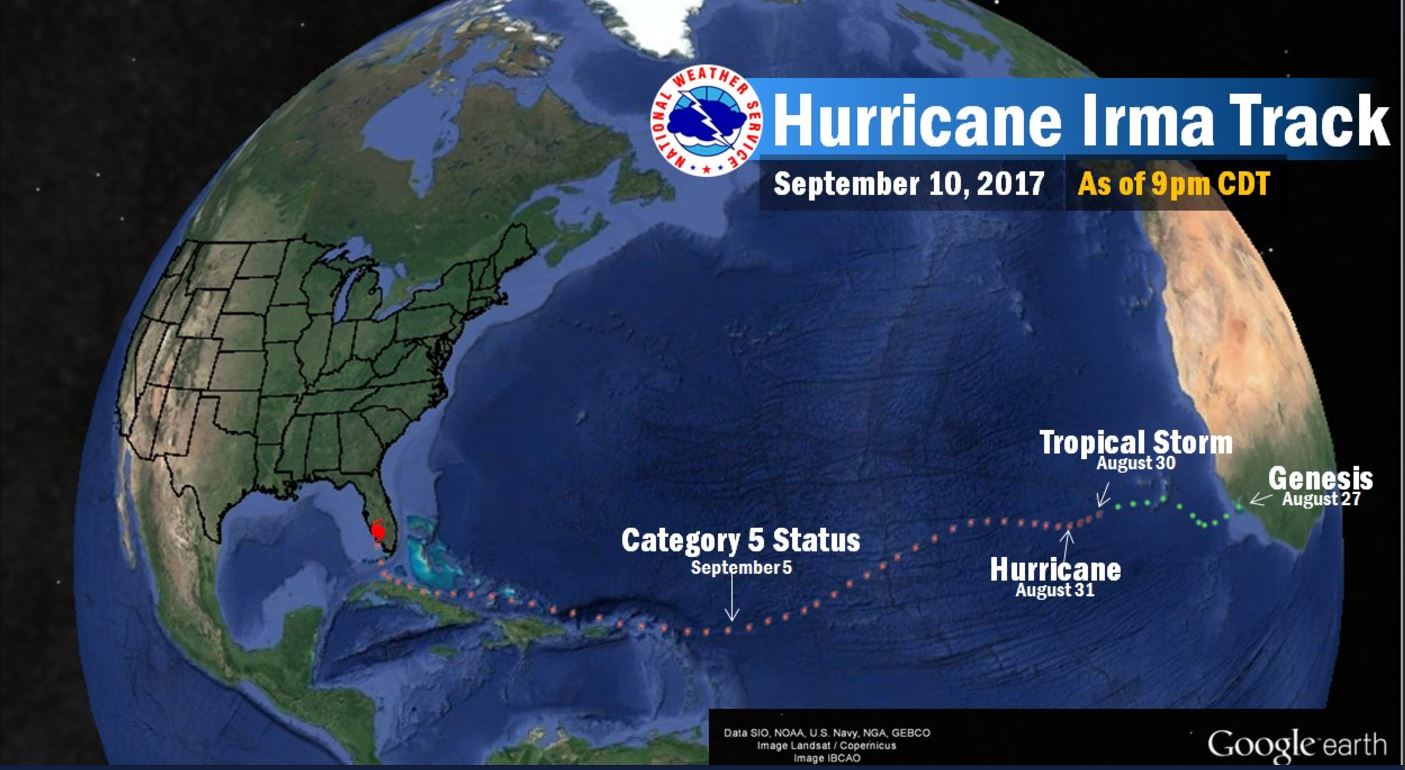
IRMA’s Track
Irma was an interesting storm as it started as a wave of energy off the west coast of Africa that quickly became a tropical storm just a few days later. 6 days after turning into a tropical storm, it was a category 5 hurricane! It then moved through the Caribbean and eventually made landfall with southern Florida on September 10th.
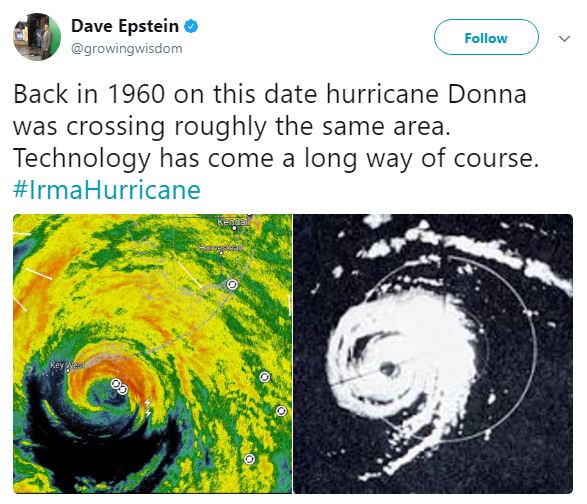
DONNA & IRMA
WOW! How about this… IRMA made landfall in the Lower Florida Keys on September 10th, which is officially the peak of Atlantic Hurricane Season. Interestingly, Hurricane Donna made landfall in the Keys on the same day back in 1960!
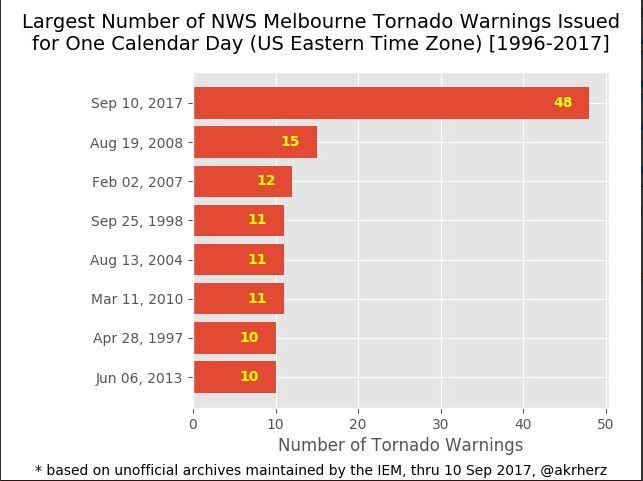
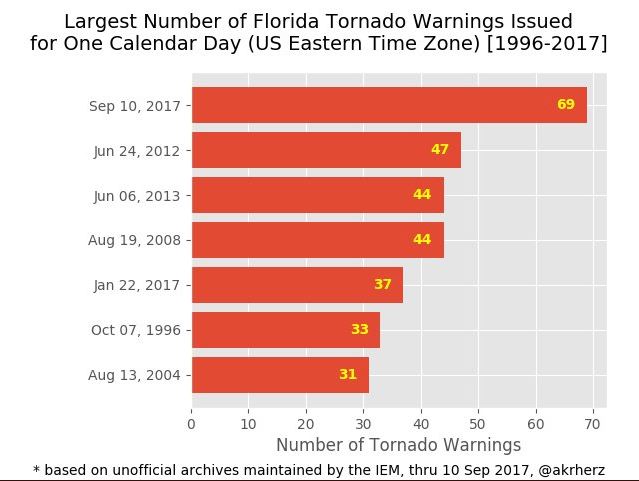
Record Amount of Tornado Warnings
According to the National Weather Service out of Melbourne, FL, there were 48 tornado warnings issued for their DMA on Sunday, September 10th, which is the greatest amount of tornado warnings issued by their office for any single day. The next greatest was 15 back on August 19th, 2008. Also, the state of Florida had a record number of tornado warnings at 69 on Sunday, September 10th beating the previous of 47, which was set on June 24, 2012
IRMA Made Landfall As A Major Category 4 Storm
This was the radar loop from early Sunday morning as Hurricane Irma officially made landfall along the Florida Keys. After briefly dropping down to category 3 strength during the day Saturday, IRMA intensified to a category 4 storm with sustained winds of 130mph (pressure at 929mb) just before making landfall in Cudjoe Key in the Lower Florida Keys at 9:10am Sunday morning. Interestingly, NEVER on record has there been (2) Category 4 hurricanes to make U.S. landfall in one Atlantic hurricane season until now! Hurricane Irma in the Florida Keys on Sunday, September 10th and Hurricane Harvey on Friday, August 25th. At 3:35pm, there was a second landfall near Marco Island, FL as a category 3 storm with winds of 115mph (pressure at 940mb).
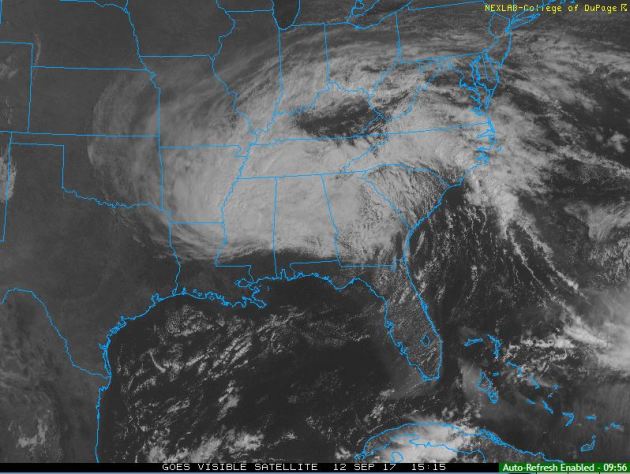
Satellite Loops of IRMA
.gif)
.gif)
________________________________________________________
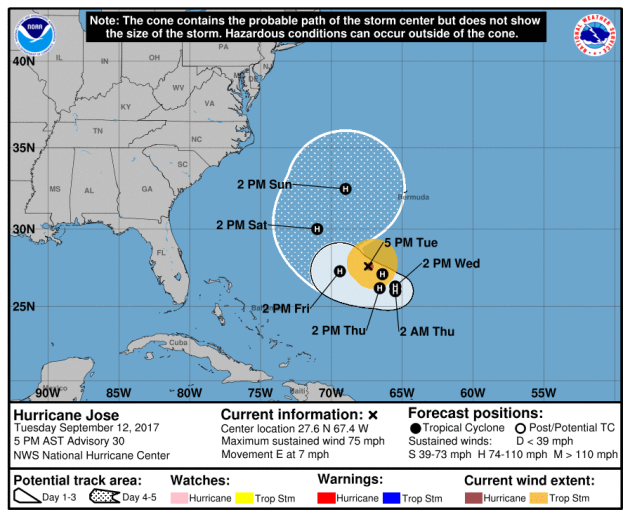
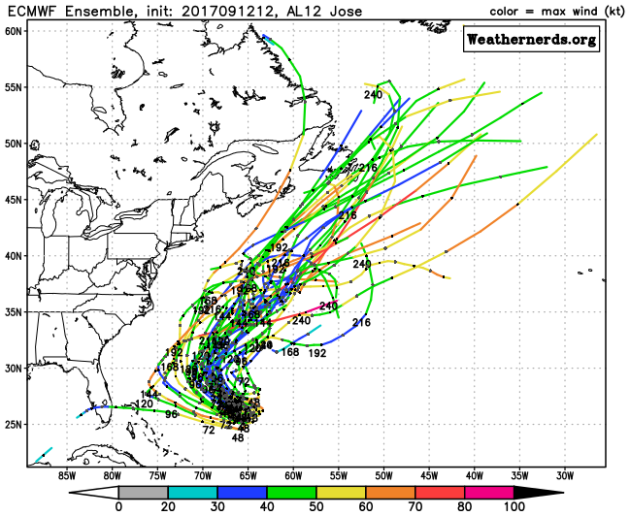
Still Tracking JOSE in the Atlantic
Tracking JOSE
____________________________________________________________
.png)
__________________________________________________________
___________________________________________________________
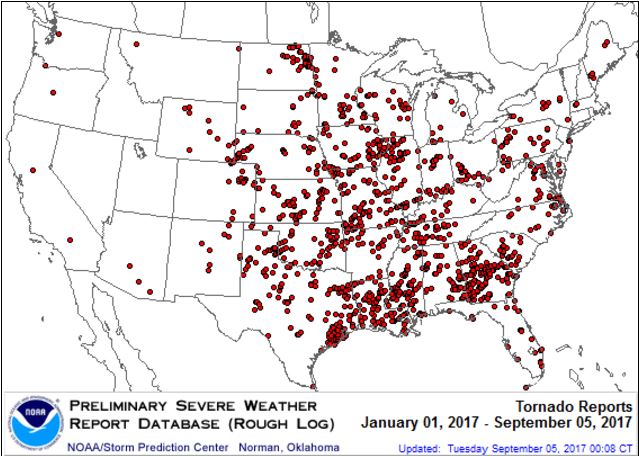
It certainly has been a fairly active first half of 2017 with 1344 preliminary tornado reports through September 9th. Note that this is the most tornadoes through September 9th since 2011, when there were 1,782 reports. The map below shows the distribution of the tornadoes so far this year.
PRELIMINARY 2017 Tornado Count
According to NOAA’s SPC, the PRELIMINARY 2017 tornado count is 1344 (through September 11th). Note that is the most active year for tornadoes since 2011, when there were 1,782 tornadoes. Keep in mind there was a major tornado outbreak in the Gulf Coast region from April 25-28, 2011 that spawned nearly 500 tornadoes, some of which were deadly. That outbreak is known as the Super Outbreak of 2011 and has gone down in history as one of the biggest, costliest and one of the deadliest tornado outbreaks in history.
.png)
_____________________________________________________________________
National Weather Hazards Ahead…
1.) Heavy snow for the higher elevations of western Wyoming, Fri-Sat, Sep 15-16.
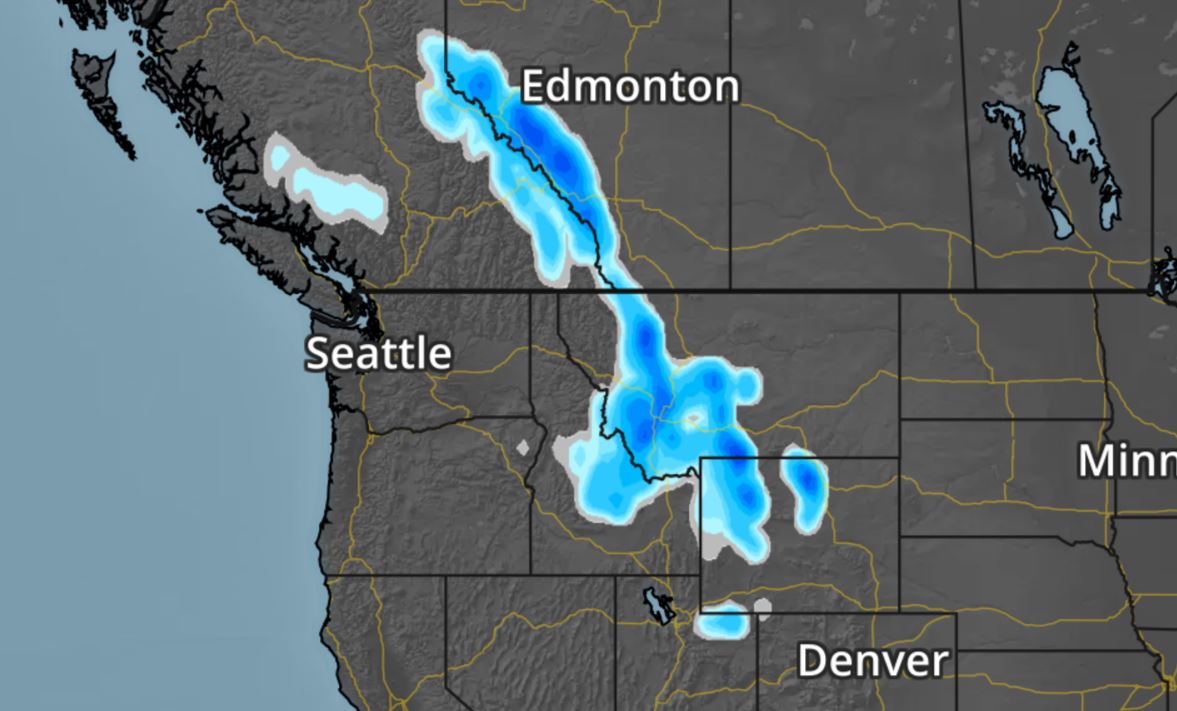
2.) Heavy rain for parts of the northern Great Plains and Minnesota, Fri, Sep 15.
3.) Severe weather for parts of the northern and central Great Plains, Fri, Sep 15.
4.) Much below-normal temperatures for the northern Rockies and northern high Plains, Fri-Sun, Sep 15-17.
5.) High winds for parts of the Aleutians and the Alaska Peninsula, Fri-Sun, Sep 15-17.
6.) Significant waves shifting north from the Carolinas to New England, Sat-Tue, Sep 16-19.
7.) Flooding occurring of imminent across parts of Florida, Fri-Tue, Sep 15-19.
8.) Flooding possible across parts of Alabama and Georgia, Fri-Tue, Sep 15-19.
9.) Flooding possible across parts of the Florida Peninsula, Wed-Thu, Sep 20-21.
10.) A slight risk of much below-normal temperatures for parts of the western U.S., Wed-Tue, Sep 20-26.
11.) Severe drought across the Middle Mississippi Valley, the Northern Plains, the Northern Rockies, and Hawaii.
.png)
_________________________________________________________
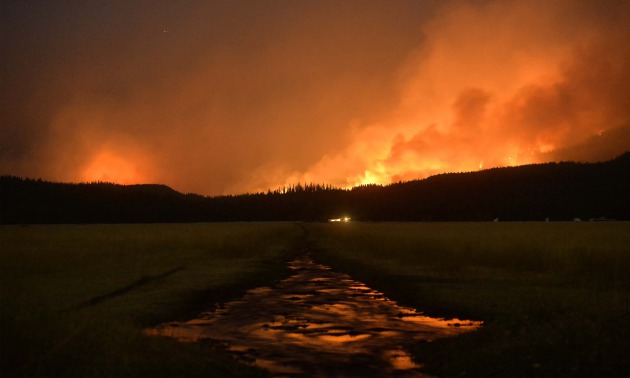
“The unprecedented drought that’s crippling Montana and North Dakota”
It came without warning, and without equivalent. Now a flash drought is fueling fires and hurting the lives of those who work the land. When Rick Kirn planted his 1,000 acres of spring wheat in May, there were no signs of a weather calamity on the horizon. Three months later, when he should have been harvesting and getting ready to sell his wheat, Kirn was staring out across vast cracked, gray, empty fields dotted with weeds and little patches of stunted wheat. “It’s a total loss for me,” said Kirn, who operates a small family wheat farm on the Fort Peck Reservation, an area of north-eastern Montana that lies right in the heart of the extreme climatic episode. “There’s nothing to harvest.”Kirn’s story is typical across the high plains in Montana and the Dakotas this summer, where one of the country’s most important wheat growing regions is in the grips of a crippling drought that came on with hardly any warning and, experts say, is without precedent.”
See more from the Guardian HERE:
(A wildfire burns in the Lolo national forest in Montana in August. The severe drought has served as ideal conditions for continued fires. Photograph: Rion Sanders/AP via The Guardian)
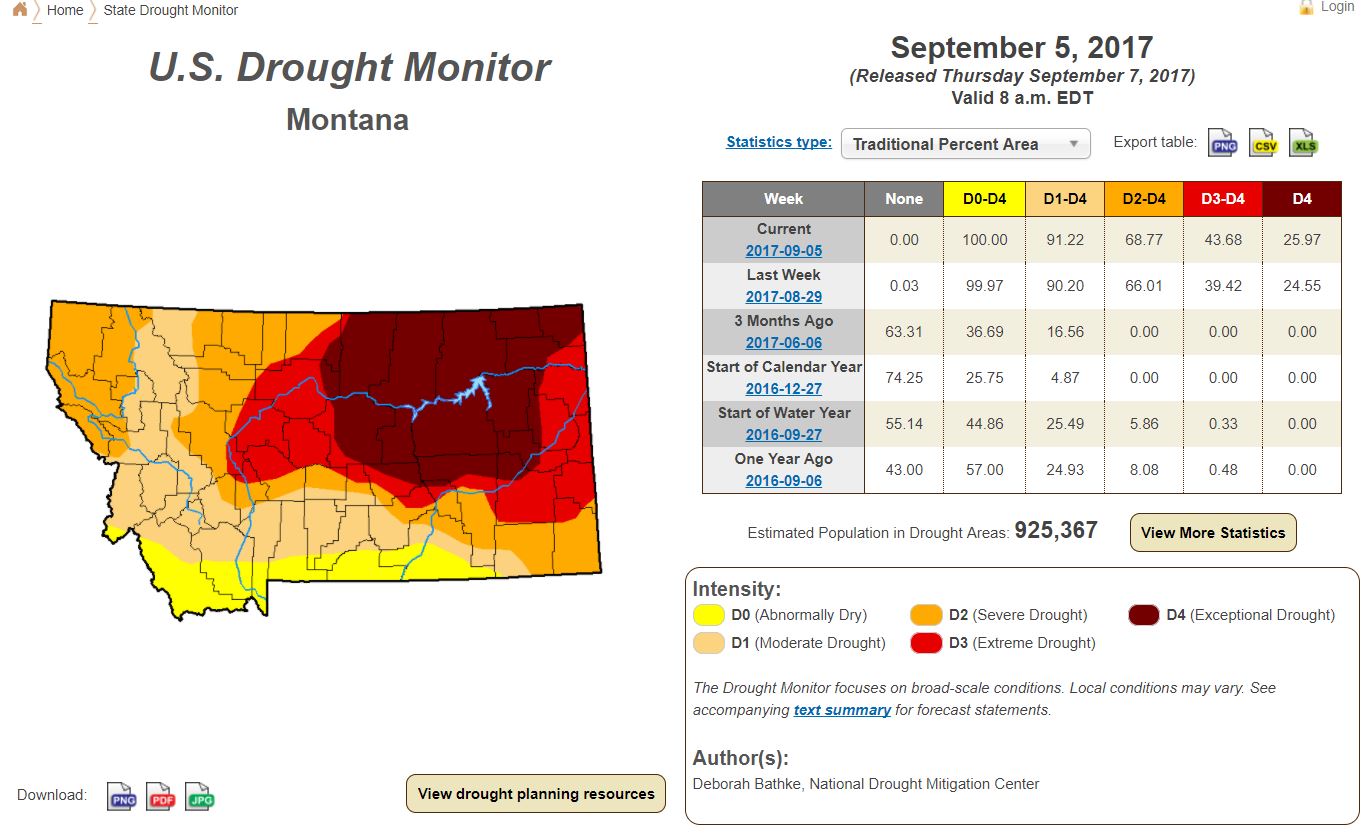
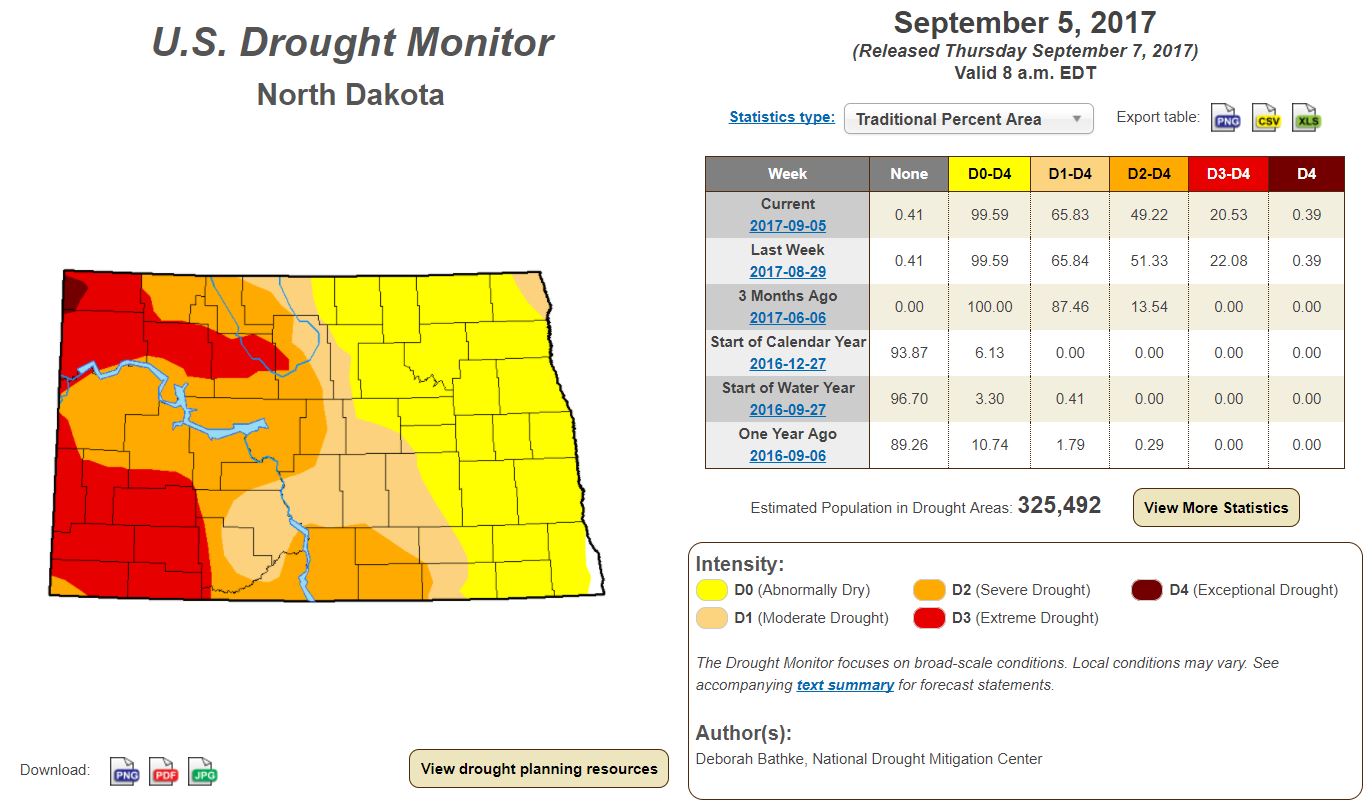
Latest Drought Monitor
Here’s the latest drought update from the US Drought Monitor, which shows EXCEPTIONAL drought conditions, which now covers nearly 26% of Montana. Note that 91% of the state is in a MODERATE drought. In North Dakota, more than 25% of the state is considered to be in an EXTREME drought.
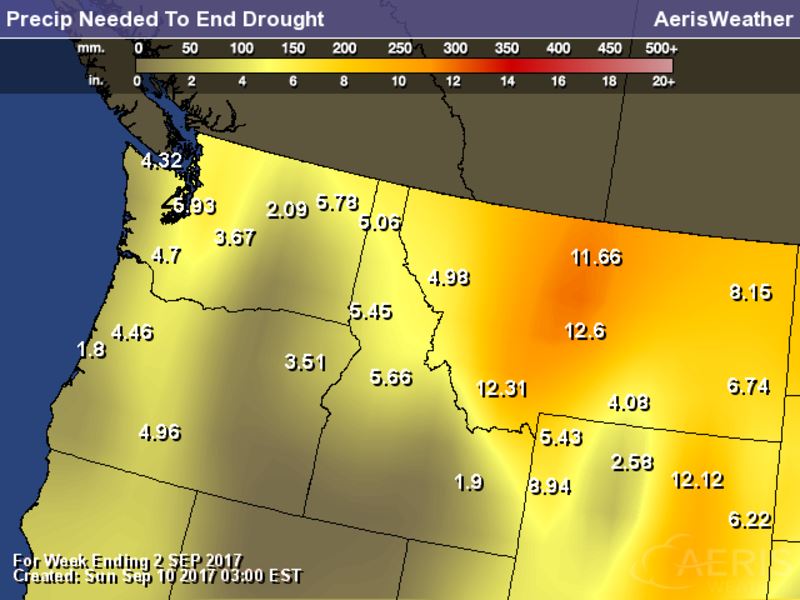
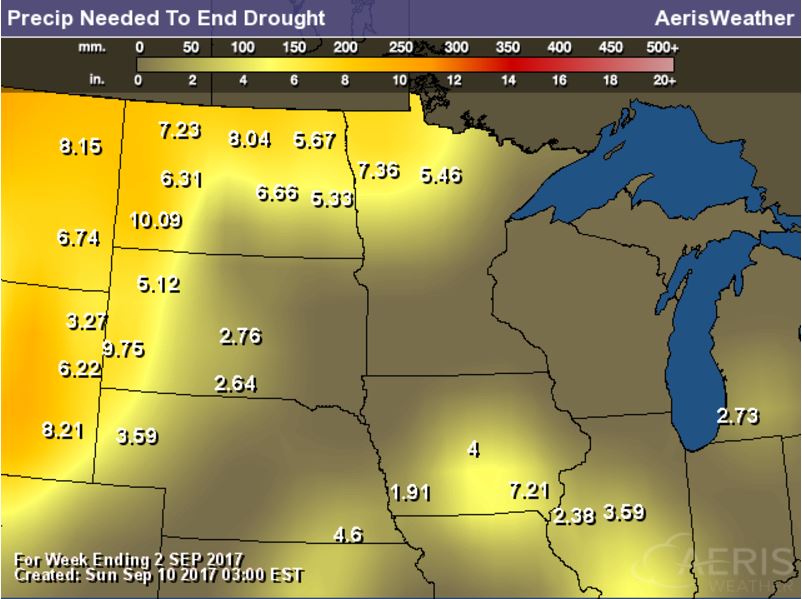
Rain Needed to End Drought
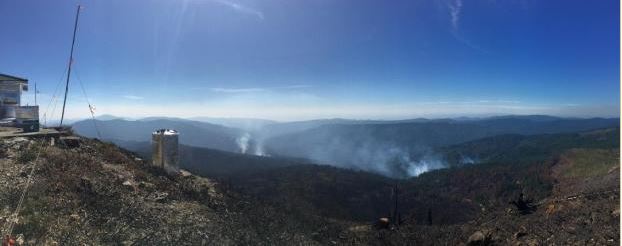
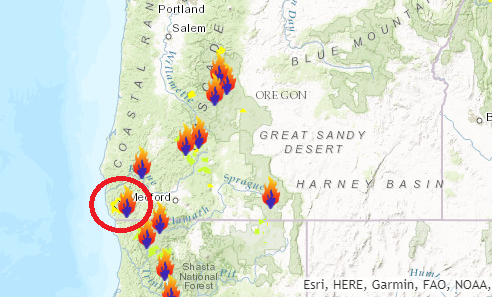
Chetco Bar Fire – 5 Miles Northeast of Brookings, OR
The Chetco Bar Fire in near Brookings, Oregon is a very large wildfire in the Western US that started on Wednesday, July 12th by lightning and has grown to more than 184,000 acres! There are more than 1,500 people working on this fire, which is only 8% contained. The estimated containment date is set for Sunday, October 15th.
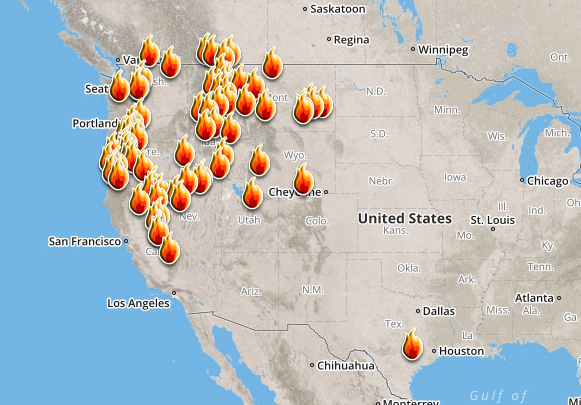
Here’s a look at the current wildfire map across the country. Continued hot and dry weather has helped to spark several wildfires across the Western US. There have even been fires popping up in the Eastern U.S., two of the larger fires are burning in Florida.
Here’s a list of all the current large wildfires from Inciweb:
National Weather Outlook
Here’s the weather outlook through midweek, which shows the remnants of IRMA moving into the Northeast with scattered showers. Also note the next wave of energy moving into the Western US areas of heavy rain. There also appears to be enough cold air for some of the first snow of the season across the high elevations in the Northern Rockies.
.gif)
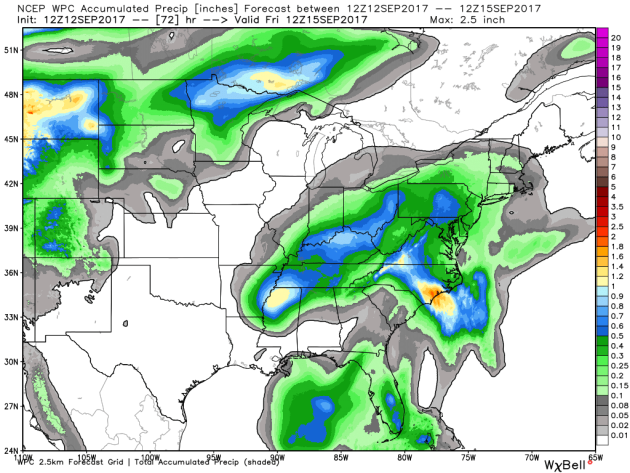
5 Day Precipitation Outlook
According to NOAA’s WPC, the next several days could produce areas of locally heavy rainfall across parts of the Southeastern and Northwestern US. The remnants of IRMA will continue to push through the Eastern through the 2nd half of the week. The next system moving into the Western US will produce areas of 2″ to 4″ rainfall tallies. Note that some of the heaviest will be found in Montana and across North Dakota, where they really need it! There may also be some SNOW in the higher elevations!
.gif)
According to NOAA’s WPC, there is a MARGINAL risk of excessive rain on Wednesday & Thursday across the Western US and our next storm system moves into western part of the country.
.gif)
.gif)
________________________________________________________________________
By Paul Douglas
_______________________________________________________
This Day in Weather History
September 13th
1994: Lightning strikes and injures a 35 year old man in Stearns County as he opens the door of his truck. Witnesses said he was thrown 10 feet when the lightning bolt struck him.
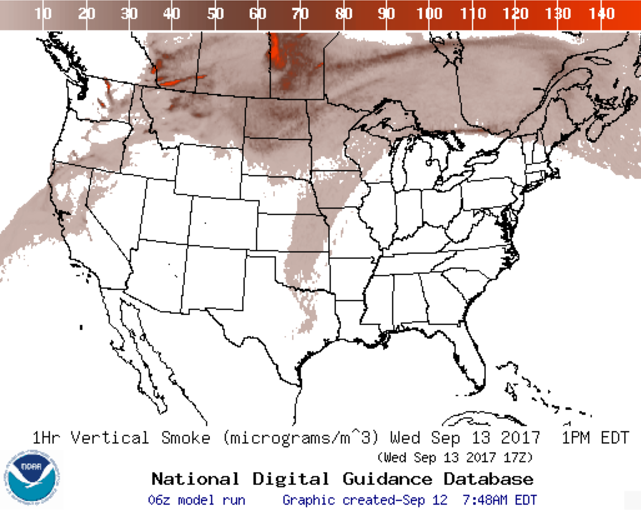
1834: Smoke fills the sky at Ft. Snelling due to fires burning nearby.
________________________________________________________
Average High/Low for Minneapolis
September 13th
Average High: 73F (Record: 95F set in 1939)
Average Low: 54F (Record: 33F set in 1890)
Record Rainfall: 1.29″ set in 1921
_________________________________________________________
Sunrise/Sunset Times for Minneapolis
September 13th
Sunrise: 6:50am
Sunset: 7:27pm
Hours of Daylight: 12hours & 37mins
Daylight LOST since yesterday: ~3 minutes and 5 seconds
Daylight LOST since summer solstice (June 20th): ~3 hours __________________________________________________________
Moon Phase for September 13th at Midnight
1.0 Days Before After Quarter
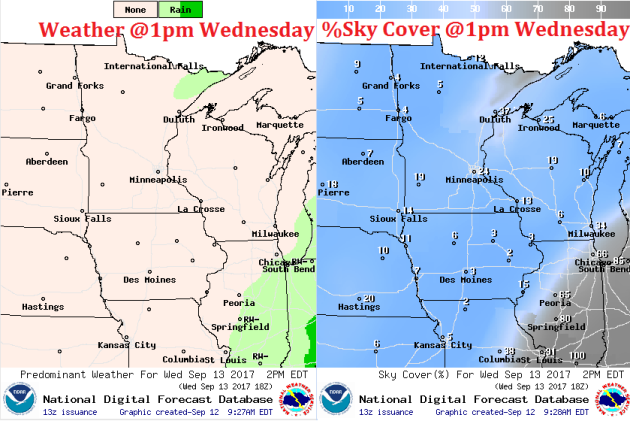
Wednesday will be another warm mid-September day with highs in 80s across much of the state with the exception of those near Lake Superior. Dewpoints will also be a bit sticky as they climb into the low to mid 60s across the state as well.
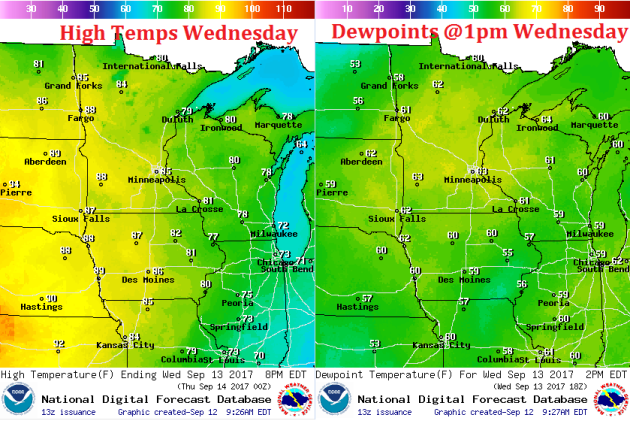

Weather Outlook For Wednesday
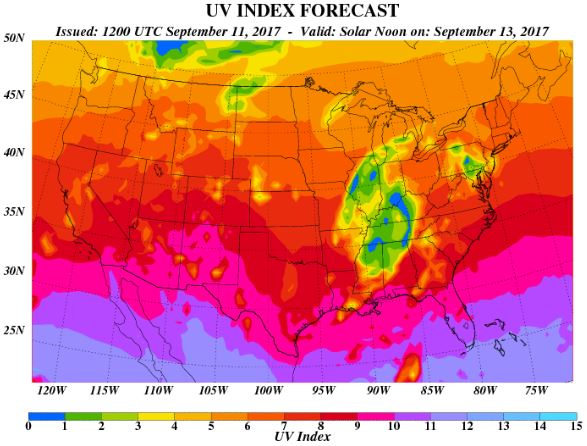
UV Index for Wednesday – HIGH
The UV Index for Wednesday will be HIGH, which means that it will only 20 to 30 minutes or less to burn unprotected skin. With that said, if you are planning on spending any extended length of time outside, make sure you wear appropriate attire and lather on the sun block!
__________________________________________________________________________
.gif)
.png)
______________________________________________________
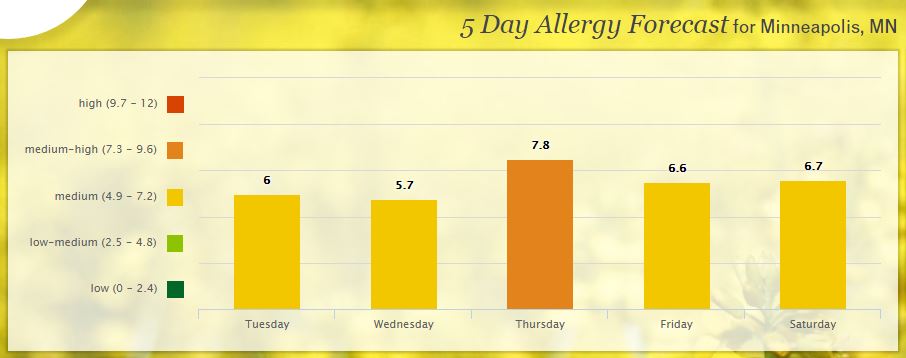
Pollen Forecast
 ____________________________________________________________________________
 Minneapolis Temperature Outlook
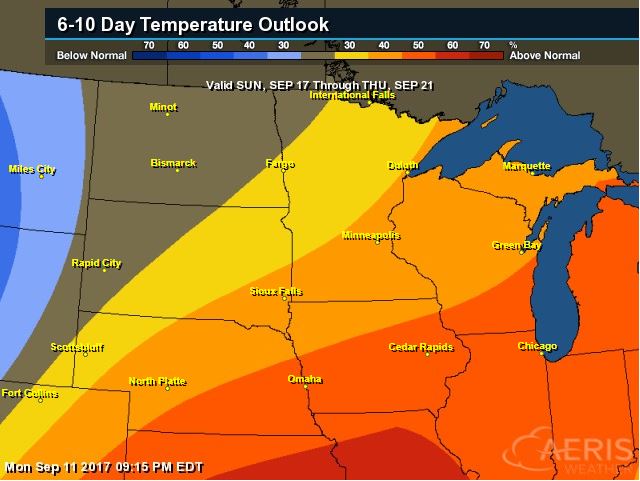
Here’s the temperature outlook through September 26th, which shows temps warming into the 80s through Friday, but will likely fall into the 60s and 70s as we head into the 2nd half of the month.
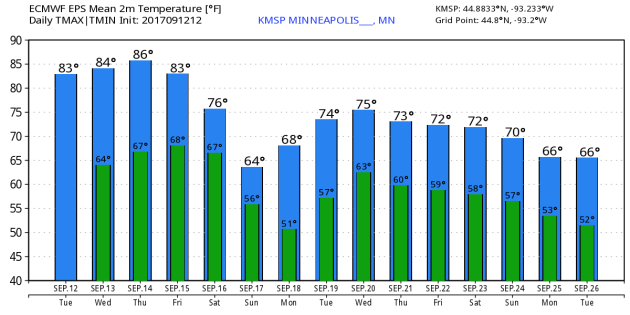
According to NOAA’s CPC, the extended temperature outlook from September 17th through the 21st suggests warmer than average temperatures settling back in across much of the Midwest, Great Lakes and Central part of the country.
___________________________________________________________
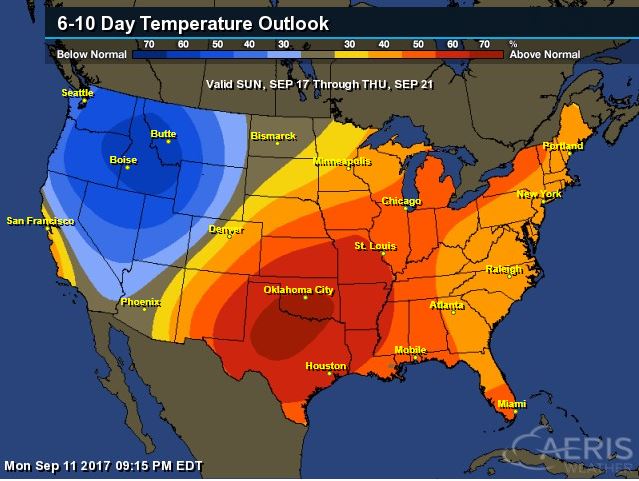
Extended Temperature Outlook
According to NOAA’s CPC, the extended temperature outlook through September 21st shows that a good chunk of the Eastern and Southern U.S. will be warmer than average, but the Western US will remain cooler than average.
 __________________________________________________________
“A dramatic earthflow video from Dimye village in Tibet”
A video has been circulating this weekend on Twitter showing a dramatic earthflow from Dimye in Tibet. This apparently originated from Wechat & Weibo in China, although very little information is available about it. The video does not showing any obvious frozen soil or ice blocks. To me this is quite reminiscent of the landslides that we see in peat in the uplands of Europe. My fellow blogger Callan Bentley featured a nice example on his blog exactly a year ago. The soils involved in the Dimye village landslide are extremely dark in colour, which suggests that they are rich in organic matter. I note that in a recent (open access) paper, Yang et al. (2017) describe peat areas in the Qinghai-Tibetan area, noting that there is significant environmental degradation occurring in these places, causing rapid peat loss. It is not possible to say whether this is indeed a peat landslide, or something similar in an organic soil, or a permafrost slide. Unfortunately, I doubt that more information will become available in the near future. But it is a great video.
See more from Blogs.agu.org HERE:

__________________________________________________________________
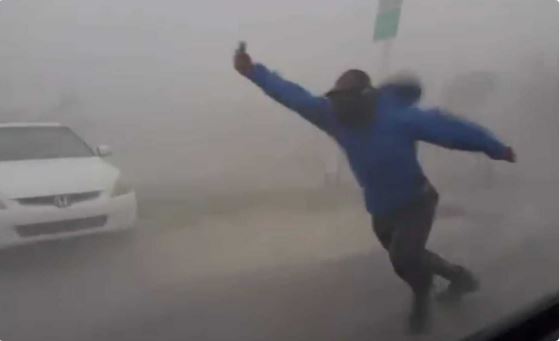
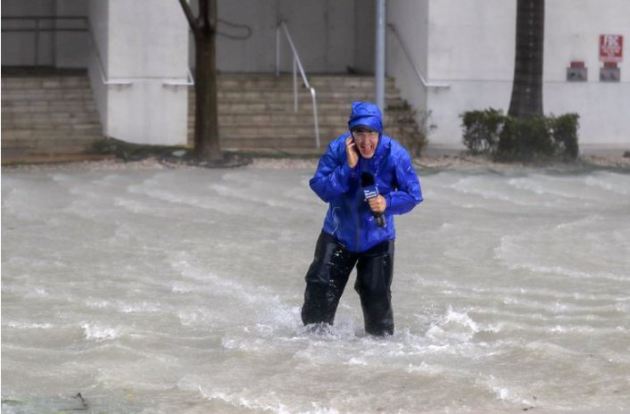
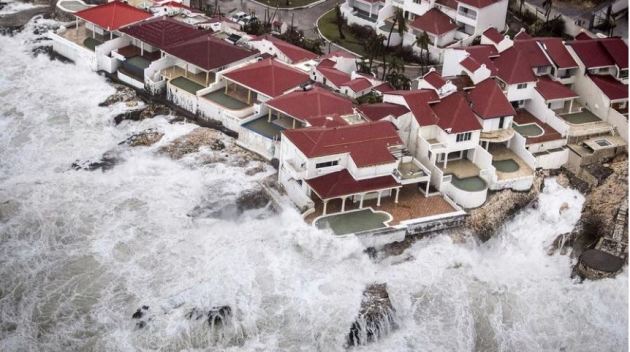
“The most interesting and scary things we’ve seen on social media during Hurricane Irma”
_________________________________________________________________
___________________________________________________________
“Fires, droughts and hurricanes: What’s the link between climate change and natural disasters?”
“With Hurricane Irma smashing into Florida so soon after Hurricane Harvey flooded southeastern Texas — and as wildfires burn through the western United States — extreme events have been hitting the U.S. from all sides. To what extent does climate change influence them? Here are a few ways researchers think that climate change’s effects could play out. SEA LEVEL RISE AND STORM SURGE: As sea levels continue to rise due to global warming, they’re increasing the risk of storm surge — the dangerously high floods caused by a storm pushing water onshore. Those floodwaters are responsible for much of the damage left by hurricanes — particularly in highly populated coastal cities.
A 2013 study in PNAS found that the risk of a Hurricane Katrina-level storm surge rose two to seven times for every 1.8-degree Fahrenheit increase in temperature.”
_____________________________________________________________
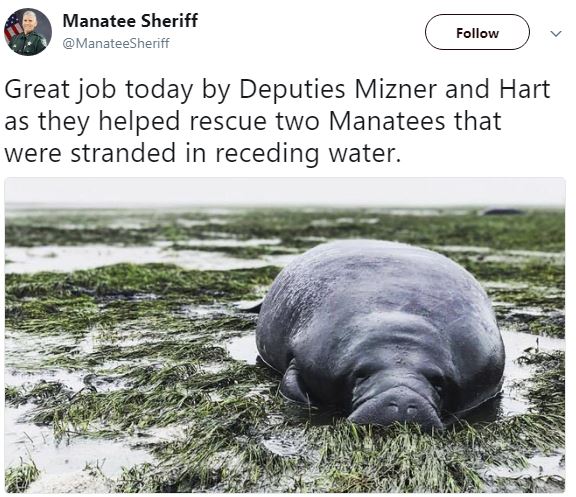
“Beached Manatees Rescued From Low Tide In Wake of Hurricane Irma”
“A group of Florida residents came across two beached manatees Sunday afternoon in a bay that had dried up as a result of Hurricane Irma. The manatees were stuck in the mud about 100 yards from deeper water, near Whitfield Avenue and U.S. Route 41 in Manatee County, Florida, the Bradenton Herald reported. “We had to do something about it,” local resident Tony Faradini-Campos told the Sarasota Herald-Tribune. “We couldn’t just let those manatees die out there. We shared the pictures on social media and it just blew up.” The individuals who found the manatees originally tried to move them themselves, but were not successful and had to bring in further assistance. “We actually reached out to some friends who work for the county that ended up going out there and rescuing them,” Michael Sechler, one of the passersby who discovered the manatees, told HuffPost. Two Manatee County deputies and officials from the Florida Fish and Wildlife Conservation Commission came to the bay to help the rescue effort, the Herald-Tribune reported.”
See more from HuffingtonPost HERE:
__________________________________________________________________
“Dissecting the parts of a hurricane”
Irma is a big one. Its circulation spans hundreds of miles in all directions, large enough to fully engulf the entire peninsula of Florida at once. Hurricane-force winds extend outward up to 80 miles from the center, with blustery conditions felt from the Caribbean to the Carolinas. With impacts felt across such a wide area, it’s important to understand the threats of each part of Irma; whether it’s the spiral rainbands or the infamous eyewall, danger extends well beyond Irma’s center. The most dangerous ‘right-front quadrant’ Irma is like a giant atmospheric buzz saw, scouring the ground wherever she strikes. But if you picture this counterclockwise spinning saw blade moving along the ground at a forward speed of 15 mph, it stands to reason that winds on the right-hand side would be amplified by this motion. If the storm is spinning at 120 mph and trekking along at 15, then gusts to 135 would buffet areas beneath the right-side eyewall. Likewise, this effect actually makes life a bit easier on the left side; there, surface winds are reduced to “only” 105 mph, lessening the ferocity of the storm. For that reason, you may have heard meteorologists refer to the “right front quadrant” of Irma as the most dangerous sector of the storm.
See more from WashingtonPost HERE:
.jpg)
________________________________________________________________
“Why Hurricane Harvey and Hurricane Irma Are Terrific News For This One Company”
“As Houston tallies up the damage from Hurricane Harvey and Florida prepares for Irma’s potential landfall, Wall Street investors are searching for potential winners amid what are shaping up to be two of the costliest storms in U.S. history. One such high-climber? Lumber Liquidators, a hardwood flooring firm that could benefit as homeowners seek material to rebuild. Lumber Liquidators has been in a slump since 2015, when 60 Minutes reported, and the CDC later confirmed, that some of its products could increase users’ risk of cancer. The company’s stock rallied slightly after the U.S. Consumer Product Safety Commission completed a probe without issuing recalls. But the Commission also failed to reassure consumers with health concerns, causing lasting damage to the brand’s appeal. But Lumber Liquidators’ stock is now hitting levels not seen since just after the 60 Minutes segment — in part thanks to Hurricane Harvey and Hurricane Irma.”
See more from Fortune.com HERE:
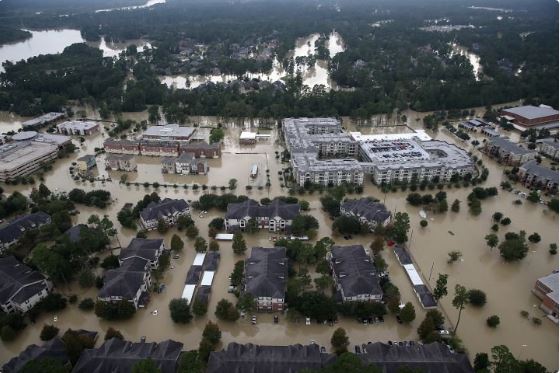
___________________________________________________________________________“The Role Of Climate Change In Extreme Weather Events”
“As Houston struggled in the aftermath of the record-breaking rainfall from Hurricane Harvey, and no fewer than three hurricanes simultaneously moved across the Atlantic basin, a reader asked if I could explain the role of climate change in the recent extreme weather events. I want to connect the dots with arguments that aren’t really controversial. First, is the climate changing? Almost everyone would agree that this is the case. What some would dispute is whether human activity is a significant contributor. I accept that it is, but I won’t attempt to make that case here. If you don’t accept that human activity is impacting the climate, I won’t be able to convince you in a short article here. But let’s agree that the climate is changing. There are multiple lines of evidence that indicate that the earth is warming. One piece of evidence is that the surface temperature of the oceans is climbing. NOAA (National Oceanic and Atmospheric Administration) has determined that since 1880, the average global surface temperature of the ocean has increased by about 1 degree Fahrenheit (°F). (See their methodology here). Relative to the average temperature from 1971 to 2000, the surface temperature over the past five years has risen about 0.5°F.”
See more from Forbes.com HERE:
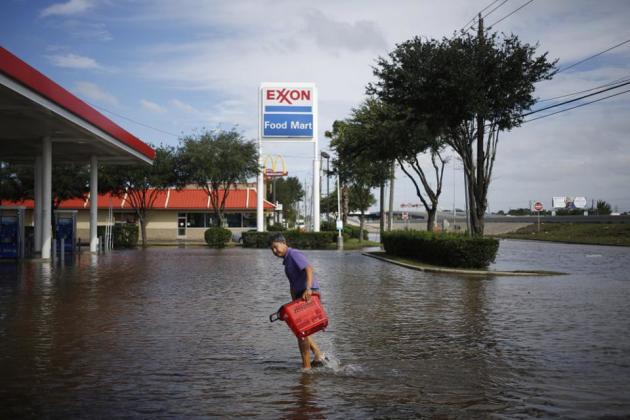
(A convenience store owner walks through floodwaters from Hurricane Harvey outside an Exxon Mobil Corp. gas station in Houston, Texas, U.S., on Wednesday, Aug. 30, 2017. Unprecedented flooding from the Category 4 storm that slammed into the state’s coast last week, sending gasoline prices surging as oil refineries shut, may also set a record for rainfall in the contiguous U.S., the weather service said Tuesday. Photographer: Luke Sharrett/Bloomberg)
_________________________________________________________________________