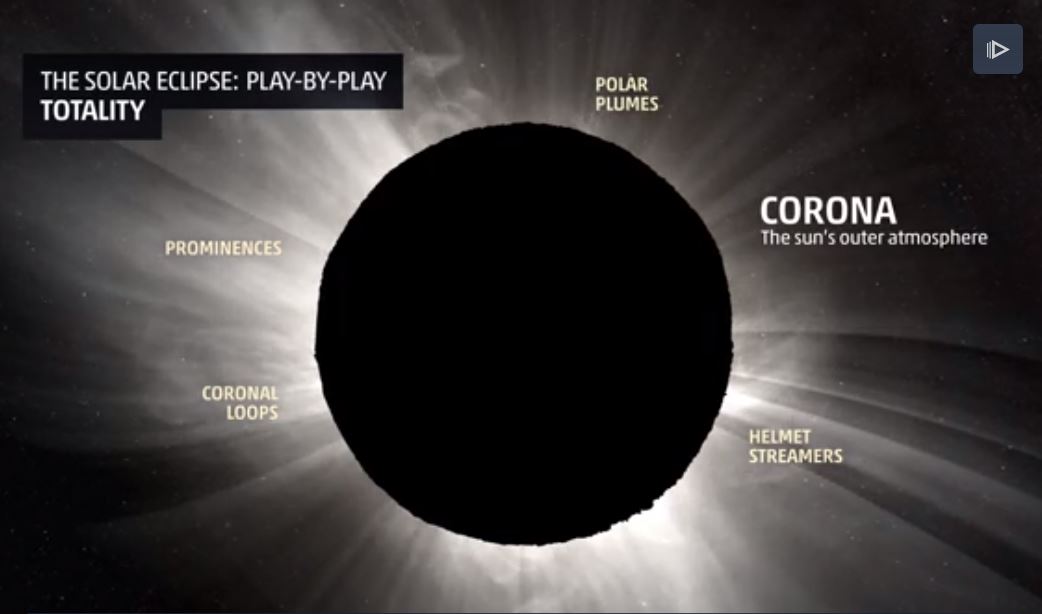
Eclipse Play-By-Play

“meteorologist Mark Elliot goes through a simulation of experiencing the total solar eclipse on Aug. 21 from the perspective of an observer on the ground. As a science editor for Mashable, I know the ins and outs of what causes an eclipse, and how dark it will get if you are in the path of totality, which on Monday will cut a narrow swath from Oregon to South Carolina. However, even I was impressed by how otherworldly the sky will appear at the time of the total solar eclipse, and how many intricate details will be revealed, about the moon and the sun, during a several-minute period on Monday. So, before looking up — with proper eyewear protection — on Monday, take a look at this clip first. And get psyched.”

See more from Mashable HERE:

Great American Eclipse – Solar Eclipse Monday

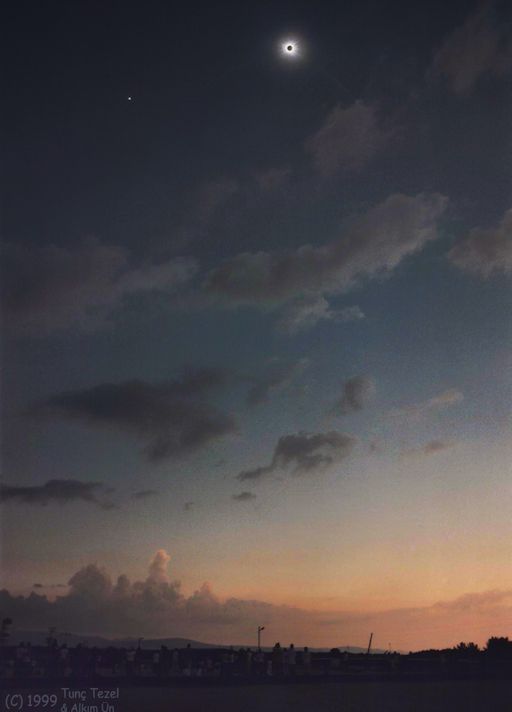
WHY GO TO THE PATH OF TOTALITY? On Aug. 21, 2017, every square inch of the USA will experience a solar eclipse. In most places, the eclipse will be partial–that is, the Moon will cross the sun off-center leaving only a crescent-shaped portion of the solar disk exposed. Is it really worth the trip to the path of totality when you can see most of the sun covered from the comfort of your own home? Pulitzer prize winner Annie Dillard witnessed both types of eclipse in 1979, and her comparison might help you make up your mind: “A partial eclipse is very interesting. It bears almost no relation to a total eclipse. Seeing a partial eclipse bears the same relation to seeing a total eclipse as kissing a man does to marrying him, or as flying in an airplane does to falling out of an airplane.” During the minutes of totality, the whole world changes. Saying that day turns into night barely scratches the surface of it. The shadow of the Moon lances down to Earth from a quarter million miles away. On one end is you; on the other end is a million square miles of dusty lunar terrain. You’re connected, and you can feel the cold.

See more from SpaceWeather.com HERE:

((Image Credit & Copyright: Tunç Tezel (TWAN), Alkim Ün via SpaceWeather.com)


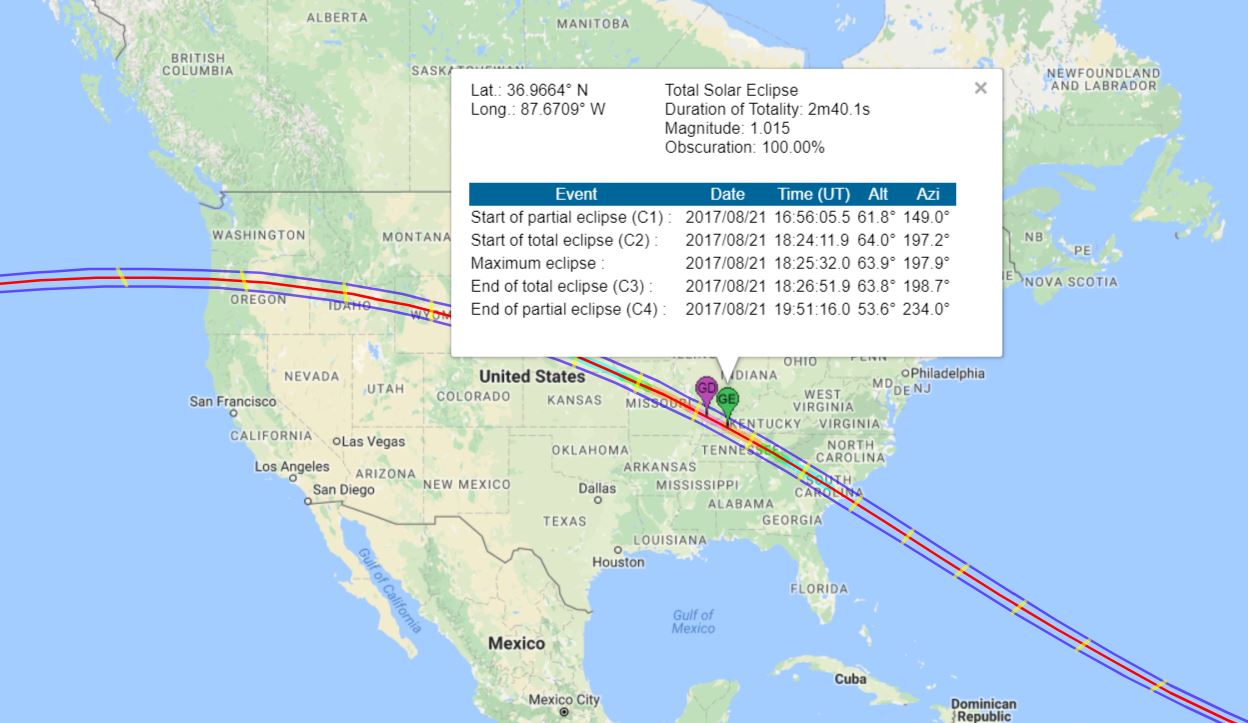
Total Solar Eclipse Interactive Map

Want to know the timing of the solar eclipse across the country? Here’s a great interactive map from NOAA that can help! For example, the green marker near Hopkinsville, KY shows the point of “Greatest Eclipse” with the total eclipse lasting 2minutes and 40seconds and the maximum eclipse occurring at 18:25 UTC or 1:25pm CDT.

See more from NOAA HERE:

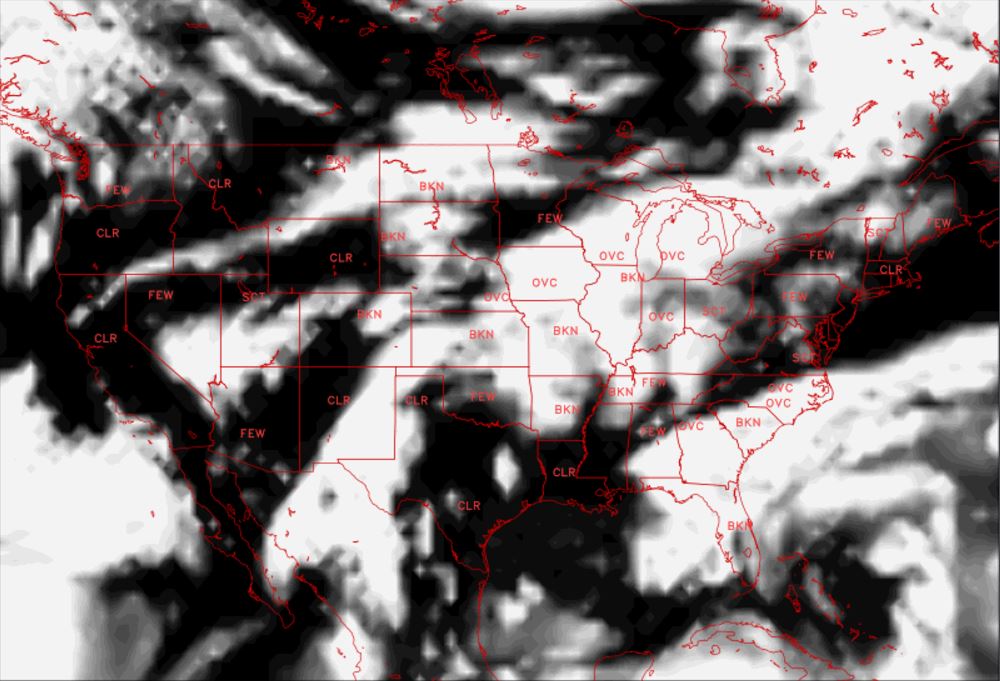
Cloud Forecast: Midday Monday

Here’s the cloud forecast for midday Monday, which shows a blob of clouds over the Central US. Unfortunately, there may be cloud issues in the Central US for folks trying to catch the total solar eclipse there. Stay tuned…

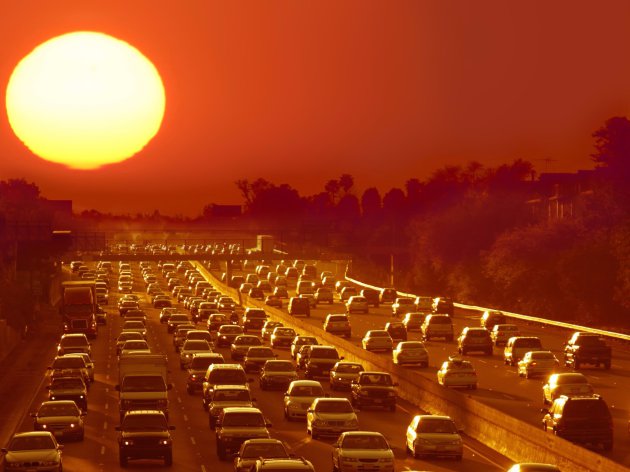
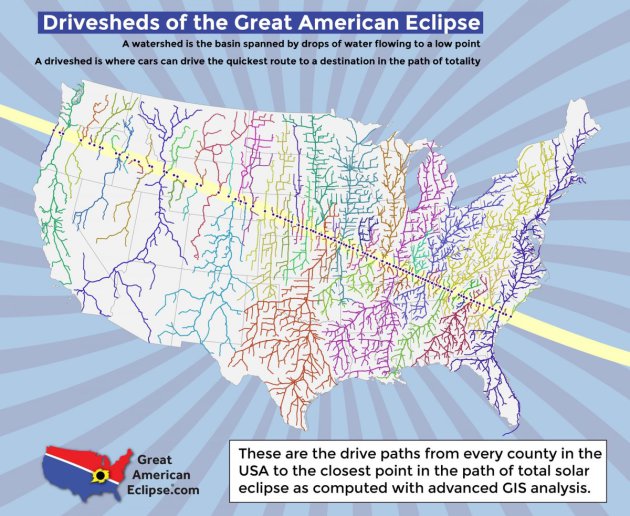
“The car-traffic apocalypse of the total solar eclipse has begun”

The total solar eclipse of August 21 is almost upon the US. Approximately 7.4 million Americans may travel to the path of totality, where the moon’s darkest shadow will cut across the country. But this mass migration may overwhelm small towns and cities with record tourism — and choke key roadways with gridlock traffic. That’s according to an analysis by Michael Zeiler, a cartographer at the mapping data and technology company Esri, and an eclipse chaser of 26 years. “People should not casually expect to drive down on the morning of the eclipse,” Zeiler told Business Insider. In Oregon, which will be the first US state to see the moon blot out the sun, it seems the mass influx of vehicles for the eclipse may have already begun. A video taken on Wednesday by a frustrated-sounding central Oregon resident, which KAPP-KVEW Local News posted to its Facbook page, shows a line of cars that stretches for all 4 minutes and 32 seconds of the video, and for about 4 miles of roadway. “This is all heading into Prineville on a Wednesday, all the way up the mountain,” she said in the video, which she recorded around 11:32 a.m. PDT. “There is no accident. This is all for the lovely eclipse that is happening, and everyone trying to get into their camping spots.” She added: “Luckily, I’m heading the other direction. … The cars next to us are going roughly 5 miles per hour, if not completely stopped.”

See more from Business Insider HERE:

(Image credit: Shutterstock via BusinessInsider)

 
“Soul-crushing traffic may plague the total solar eclipse — these maps reveal the worst choke points”
Monday’s total solar eclipse will be the first to slice across the US in 99 years, inspiring many Americans to pack up the car and drive to totality: the path of the moon’s darkest shadow. In fact, up to 7.4 million people may journey to the 70-mile-wide, 2,800-mile-long track where the moon will block the sun and reveal the star’s wispy corona. That’s according to Michael Zeiler, a cartographer at Esri, a mapping data and technology company. Zeiler has anticipated this moment since he started chasing eclipses 26 years ago. He has spent the past few years gathering data, plotting maps of the eclipse (and its surprising ramifications), and uploading them to his website, GreatAmericanEclipse.com. Zeiler considers his “driveshed” maps some of his favorites. Like watershed maps that show how brooks, streams, and rivers move toward an ocean, his version shows where vehicles are most likely to flow toward a viewing location. “I thought about about every populated point in the United States, and I asked the data: What is the quickest drive to totality?” Zeiler told Business Insider. “I discovered there’s going to be about one or two dozen traffic-congestion points that are going to be particularly severe.” Here are the 12 biggest drivesheds Zeiler has identified, the cities they center on, and — by extension — the places most likely to be choked with gridlock traffic.
 

_______________________________________________________________

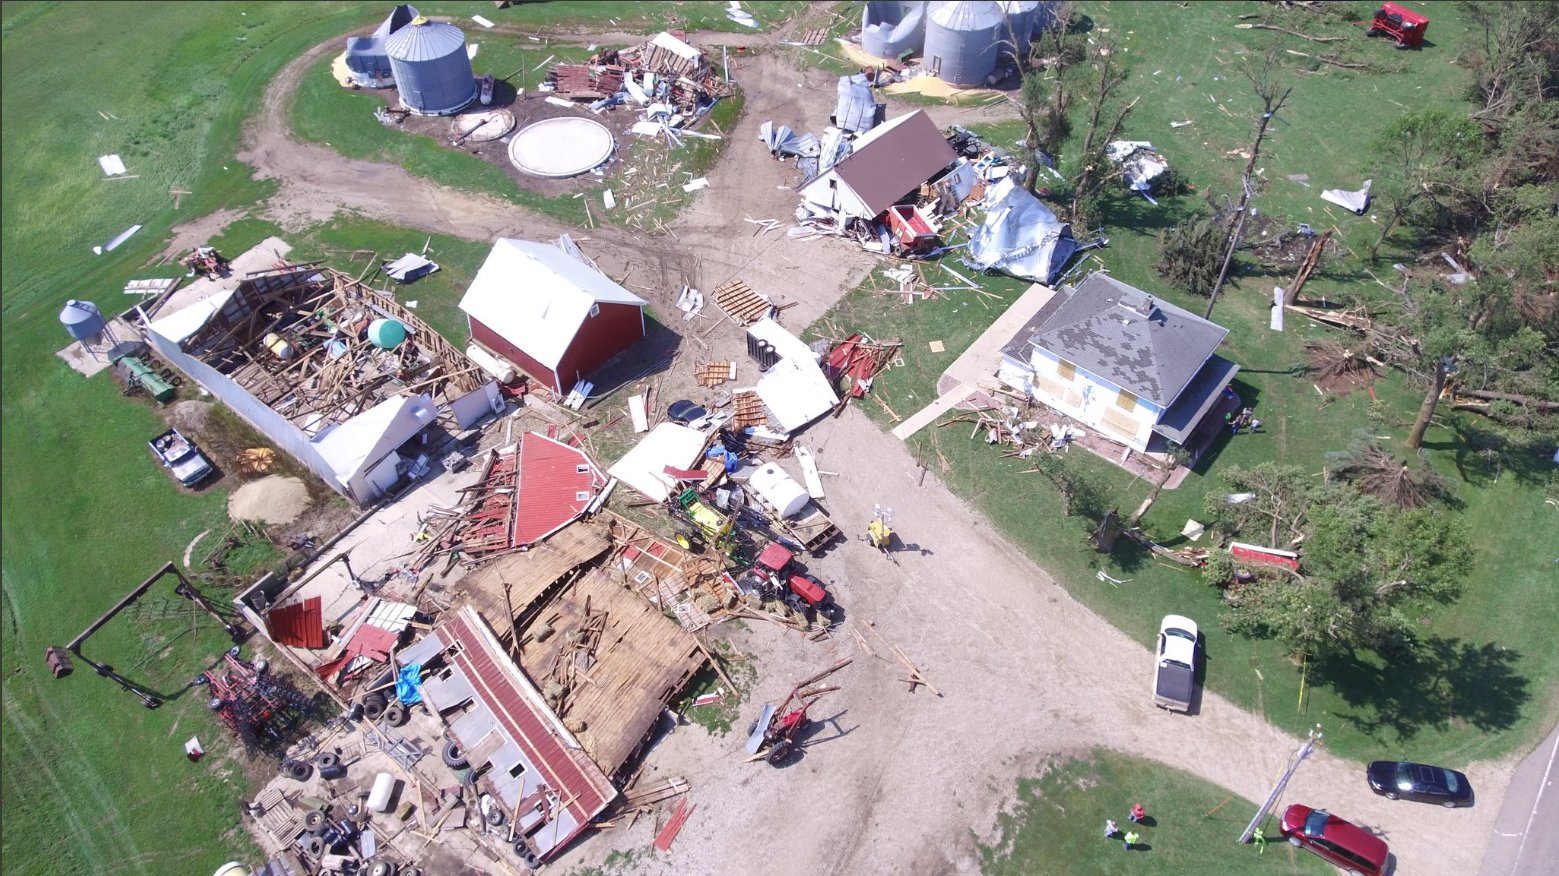
Tornadoes in Southwest Minnesota Friday Evening

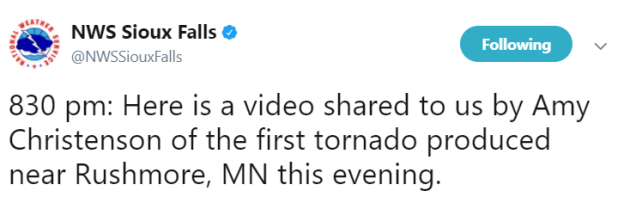
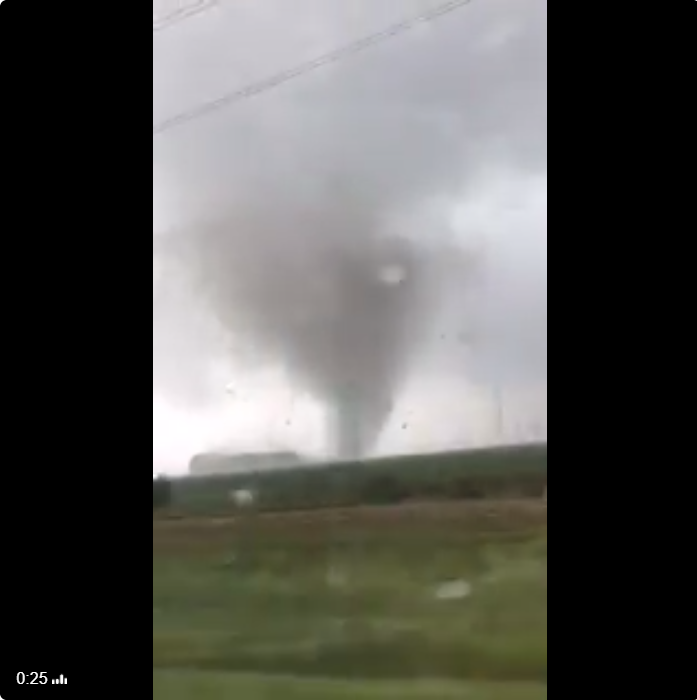
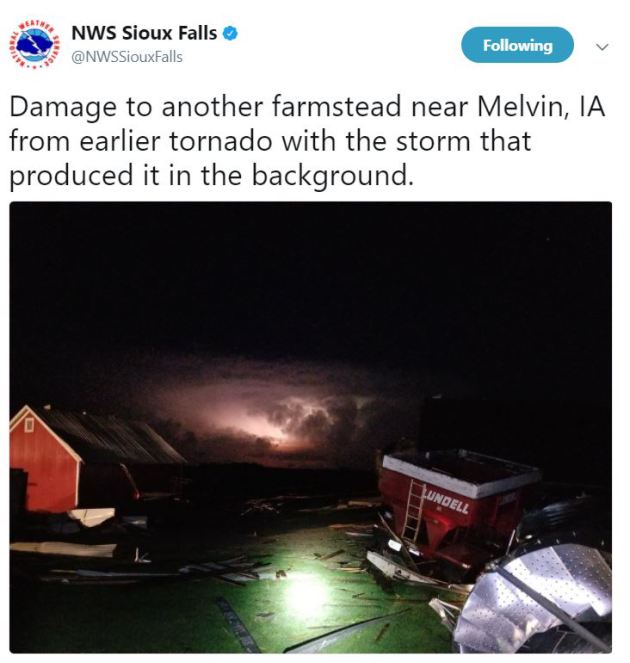
A line of strong to severe thunderstorms developed Friday evening across eastern South Dakota and dropped southeast into Southwest Minnesota with a number of large hail and wind damage reports. There was even a report of a tornado, which was caught and camera and shared to the @NWSSiouxFalls. This particular tornado reportedly destroyed a hog barn.

See more from the @NWSSiouxFalls HERE:


Tornado Damage and Large Hail

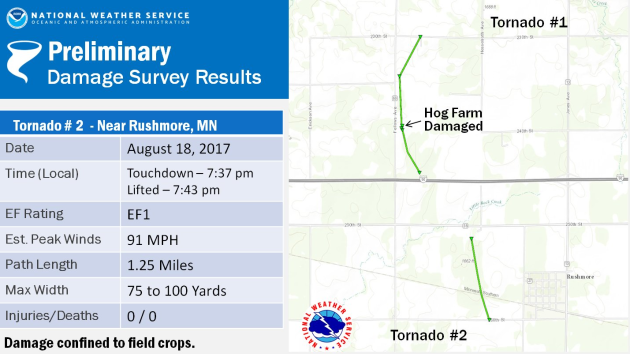
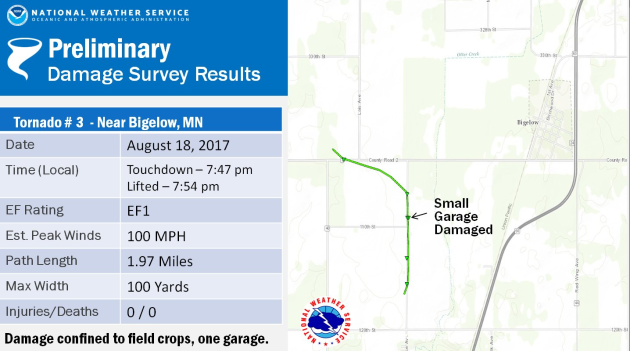
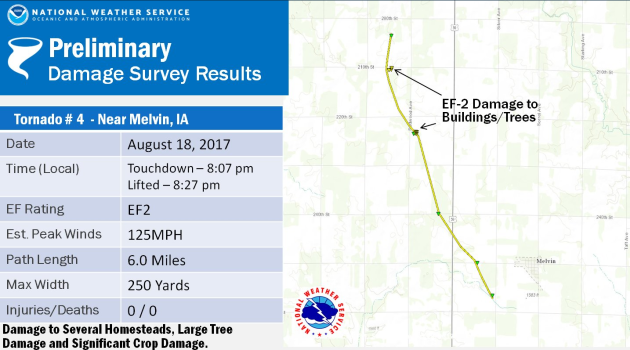
The National Weather Service in Sioux Falls, SD confirmed 4 tornadoes on Friday evening. Here are some images from the @NWSSiouxFalls of tornado damage out of Melvin, IA and large hail that fell in Bigelow, MN.


Storm Report Map From Friday Evening

The storm report map from Friday evening shows large hail and damaging wind reports stretching from eastern South Dakota through SW Minnesota and into NW Iowa.

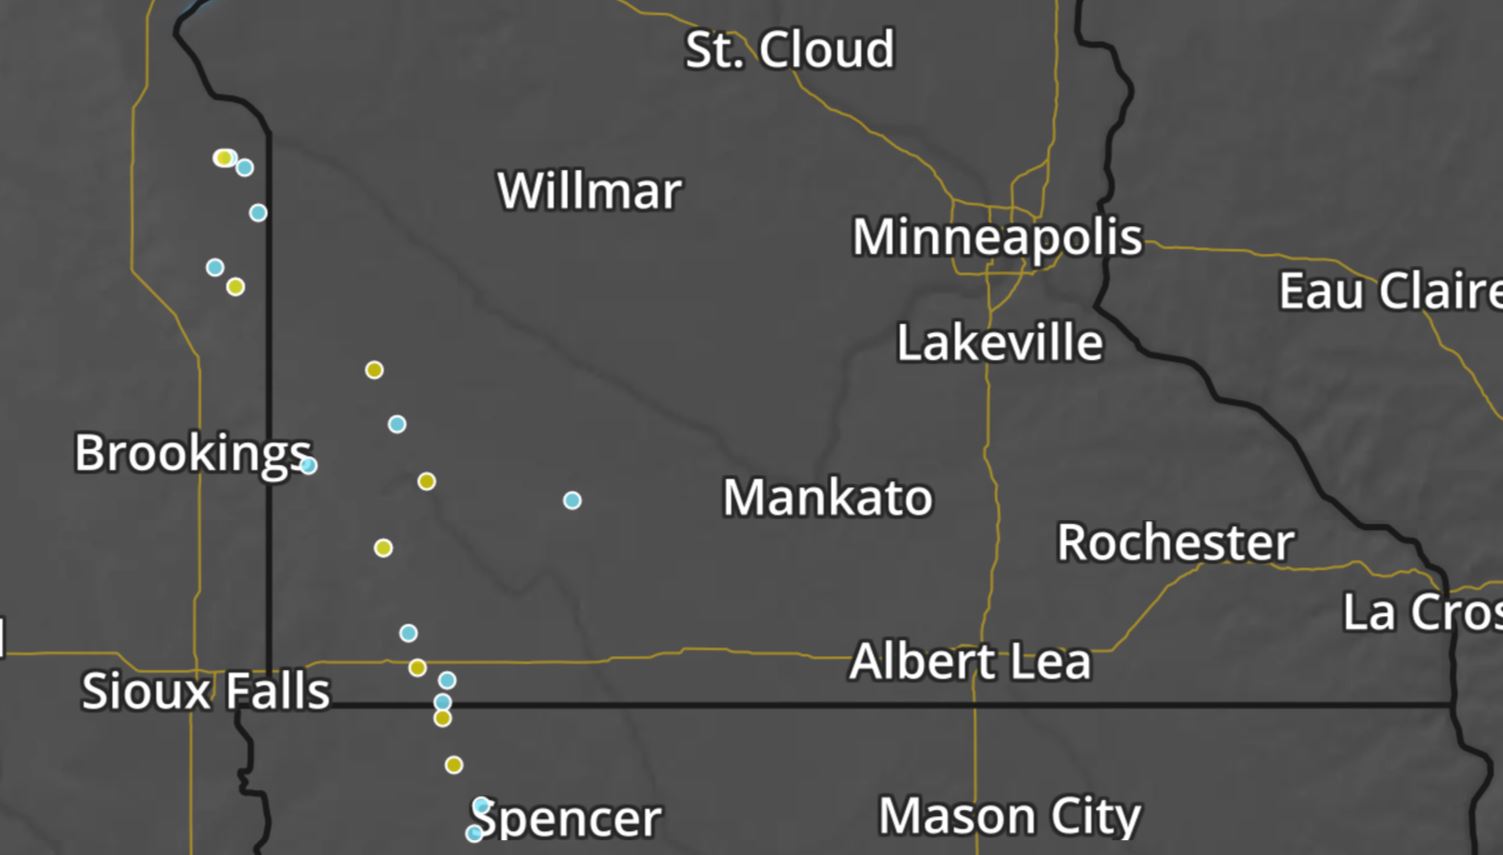
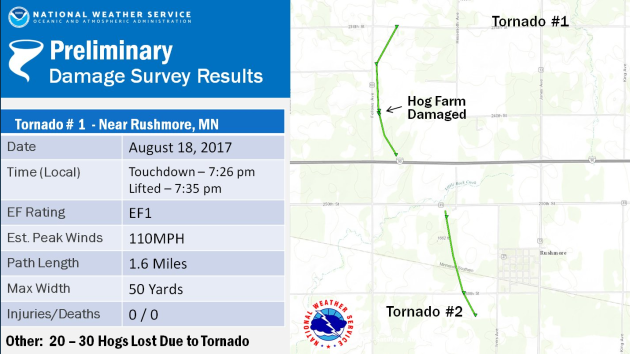
All 4 Tornadoes Confirmed by NWS Sioux Falls


_____________________________________________________________

Severe Threat Sunday and Monday
According to NOAA’s SPC, there is a MARGINAL risk of severe weather across the southern part of the state on Sunday. By Monday, the MARGINAL risk of severe weather shifts a little farther south and moves into extreme southern Minnesota.

Simulated Radar Ahead…
Here’s the simulated radar from Sunday to Monday night, which shows a few isolated showers/storms trying to develop across the region both days. However, it doesn’t appear to be very widespread, so significant rainfall and severe threats should remain fairly minimal.

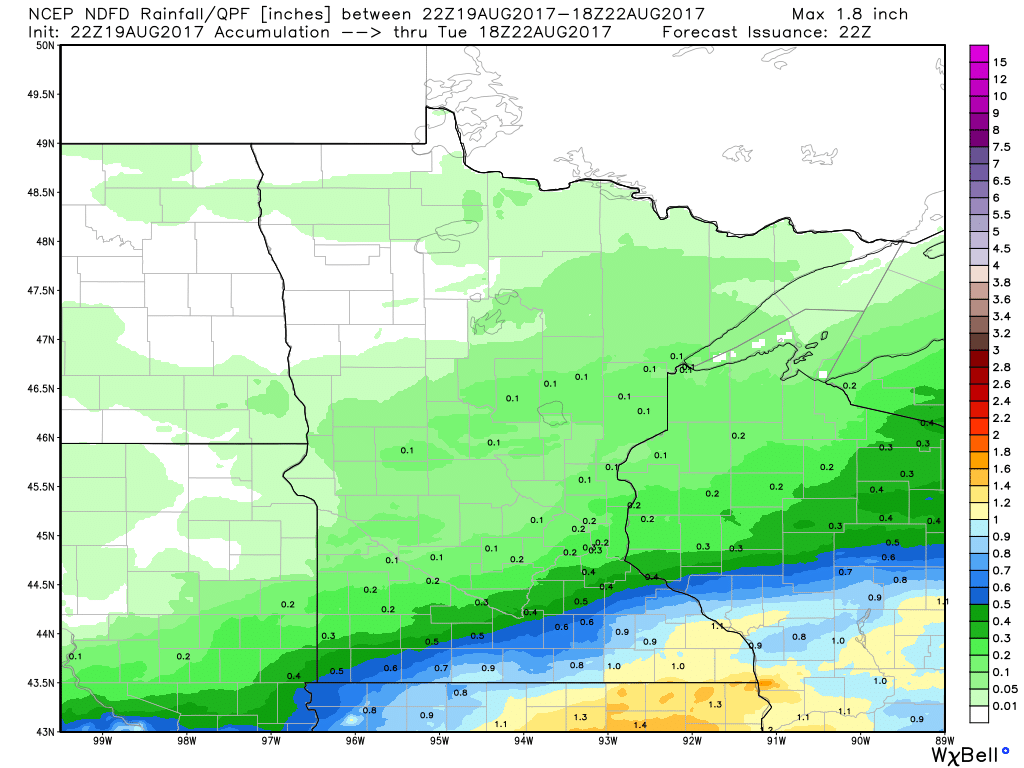
Rainfall Potential Ahead

The rainfall forecast  through PM Monday shows a better chance of locally heavier rainfall amounts across extreme southern and southeastern Minnesota, where some 0.50″ to 0.75″+ amounts can’t be ruled out.

_________________________________________________________

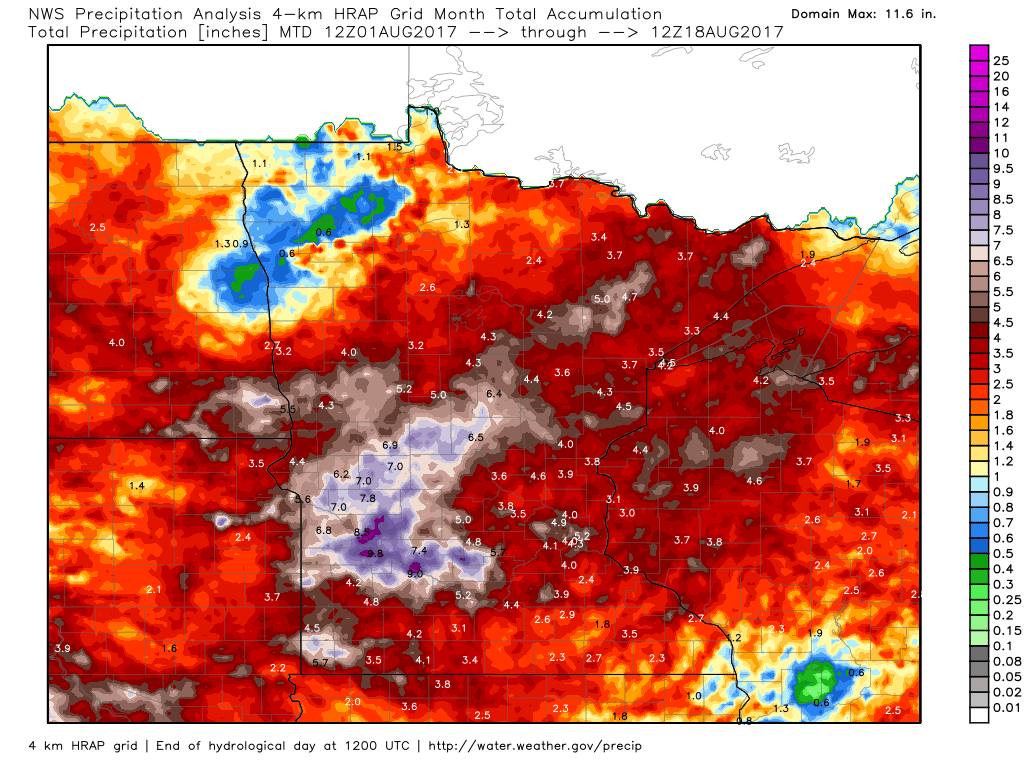
Rainfall Month To Date

It has been a pretty wet month thus far with the Twin Cities seeing 4.53″ of rain through August 18th! That is nearly 2″ above average for the month! Note that some locations in western Minnesota have seen nearly 7″ to 9″+ of rain! So far this year, the Twin Cities has seen 23.43″ of liquid precipitation, which is nearly 3″ above average.

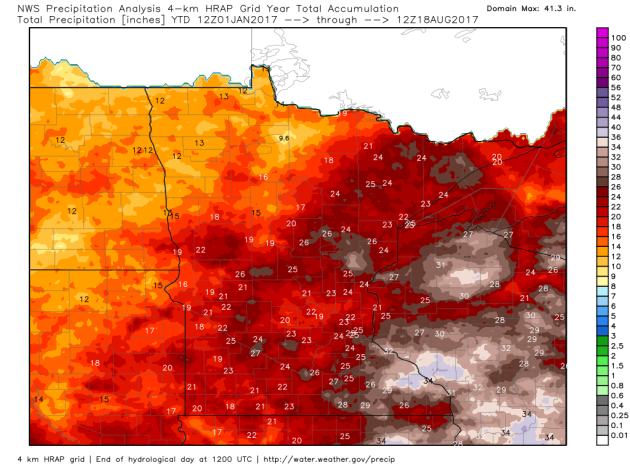
Precipitation Year to Date

Here’s a look at how much precipitation we’ve seen so far this year. Note that precipitation amounts are quite a bit higher as you go east into Wisconsin, while precipitation amounts fall considerably as you head west into the Dakotas. La Crosse, WI has seen nearly 31.57″ of precipitation this year, which is 9.31″ above average! However, Fargo, ND has seen only 10.44″ of precipitation this year, which is -4.39″ below average, while Minot, ND has seen only 5.33″ of precipitation this year, which is 7.27″ below average!
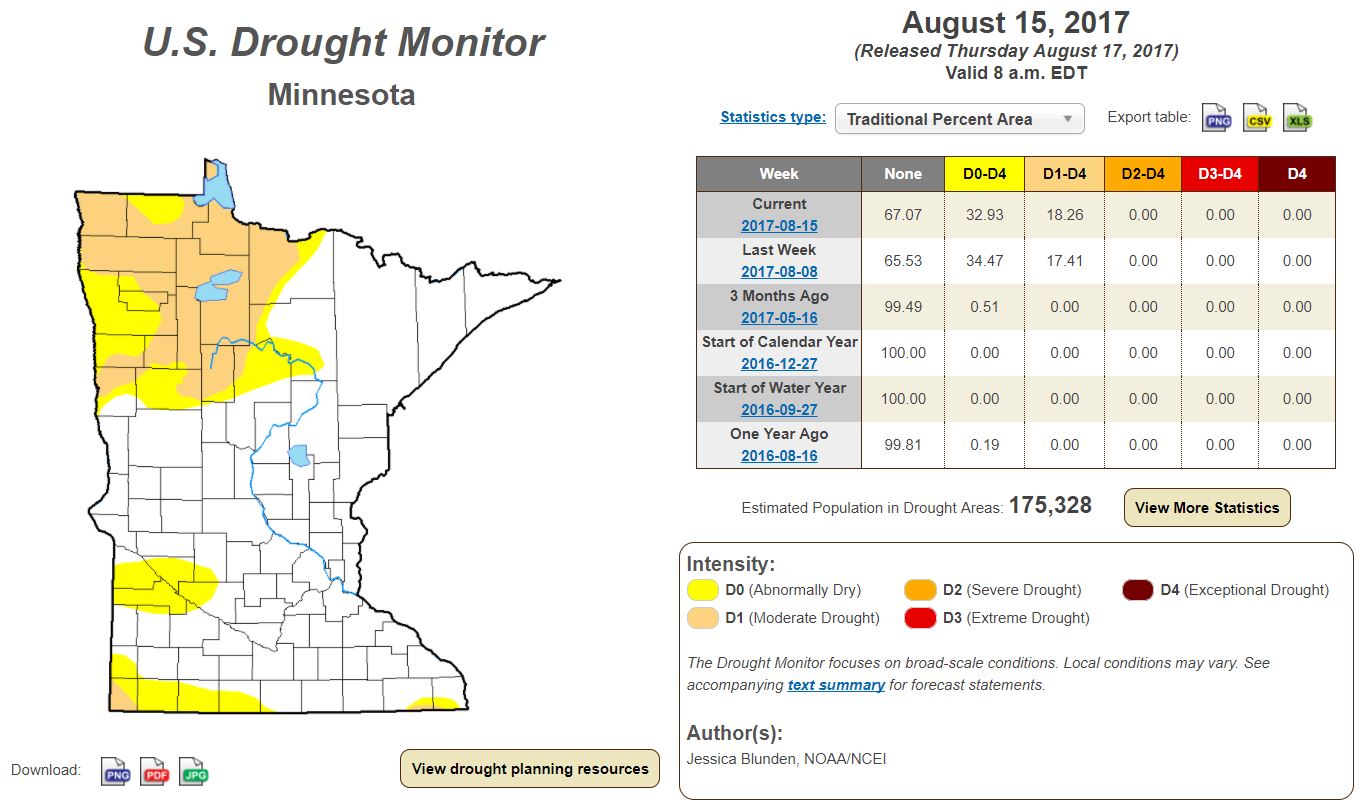
 

US Drought Monitor

While much of the state has had appreciative rainfall this month and so far this year, parts of western and northwestern Minnesota are dealing with moderate drought and abnormally dry conditions. According to the US Drought Monitor, 18.26% of the state is considered to be in a moderate drought, which is up from 17.41% last week. Note that 3 months ago, 0.00% of the state was in a moderate drought and only 0.51% was considered to be abnormally dry.


______________________________________________________

Beautiful Saturday

Despite seeing a little fog on Saturday morning, it turned out to be an incredible day with mild temps and plenty of sunshine. Note that the average high in the Twin Cities has fallen to 80F, so as we head closer and closer to the Autumnal Equinox (September 22nd @3:02pm), the number of days with extreme heat and high humidity will begin to fade a little bit.
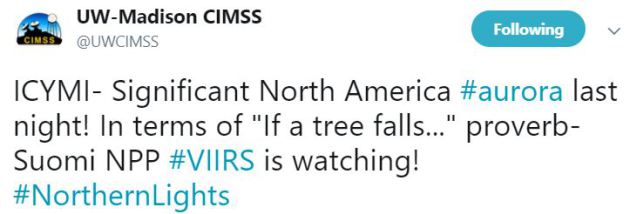
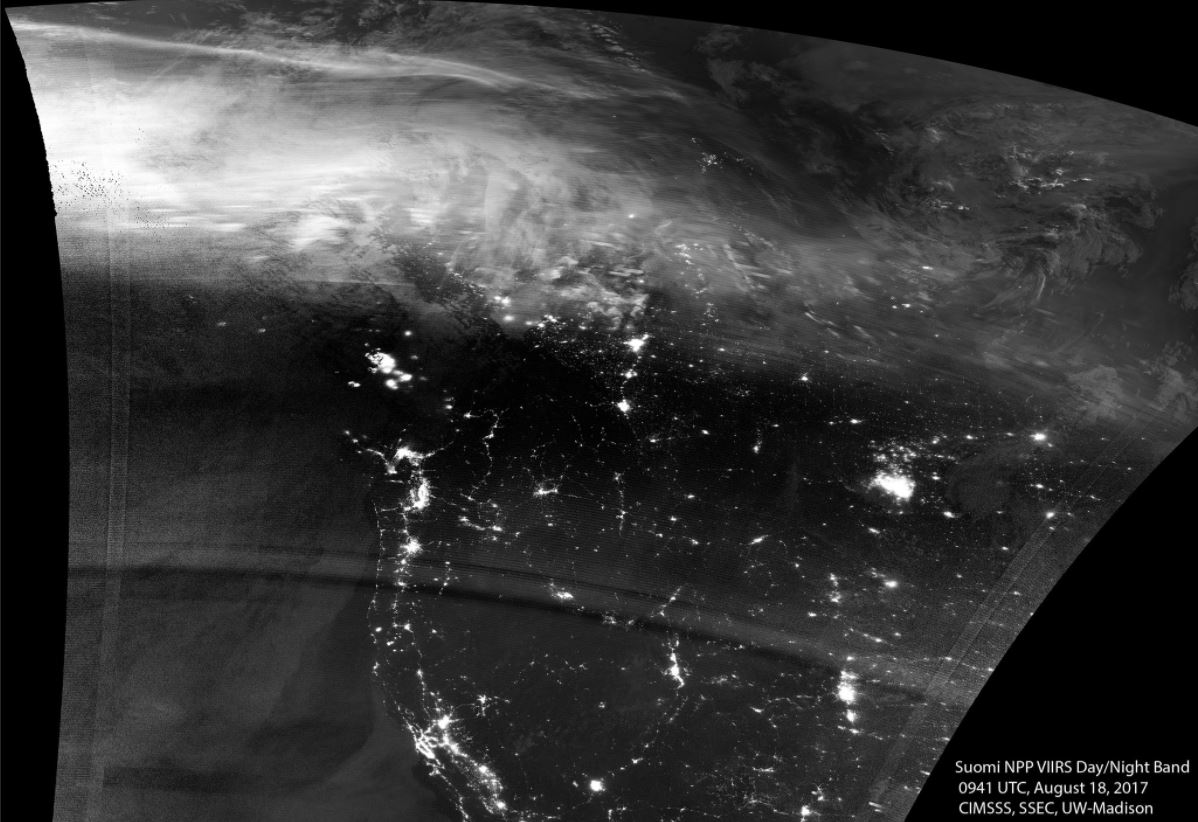
 

______________________________________________________________

Pollen Forecast
Itchy, sneezy? I tend to get a little more allergic to fall and I notice it more and more starting around State Fair time, which then finally starts to fade as the first frosts of the season start to arrive. With that said, according to pollen.com, the allergy forecast for Minneapolis suggests high to medium-high levels over the next few days. AHHH-CHOOO!!!

__________________________________________________________________

Northern Lights

WOW! Take a look at this image from @UWCIMSS, which shows aurora across Canada! This image was captured Friday evening from space!


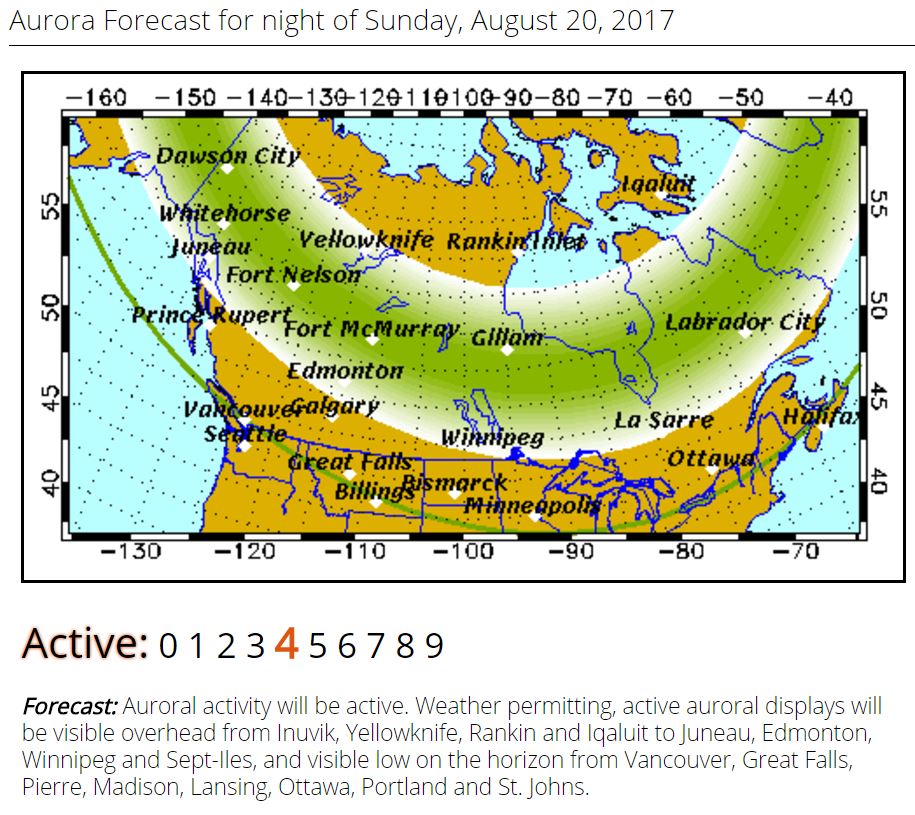
Northern Lights Forecast Sunday

According to the Geophysical Institute at the University of Alaska Fairbanks, the aurora forecast for Sunday suggests a fairly active pattern. Note that northern lights could be seen as far south as Vancouver, Great Falls, Pierre, Madison, Lansing, Ottawa, Portland and St. Johns!!

___________________________________________________________________________

HARVEY in the Atlantic
The National Hurricane Center is tracking HARVEY in the Atlantic basin, which became the 8th named storm of the 2017 season. This storm will continue to drift west through the Caribbean and eventually toward the Yucatan Peninsula by the early/middle part of next week.

 Tracking HARVEY

Here’s the official track for HARVEY, which shows it briefly down to tropical depression strength before becoming a tropical storm again late weekend. Over the next few days, it should drift towards the Yucatan Peninsula, but stay below hurricane status. Stay tuned…


Tracking Harvey
Despite HARVEY dropping down to tropical depression status, some models are still suggesting that HARVEY could become a hurricane over the coming days. Stay tuned…


Tracking 92L
The National Hurricane Center is also tracking another wave of energy northeast of HARVEY that has a low chance of tropical formation over the next 5 days. This storm is taking more of a northwesterly track toward the Bahamas and the southeastern part of the U.S.


Tracking 92L
Here is the strength forecast for 92L, which suggests that this storm could potentially become a tropical storm and possibly even a hurricane over the next several days.
Tracking 92L
Here are a few different model outputs for 92L as it nears the southeast coast of the U.S.. Note that a few have the storm nearing Florida, while others keep it out to sea. While it is too early to tell exactly what is going to happen yet, it is important to keep an eye on this system as it develops over the next few days.


Atlantic Outlook: Next 5 Days

Weather conditions in the Atlantic basin remain fairly active over the next few days. While HARVEY tracks west through the Caribbean, NOAA’s NHC will be tracking 2 other waves of energy east of that. Both have a low probability of tropical formation over the next 5 days.

Tracking Kenneth
Kenneth became the 11th named storm of the 2017 Eastern Pacific Hurricane Season. As of early Saturday, Kenneth was a tropical storm, but is expected to become 6th hurricane of the season.


Tracking Kenneth
Here’s the official NHC track for Kenneth, which suggests it becoming a hurricane as early as Sunday. The good news is that this storm looks to remain well out to sea and not impacting any major land masses.
 
Eastern Pacific Outlook: Next 5 Days

Other than Kenneth, the Eastern Pacific looks pretty quiet as of now with no other waves of energy having the potential of tropical development over the next 5 days.

 __________________________________________________________________________
PRELIMINARY 2017 Tornado Map

It certainly has been a fairly active first half of 2017 with 1247 preliminary tornado reports through August 18th. Note that this is the most tornadoes through August 18th since 2011, when there were 1,715 reports. The map below shows the distribution of the tornadoes so far this year.

PRELIMINARY 2017 Tornado Count

According to NOAA’s SPC, the PRELIMINARY 2017 tornado count is 1247 (through August 18th). Note that is the most active year for tornadoes since 2011, when there were 1,715 tornadoes. Keep in mind there was a major tornado outbreak in the Gulf Coast region from April 25-28, 2011 that spawned nearly 500 tornadoes, some of which were deadly. That outbreak is known as the Super Outbreak of 2011 and has gone down in history as one of the biggest, costliest and one of the deadliest tornado outbreaks in history.


_____________________________________________________________________

National Weather Hazards Ahead…

1.) Heavy rain across portions of the central Plains, the Middle and Upper Mississippi Valley, and the Great Lakes, Mon-Tue, Aug 21-Aug 22.
2.) Severe weather across portions of the Great Lakes and the Ohio Valley, Tue, Aug 22.
3.) Heavy rain across portions of the eastern Carolinas, Wed-Thu, Aug 23-Aug 24.
4.) Heavy rain across portions of Florida, Tue-Fri, Aug 22-Aug 25.
5.) Flooding possible across portions of the Central Plains and the Southern Plains.
6.) Slight risk of much above-normal temperatures for portions of the Great Basin, the Northern Plains, the Northern Rockies, California, the Pacific Northwest, and the Southwest, Sun-Fri, Aug 27-Sep 1.
7.) Moderate risk of much above-normal temperatures for portions of the Northern Rockies and the Northern Great Basin, Sun-Tue, Aug 27-Aug 29.
8.) Severe Drought across the Central Plains, the Northern Plains, Hawaii, the Northern Rockies, the Middle Mississippi Valley, California, and the Upper Mississippi Valley.

_________________________________________________________

“The West Is in the Middle of the Worst Flash Drought in Recent Memory”

“Conditions in the Great Plains are devastating farmers and ranchers. As wildfires blaze across the West, parts of Montana and the Dakotas are experiencing one of the worst droughts in recent memory. With pastures so parched that they can’t support cattle, ranchers are accepting donations of hay from wetter parts of the country and selling their animals and considering taking second jobs to get by. Farmers are also struggling. Crop harvests are a fraction of normal—the estimated yield for durum wheat in North Dakota and Montana, for example, is about half what it was last year. The current catastrophe began as a “flash drought,” a dry period that comes on very quickly. Late spring and early summer are typically pretty soggy in the northern Great Plains—but not this year, says Natalie Umphlett, regional climatologist and interim director of the High Plains Regional Climate Center at the University of Nebraska. If the region doesn’t get enough rain during that critical time, she says, “it’s hard to make that up.”

See more from MotherJones.com HERE:

(Image Credit: Andrew Cullen/High Country News Via Mother Jones)

Rain Needed to End Drought

Exceptional and Extreme drought conditions are in place over parts of Montana and North and South Dakota due to several days/week of hot and dry weather. The image below suggests how much rain would be needed to end the drought, which suggests nearly 6″ to 12″ or more!

_________________________________________________________________________

National Weather Outlook

Here’s the weather outlook through the middle/end of next week, which shows somewhat active weather conditions across parts of the central and eastern US. Scattered showers and storms will bring areas of locally heavy rain to some of these locations. Also keep in mind that some of these storms could be strong to severe.

Severe Threats: Sunday & Monday
According to NOAA’s SPC, there is a MARGINAL risk of severe storms across parts of the Midwest on Sunday and Monday. Keep in mind that a marginal risk means that while a few storms could be strong to severe, the threat isn’t expected to be very widespread. However, there could be areas of locally heavy rainfall where the thunderstorms develop over the next few days.

Excessive Rainfall Potential Sunday & Monday

According to NOAA’s WPC, there is a SLIGHT risk of excessive rain on Sunday and Monday, mainly across the Midwest and across parts of the Southwest. With thunderstorms expected to develop in these areas over the next couple of days, areas of localized flooding can’t be ruled out.

Localized Heavy Rain Threats

Excessive rainfall will be possible across parts of the Midwest and Southwest over the next few days with some 3″ to 5″+ tallies possible across the Midwest and as much as 2″ to 4″+ tallies possible in the Southwest.


________________________________________________________

Nena Springs Fire – Warm Springs, OR

The Nena Springs Fire in Warm Springs, Oregon is another large wildfire in the Western US that started on Tuesday, August 8th and has grown to more than 66,000 acres! There are nearly 300 people working on this fire, which is 40% contained. The estimated containment date is set for Wednesday, August 23rd

See more from Inciweb HERE:

Ongoing Large Wildfires

Here’s a look at the current wildfire map across the country. Continued hot and dry weather has helped to spark several wildfires across the Western US. There have even been fires popping up in the Eastern U.S., two of the larger fires are burning in Florida.

Here’s a list of all the current large wildfires from Inciweb:

National Smoke Analysis
Here’s the projected wildfire smoke concentration for midday Sunday, which suggests that smoke from wildfires burning across parts of Wesetern Canada and the Western US could continue to linger around the Northwest, Midwest and the Great Lakes Region. There also appears a very high concentration of smoke from fires burning across the Central Canada near the Hudson Bay. If you are in these areas, air quality could be a little poor, but these areas may also be enjoying very interesting looking sunrises/sunsets, which tend to look hazy or reddish-orange.
________________________________________________________________________
I’m Skeptical About This So-Called “Solar Eclipse”
By Paul Douglas
Eclipse-hype is everywhere, but it may all be one big hoax. This alleged “moon-shadow” is probably just a natural cycle. Astronomers are playing it up for the grant money. How do we know scientists aren’t getting a kick-back? I mean, all those hotels and restaurants from Oregon to Missouri to South Carolina stand to make a killing! Smells like fake news to me.
Just in case they’re right, be sure not to stare at the sun on Monday. There are no nerve endings in your eye’s retinas. You won’t feel actual pain – you’ll just go blind.
Latest weather models are a tad more optimistic about the weather on Monday. The best chance of seeing the (so-called) eclipse will come over central & northern Minnesota. Clouds and showers may overspread southern counties by afternoon. Fingers crossed.
Skies clear Tuesday as cooler, cleaner, thunder-free Canadian air drains south of the border. The first day of the State Fair should bring low 70s and comfortable dew points, but thundershowers return next weekend.
Wait, the total eclipse passes over Nashville, where Al Gore lives? I rest my case.
________________________________________________________________________
Extended Forecast

SUNDAY: Warm sun, stray t-storm. Winds: SW 7-12. High: 84

SUNDAY NIGHT: Chance for a few t-storms. Winds: W 5. Low: 63.

MONDAY: Few T-storms, especially in southern MN. Risk of an eclipse. Winds: E 5-10. High: 80.

TUESDAY: Clearing, breezy and less humid. Winds: NW 10-15. Wake-up: 59. High: 76.

WEDNESDAY: Sunny & pleasant. Less wind. Winds: NW 7-12. Wake-up: 57. High: 75.

THURSDAY: Mix of clouds and sun, comfortable. Winds: E 5-10. Wake-up: 56. High: 75.

FRIDAY: Partly sunny. T-storm possible late. Winds: SE 7-12. Wake-up: 61. High: 77.

SATURDAY: Scattered showers and storms. Winds: SE 7-12. Wake-up: 61. High: 77.
_______________________________________________________

This Day in Weather History
August 20th

1904: Both downtown Minneapolis and St. Paul are hit by tornadoes, producing the highest official wind ever recorded in Minnesota over one minute (110 mph in St. Paul).
________________________________________________________

Average High/Low for Minneapolis
August 20th

Average High: 80F (Record: 97F set in 1972)
Average Low: 62F (Record: 40F set in 1950)

Record Rainfall: 2.23″ set in 1891
_________________________________________________________

Sunrise/Sunset Times for Minneapolis
August 20th

Sunrise: 6:21am
Sunset: 8:10pm

Hours of Daylight: 13hours & 49mins

Daylight LOST since yesterday: ~2 minutes and 51 seconds
Daylight LOST since summer solstice (June 20th): ~1 hours & 48 minutes
__________________________________________________________

Moon Phase for August 20th at Midnight
0.5 Days Before New Moon

_________________________
Weather Outlook For Sunday

Sunday will be a fairly warm and sticky day across the region with temperatures warming into the upper 70s and lower/middle 80s. Note that ahead of the front, dewpoints will warm into the mid/upper 60s, which will feel quite humid compared to what we’ve been dealing with so far this month.

Weather Outlook For Sunday
A frontal boundary moving through the state will be responsible for a wind shift through the day. Winds ahead of the front will be from the SSW, while winds behind the front will switch to the WNW. This wind shift will help to bring in less humid air as we head into the early part of the week.


Weather Outlook For Sunday

While rain and thunder threats don’t look to be all that impressive, there could be a few isolated showers and storms during the afternoon, some of which could be a little on the strong to severe side across southern Minnesota.


UV Index for Sunday – HIGH

The UV Index for Sunday will be HIGH, which means that it will only 20 to 30 minutes or less to burn unprotected skin. With that said, if you are planning on spending any extended length of time outside, make sure you wear appropriate attire and lather on the sun block!

__________________________________________________________________________

Minneapolis Temperature Outlook

Here’s the temperature outlook through September 3rd, which shows temps warming into the low/mid 80s through Monday with some sticky dewpoints. However, temperatures look to get back to the 70s starting Tuesday and could stay there through the early part of September. Keep in mind that the average high in the Twin Cities on August 20th is 80F and falls to 77F by early September. With that said, we could stay below average for a number of days as we head through the end of August and the early part of September.

6 to 10 Day Temperature Outlook

According to NOAA’s CPC, the extended temperature outlook from August 24th to August 28th suggests cooler than average temperatures will settled back in across much of the Midwest and Great Lakes with the coolest spots near the Ohio Valley.


___________________________________________________________

Extended Temperature Outlook

According to NOAA’s CPC, the extended temperature outlook through August 28th shows that a good chunk of the Central and Eastern U.S. will be cooler than average, but warmer than average temps look to continue across the Western U.S..

Extended Temperature Outlook

Here’s the extended 850mb temperature anomaly loop into the early part of last week of August. This describes how warm or cold (from average) mid/low level temperatures will be over time. Note that the cooler blues look to move back in across much of the Central and Eastern US, while the warmer reds/oranges look to develop across the Western US once again.


____________________________________________________________

Weather Outlook Ahead

The weather outlook over the next couple of days shows somewhat unsettled weather developing in the Central part of the country through the early week time frame. Keep in mind that some of the storms there could be strong to severe with locally heavy rainfall. The other area that will see areas of heavy rain will be near the Four Corners Region, especially in New Mexico.

5 Day Precipitation Outlook

According to NOAA’s WPC, the next several days could produce areas of locally heavy rainfall across the Midwest and the Southwest with some 2″ to 4″+ tallies possible. There could also be some 1″ to 2″+ tallies possible across the Great Lakes, eastern Carolinas and even across parts of Florida. Keep in mind that with this much rain expected to fall in spots, localized flooding can’t be ruled out.


___________________________________________________________________

“Forecasters put the total solar eclipse into a weather model and the result is amazing”
The weather wizards at the National Oceanic and Atmospheric Administration (NOAA) have added the effects of the Aug. 21 total solar eclipse to one of their newest, highest-resolution computer models. The result is a gorgeously detailed view of how the eclipse will cause a decrease in incoming solar radiation as it crosses the country on Monday, from the Pacific Northwest to the Southeast. Scientists at a NOAA laboratory in Boulder, Colorado added the eclipse’s path to a computer model known as the “High-Resolution Rapid Refresh” or “HRRR” model. They released a simulation of the eclipse on Thursday, and starting  Saturday, the model will start incorporating the eclipse in its real-time forecasts. In a simulation using the weather on August 4, the researchers found that the eclipse will primarily affect temperatures by cooling a widespread area of the country by up to 7.2 degrees Fahrenheit. Such areas will experience a partial eclipse.  For the 70-mile-wide swath of the nation that will experience a total solar eclipse, the temperature impacts will be more significant, the model projects. Along the path of the full eclipse, the model shows that temperatures will drop between 5 and 12 degrees Fahrenheit.
(Total solar eclipse simulation for incoming solar radiation, showing the blue circle of the eclipse in the central part of the country.IMAGE: NOAA/ESRL)

__________________________________________________________________
“Not Just Blowing Smoke: Satellites Play Vital Role in Spotting, Monitoring Fires”
“Fires, whether naturally occurring or man-made, have substantial impacts on both the landscape and air quality. Fortunately, satellites can detect and monitor fires large and small, and provide data on a range of factors, including location, duration, size, temperature and intensity. Unlike ground-based observation tools, which can yield incomplete information about fires, satellites can detect and monitor fires large and small, and provide data on a range of factors, including location, duration, size, temperature and intensity. Further, satellites can track blazes in near real time, provide data for air quality models and help distinguish the air-quality impact of fires versus those from other sources of pollution.”
(This GOES-16 geocolor imagery captured on May 7 shows smoke plumes from several fires burning in the southeastern United States, including the West Mims Fire, the majority of which lies in the Okefenokee National Wildlife Refuge. As of May 9, 2017, the fire was estimated at 140, 409 acres. [Note: GOES-16 data are currently experimental and under-going testing and hence should not be used operationally.])
 

______________________________________________________

“Study: For parts of the world, perpetual drought is a possibility”
“Last year’s record-shattering drought may finally be over for Californians, but a new study suggests that in some parts of the world, drought could become the new normal. The analysis, published Thursday in the journal Nature, found that during the 20th century, droughts took progressively longer for ecosystems to recover from – a grim trend that is predicted to worsen. The 19-person research team was led by Christopher Schwalm, a scientist at the Woods Hole Research Center in Falmouth, Mass., and received funding from the National Science Foundation and NASA. According to Schwalm, the study uses satellites to estimate gross primary productivity, an indicator of “how much stuff plants synthesize.” This data was matched against the researchers’ projections, which had been extrapolated as far back as 1901 – well before satellites had been invented – to get a dataset spanning 110 years.”

__________________________________________________________________

“VOLCANOES UNDER ANTARCTICA FOUND BY SCIENTISTS, CLIMATE CHANGE COULD TRIGGER ERUPTION”
“Over 90 volcanoes under Antarctic were recently discovered by scientists. The volcanoes, lurking beneath the ice, have scientists wondering about the potential for an eruption. With the highest over 13,000 feet, the network of volcanoes under Antarctica sits quietly about two miles below the surface. Making up the largest volcanic region on Earth, the 91 previously unknown volcanoes stretch 2,100 miles along the western edge of the continent. The team of scientists, led by glacier expert Robert Bingham, fears any eruptions could adversely affect Antarctica’s vast ice sheets, causing them to melt and fall into the sea. The addition of new water into the Antarctic Ocean would certainly result in significantly higher sea levels worldwide, according to Bingham. Yet, the research team has a much bigger concern. Earth science experts have determined that glaciers covered the most active volcano regions in the world, like Alaska and Iceland, during the last ice age. Once the climate changed and the ice receded, the areas became alive with activity.”
(Image Credit: Inquisitr)
 

___________________________________________________________

“NASA: July 2017 Didn’t Even Need an El Niño to Tie For Hottest July in Recorded History”
“Good news, everyone! The Earth is still like a car with the windows rolled up, and it doesn’t seem like anyone is coming by with the keys anytime soon. July 2017 is statistically tied with July 2016 for the title of hottest July in 137 years of records, Mashable reported, which is especially concerning because there was no El Niño—a complicated climate cycle in which the central and eastern tropical Pacific Ocean floods with warmer than usual water, and raises the average temperature across the globe. According to a NASA press release, July 2017 was 1.49 degrees Fahrenheit (0.83 degrees Celsius) warmer than the 1951 to 1980 baseline average, beating out July 2016 by an incredibly slim margin. El Niño was ongoing in 2016, which means that this year’s July was able to match a predecessor with extra help. Alarmingly, NASA noted “all previous months of July were more than a tenth of a degree cooler.” 
(Image Credit: AP via Gizmodo.com)
 

_______________________________________________________

“Lessons from the storm: Effects of extreme weather linger more among children and older adults”
“Ruth Bennett woke up at 1 a.m. and looked through the doorway of her independent living apartment in Walker, about 20 miles west of Baton Rouge. It was Aug. 13, 2016, and rain had been pouring down for two days. Bennett was worried about her car flooding. She saw water creeping up to the parking lot, but her car looked safe. She crawled back into bed. Two hours later, one of the employees of Southern Pines Retirement Community was pounding on Bennett’s door. Not only had Bennett’s car flooded, the facility was surrounded by water. The employee told Bennet to grab what she needed, including her medicine. “In two hours it had come from nothing,” Bennett recalled recently. “It was very frightening, especially when you’re old.” The elderly and children are among the most vulnerable populations to extreme weather events. That’s in part because they often do not have the ability to mobilize quickly or on their own, and they’re at a greater risk physiologically and psychologically. These trends were noticeable in the aftermath of Hurricane Katrina.”

_______________________________________________________________

Thanks for checking in and don’t forget to follow me on Twitter @TNelsonWX