.png)
.gif)
.png)
__________________________________________________________________________
____________________________________________________________________________
Stingy Sierra Snow Pack – Drought Looming?
(Image courtesy: NOAA – January 28, 2017 vs. February 8, 2018)
.jpg)
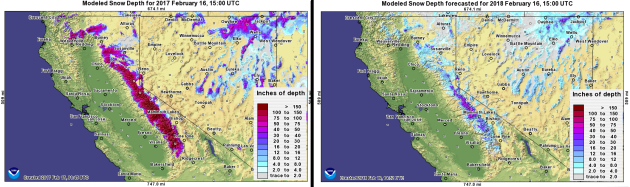
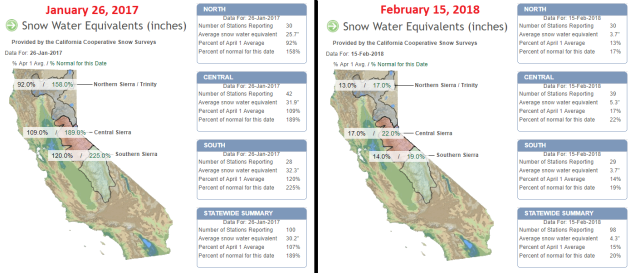
Dramatic Difference January 2017 vs February 2018
What a difference a year makes. Thanks to the Department of Water Resources at CA.gov for the images below, which show the snow to water equivalent from January 2017 to February 2018. Last year, the average water equivalent was 30.2″, while the water equivalent right now is only 4.3″!! Keep in mind that the Sierra snow, typically supplies ~30% of California’s state water needs, so it is a VERY important water source that is lacking significantly this year.
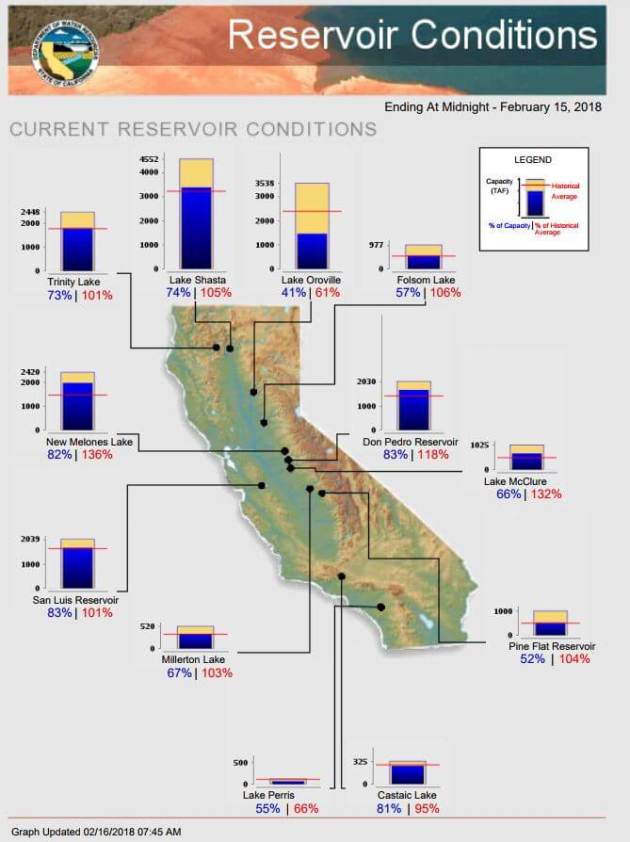
Current Reservoir Levels
According to CA.gov, the reservoir levels across much of the state are actually doing ok! Last year’s blockbuster year helped fill most reservoirs to adequate levels. Most reservoirs shown below are sitting at more than 100% of their historical average, but with growing concerns of scant Sierra snow this winter, we’ll likely cut into these reservoir surpluses fairly rapidly into 2018.
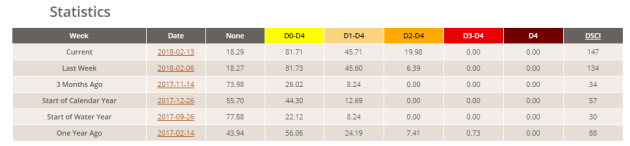
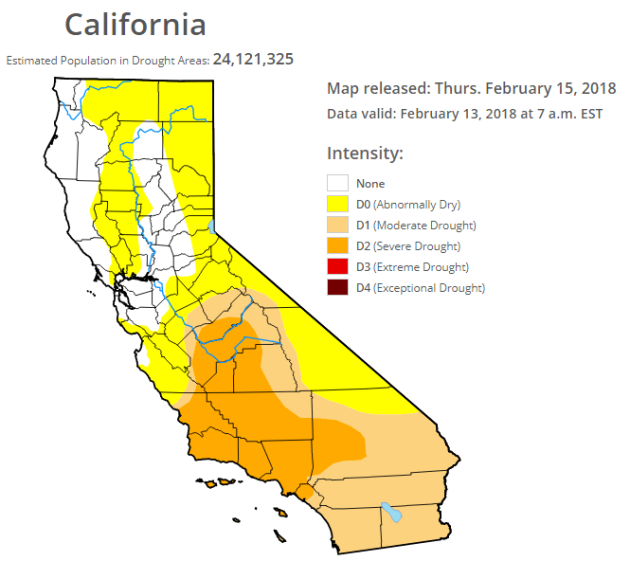
California Drought
According to the US Drought Monitor, drought conditions have been worsening over the last several weeks due to the lack of rain and snow. Note that the severe drought category has risen from 0% to ~20% over the last 3 months. Moderate drought conditions have also risen from ~8% to ~46% over that 3 month period as well.
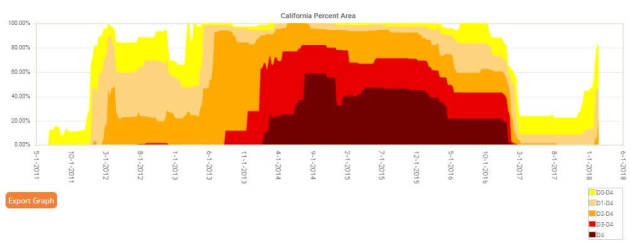
California Drought Timeline
The significant multi-year California drought impacted much of California from 2012 to late 2016. It was significantly worrisome during late 2013 to late 2016 before the “Atmospheric Rivers” and heavy rounds of Pacific moisture really started showing up during the winter of 2016/2017. As of now, the drought is nowhere near where it was during the multi-year drought phase, but latest data suggests that California is rapidly drying out again.
_______________________________________________________________________________
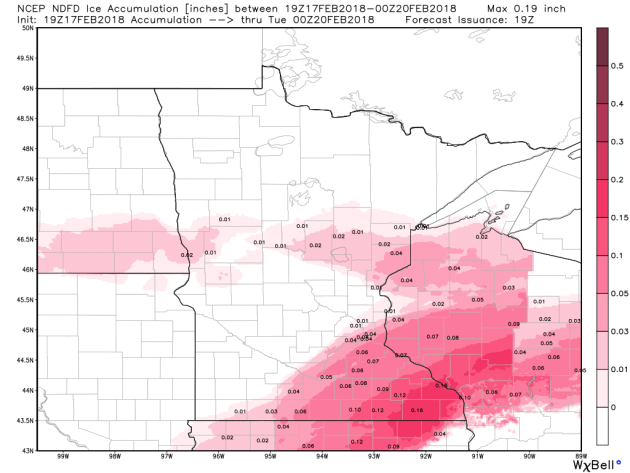
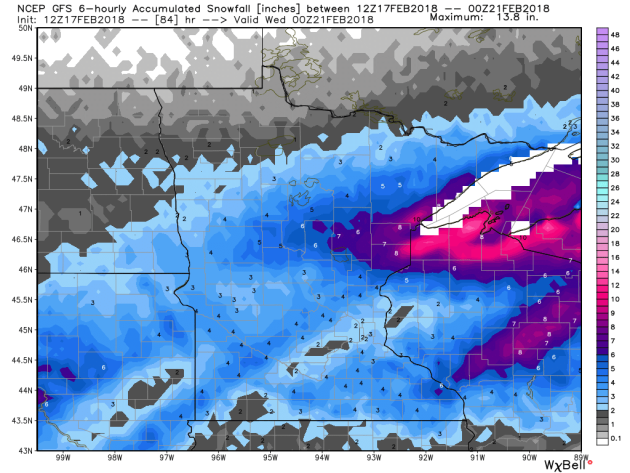
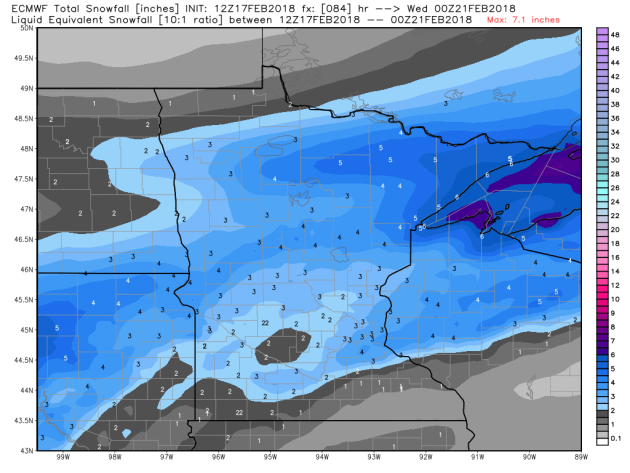
1.) Heavy precipitation across portions of the Great Lakes and the Upper Mississippi Valley, Mon, Feb 19.
2.) Heavy rain across portions of the Central Plains, the Lower Mississippi Valley, the Central Appalachians, the Tennessee Valley, the Great Lakes, the Middle Mississippi Valley, the Northeast, the Southern Plains, and the Ohio Valley, Mon-Tue, Feb 19-Feb 20.
3.) Heavy rain across portions of the Lower Mississippi Valley, the Tennessee Valley, the Middle Mississippi Valley, the Southern Appalachians, the Southeast, the Southern Plains, and the Ohio Valley, Wed-Thu, Feb 21-Feb 22.
4.) Flooding possible across portions of the Lower Mississippi Valley, the Central Appalachians, and the Ohio Valley.
5.) High winds across portions of the Central Plains, the Central Rockies, the Central Great Basin, the Southern Rockies, the Southern Plains, and the Southwest, Mon, Feb 19.
6.) Much below normal temperatures across portions of the Central Great Basin, the Northern Plains, the Northern Rockies, the Central Rockies, California, the Northern Great Basin, the Pacific Northwest, and the Southwest, Tue-Wed, Feb 20-Feb 21.
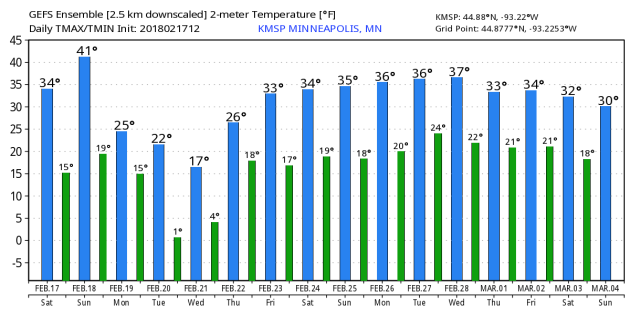
7.) Much below normal temperatures across portions of the Central Plains, the Upper Mississippi Valley, the Northern Plains, and the Northern Rockies, Mon-Fri, Feb 19-Feb 23.
8.) High winds across portions of mainland Alaska, Mon-Wed, Feb 19-Feb 21.
9.) Much above normal temperatures across portions of mainland Alaska, Mon-Wed, Feb 19-Feb 21.
Slight risk of much below normal temperatures for portions of the Central Plains, the Central Great Basin, the Northern Plains, the Northern Rockies, the Central Rockies, the Middle Mississippi Valley, California, the Northern Great Basin, the Upper Mississippi Valley, the Alaska Panhandle, the Pacific Northwest, and the Southwest, Sat-Fri, Feb 24-Mar 2.
10.) Slight risk of much above normal temperatures for portions of mainland Alaska and the Aleutians, Sat-Mon, Feb 24-Feb 26.
11.) Moderate risk of much below normal temperatures for portions of the Central Great Basin, California, and the Southwest, Sat-Sun, Feb 24-Feb 25.
12.) Moderate risk of much below normal temperatures for portions of the Central Plains, the Northern Plains, the Northern Rockies, and the Northern Great Basin, Sat-Fri, Feb 24-Mar 2.
13.) Slight risk of heavy precipitation for portions of the Central Plains, the Lower Mississippi Valley, the Tennessee Valley, the Middle Mississippi Valley, the Southern Appalachians, the Southeast, the Southern Plains, and the Ohio Valley, Sat-Mon, Feb 24-Feb 26.
14.) Severe Drought across the Central Plains, the Central Rockies, the Lower Mississippi Valley, the Central Great Basin, the Northern Plains, the Southern Rockies, the Middle Mississippi Valley, California, the Southern Plains, and the Southwest.
.png)
___________________________________________________________________________
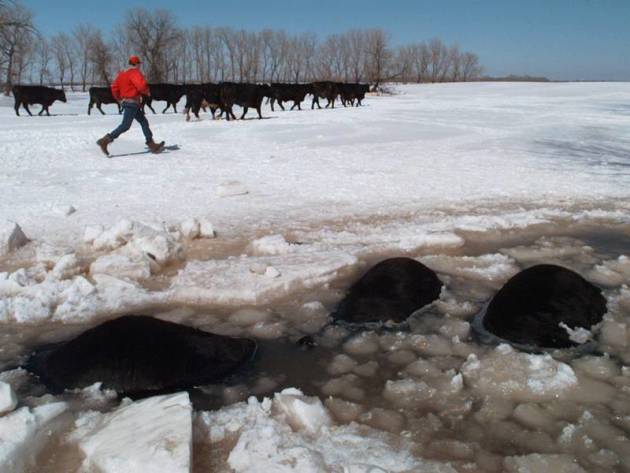
Ice Safety!!