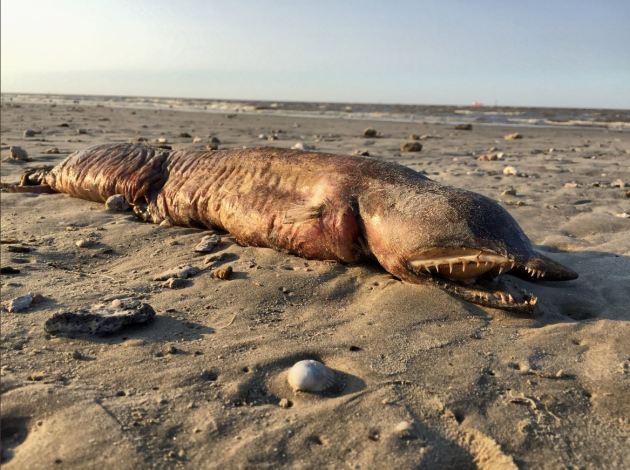
“A mystery sea creature that washed ashore in Texas during Hurricane Harvey has been identified thanks to a biologist and a viral tweet.
After Harvey, National Audubon Society social media manager Preeti Desai posted a tweet asking for help identifying a elongated, fanged sea creature whose body appeared on a beach in Texas City. People suggested that she contact Museum of Natural History biologist and eel expert Kenneth Tighe, who determined the specimen was likely a fangtooth snake-eel (Aplatophischauliodus).
“It was completely unexpected, it’s not something that you’d typically see on a beach. I thought it could be something from the deep sea that might have washed on to shore,” Desai told the BBC. “My main reaction was curiosity, to figure out what the heck it was.””
(Image Credit: @preetalina via Twitter)
_______________________________________________________________________
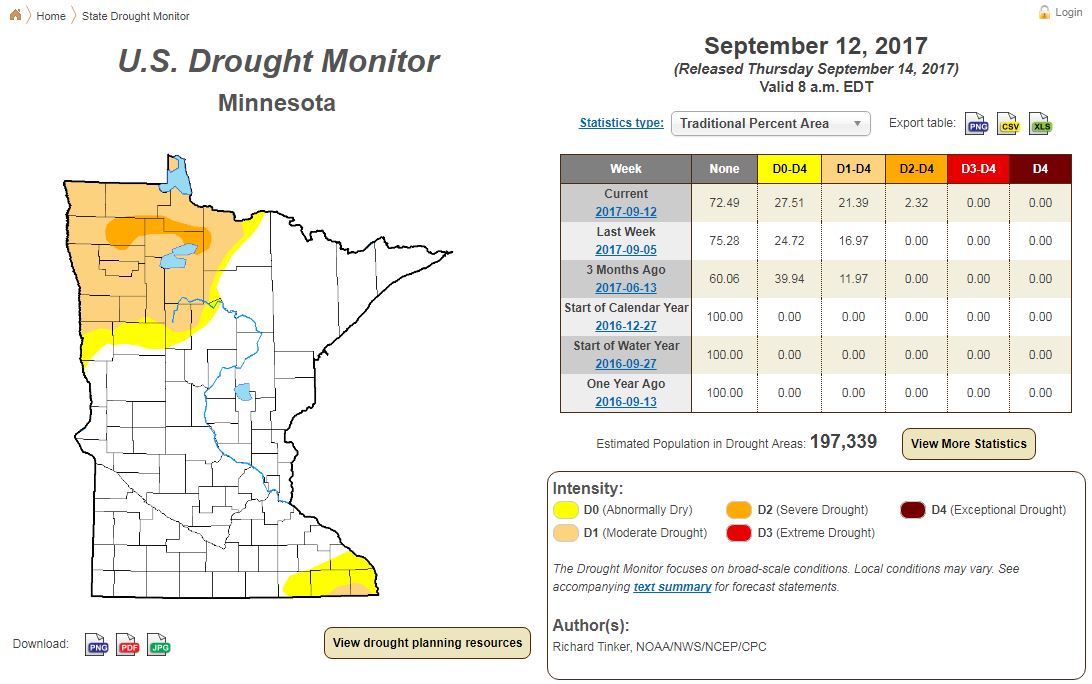
Minnesota Drought Conditions
According to the US Drought Monitor, nearly 2% of the state is considered to be in a SEVERE drought, which is located in the northwestern part of the state. Also note that nearly 21% of the state is considered to be in a MODERATE drought.
_________________________________________________________________________
La Nina Watch Issued by NOAA
Uh oh… grease up your shovels… get that wood pile ready… we cold be in for a colder and snowier winter! According to NOAA, the water temperature in the Eastern Pacific is beginning to cool and has been over the last couple of months. This trend may continue, which could lead right into a La Nina Winter! In fact, NOAA has issued a La Nina watch for the fall and winter 2017-18!!
“There is an increasing chance (~55-60%) of La Niña during the Northern Hemisphere fall and winter 2017-2018.”
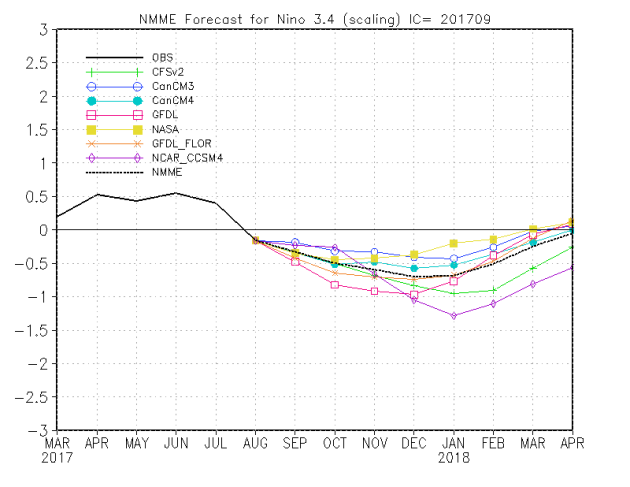
“In mid-September 2017, the tropical Pacific remained in an ENSO-neutral state, although SSTs in the east-central tropical Pacific have cooled to near the threshold for La Niña while the atmosphere continues to maintain largely ENSO-neutral patterns. The collection of latest ENSO prediction models indicates coolish ENSO-neutral or weak La Niña as two possible scenarios during Northern Hemisphere fall and winter. The official CPC/IRI outlook slightly favors La Niña development, and carries a La Niña watch.”
Historically Speaking
**El Niño and La Niña events tend to develop during the period Apr-Jun and they
Tend to reach their maximum strength during October – February
**Typically persist for 9-12 months, though occasionally persisting for up to 2 years
**Typically recur every 2 to 7 years
See more from iri.columbia.edu HERE:
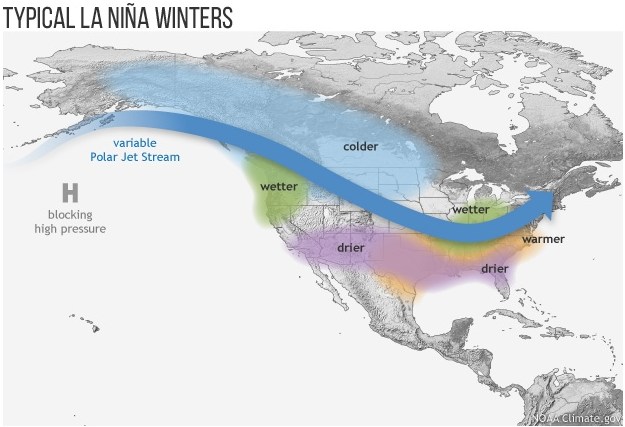
So what does this mean? Well, if La Nina does develop, the northern tier of the nation could be colder and snowier this upcoming season, while drier and warmer conditions may be found across the southern tier of the nation…
 _________________________________________________________________
Tracking JOSE
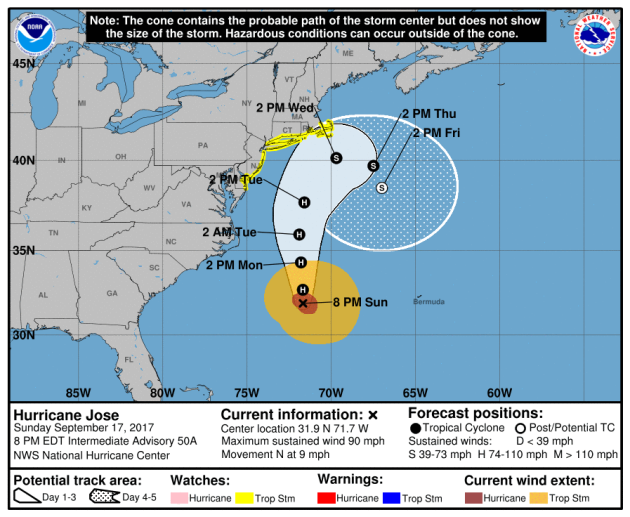
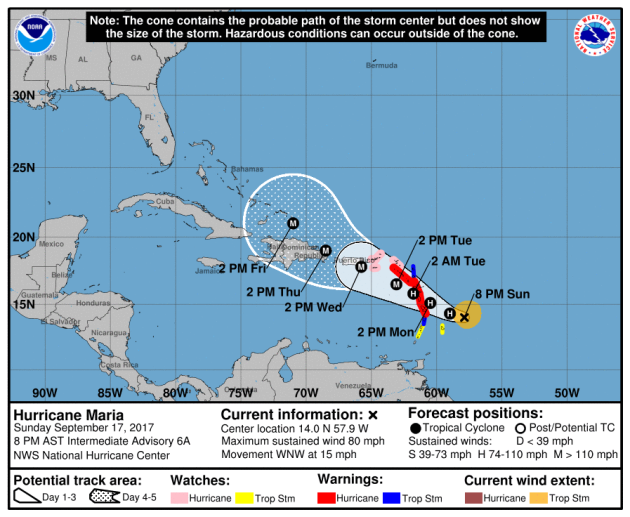
We’re still tracking JOSE in the Atlantic basin and unfortunately, JOSE could become more of a story as we head into the week ahead. According to NOAA’s NHC, JOSE was a category 1 hurricane with sustained winds of 90mph midday Sunday with a track that looks to take it precariously close to the East Coast into the week ahead.
.gif)
Tracking JOSE
Here’s the official track from NOAA’s NHC, which show the storm generally lifting north-northeast through the week ahead, but note the “cone of uncertainty” fanning out over the next several days. This means that there is still some uncertainty on where JOSE will actually track and could actually be a little closer to the East Coast, which would mean bigger impacts for the Northeast. However, Tropical Storm Watches have now been issued from the Delmarva Peninsula to southeastern Mass. and the Cape in advance of JOSE.
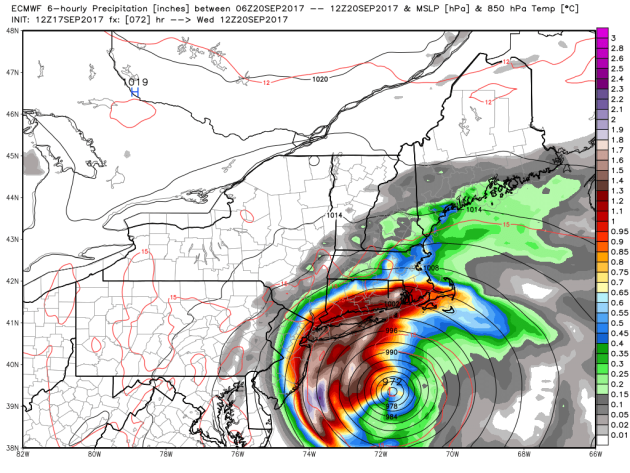
Tracking JOSE – GFS (American Model)
Tracking JOSE – Strongest Wind Gusts AM Wednesday
.png)
________________________________________________________
.png)
.gif)
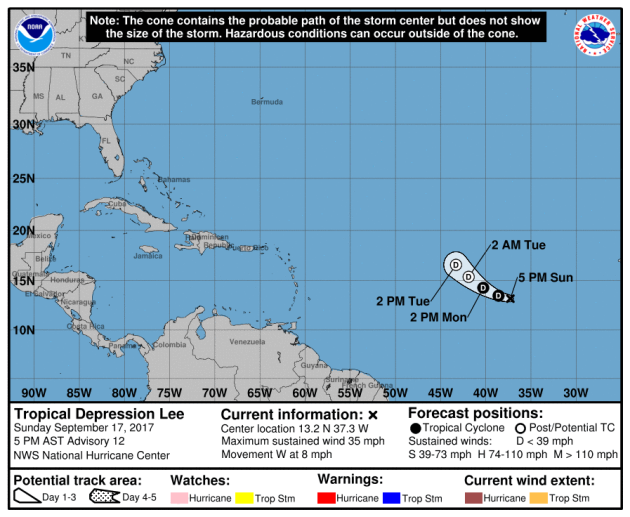
Tracking LEE
__________________________________________________________
.png)
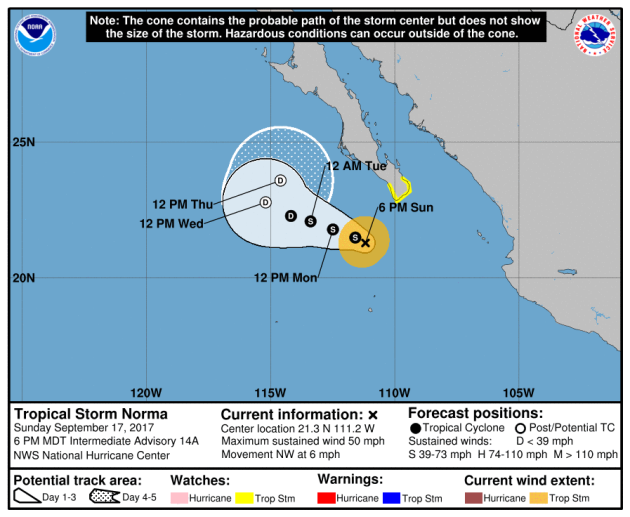
TRACKING NORMA
.gif)
Tracking NORMA
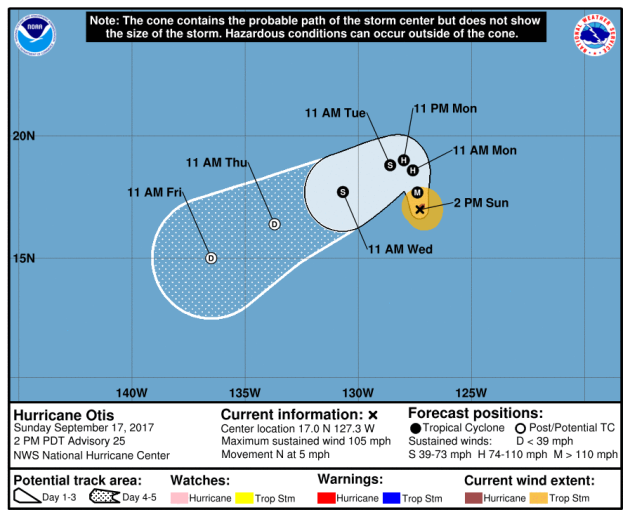
Tracking OTIS
___________________________________________________
___________________________________________________________
It certainly has been a fairly active first half of 2017 with 1366 preliminary tornado reports through September 16th. Note that this is the most tornadoes through September 16th since 2011, when there were 1,782 reports. The map below shows the distribution of the tornadoes so far this year.
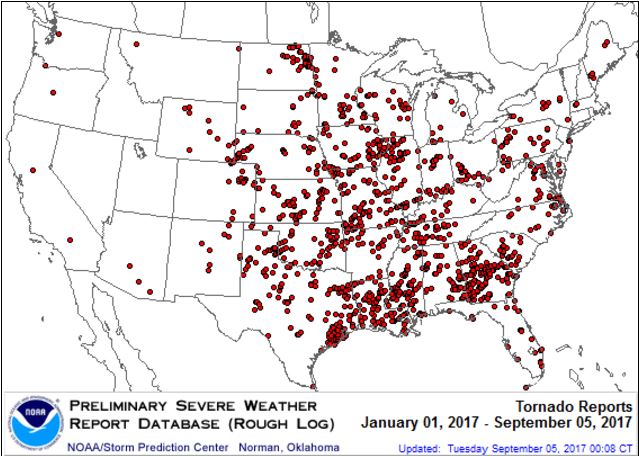
PRELIMINARY 2017 Tornado Count
According to NOAA’s SPC, the PRELIMINARY 2017 tornado count is 1366 (through September 16th). Note that is the most active year for tornadoes since 2011, when there were 1,782 tornadoes. Keep in mind there was a major tornado outbreak in the Gulf Coast region from April 25-28, 2011 that spawned nearly 500 tornadoes, some of which were deadly. That outbreak is known as the Super Outbreak of 2011 and has gone down in history as one of the biggest, costliest and one of the deadliest tornado outbreaks in history.
.png)
_____________________________________________________________________
National Weather Hazards Ahead…
1.) High winds shifting north from the Outer Banks to New England, Mon-Wed, Sep 18-20.
2.) Significant waves shifting north from coastal parts of the Outer Banks to New England, Mon-Wed, Sep 18-20.
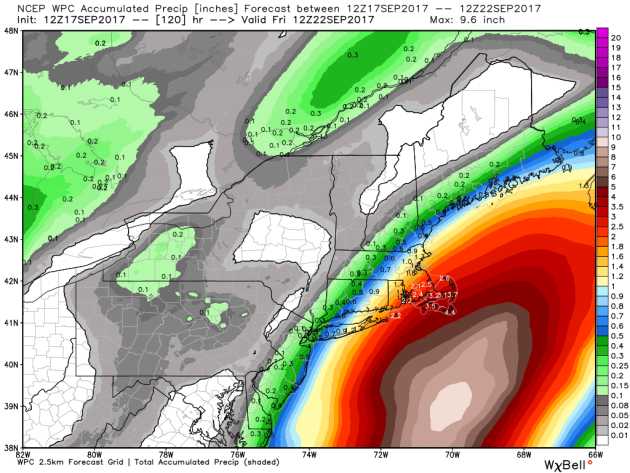
3.) Heavy rain for portions of Long Island and southeast New England, Tue-Wed, Sep 19-20.
4.) Much below-normal temperatures for parts of the Pacific Northwest, Great Basin, and the northern and central Rockies, Mon-Fri, Sep 18-22.
5.) Periods of heavy snow for parts of the northern Rockies, Mon-Wed, Sep 18-20.
6.) Periods of heavy rain for parts of the Pacific Northwest, Mon-Wed, Sep 18-20.
7.) Severe weather for parts of the northern and central Great Plains, Tue, Sep 19.
8.) Flooding occurring or imminent across parts of Florida.
9.) Flooding possible across parts of the Florida Peninsula.
10.) A slight risk of much below-normal temperatures for parts of the western U.S., Sat-Sun, Sep 23-24.
11.) Severe drought across parts of the northern Rockies, northern and central Great Plains, Corn Belt, Minnesota, Rio Grande Valley, and Hawaii.
.png)
_________________________________________________________
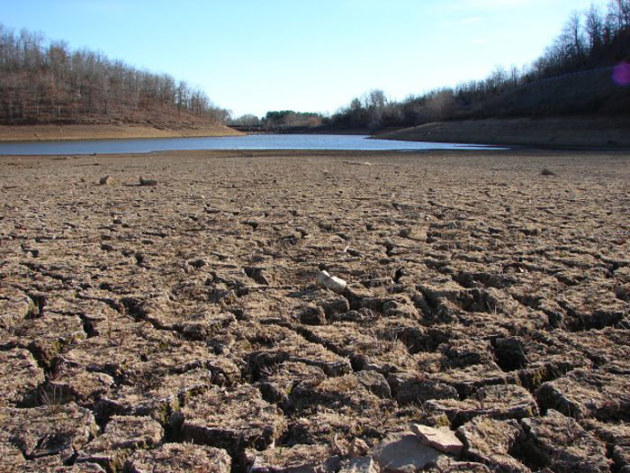
“Better late than never as rainfall hits drought-stricken Montana”
“Precipitation fell in Montana this week with nearly three-quarters of the state in severe drought, bringing welcomed assistance to firefighting crews who’ve worked through a historically tough summer. In northeastern Montana, where exceptional drought covers 25 percent of the state, the moisture isn’t enough to reverse crop losses this season. But ag producers are happy to see Mother Nature join the fight against wildfires. “We are thankful for any moisture we receive at this point, particularly for the fire danger relief,” said Shelley Mills, Montana State University Extension Ag Agent for Valley County. “Tension has been high for all residents in this area due to the extreme fire danger we have been experiencing.”According to the U.S. Drought Monitor, the entire state is experiencing less-than-normal moisture, with the vast majority in some level of drought.”
See more from Billings Gazette HERE:
(Image Credit: Casey Page Via Billings Gazette)

“Drought Conditions Continue For Montana, Relief Possible”
“More than 1.5 million acres in Montana have burned in recent weeks, both on public and private lands, and firefighters could see a break soon. The Pacific Northwest has seen more than 60 active wildfires in nine western states in recent weeks, according to the National Interagency Fire Center (NIFC). Currently, 20 of those are in Montana alone. Firefighters could soon see a break. Snow is expected to fall in the area, bringing moisture to the drought-stricken area. “We’re expected to get a little bit of moisture this week and form a rain on the Plains,” said Randy Nemetz from Northern Ag Radio Network. The summer-long drought created the perfect tinderbox for wildfires. According to the latest U.S. Drought Monitor, half of the state is in the combined categories of D-3 and D-4 drought, the direst conditions.”
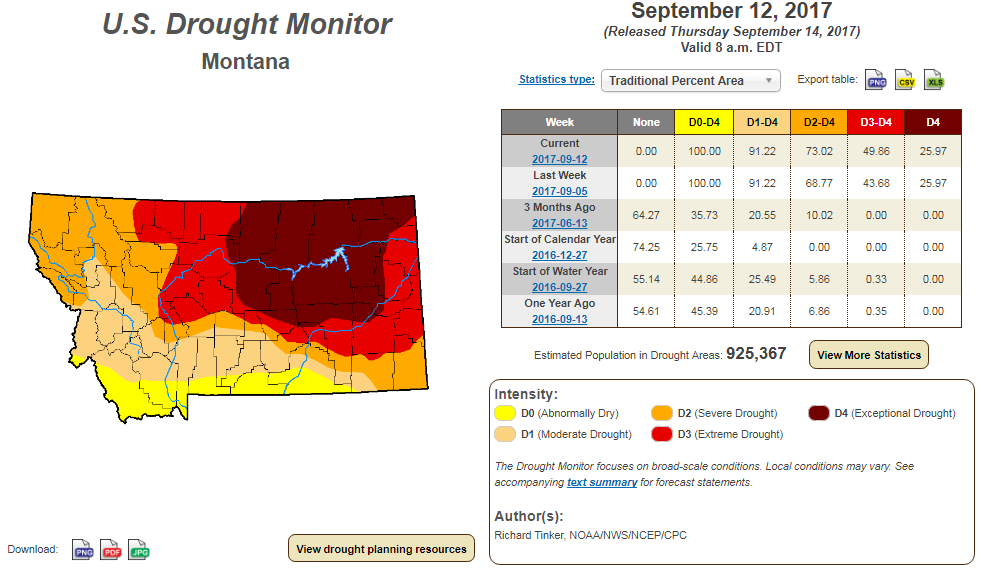
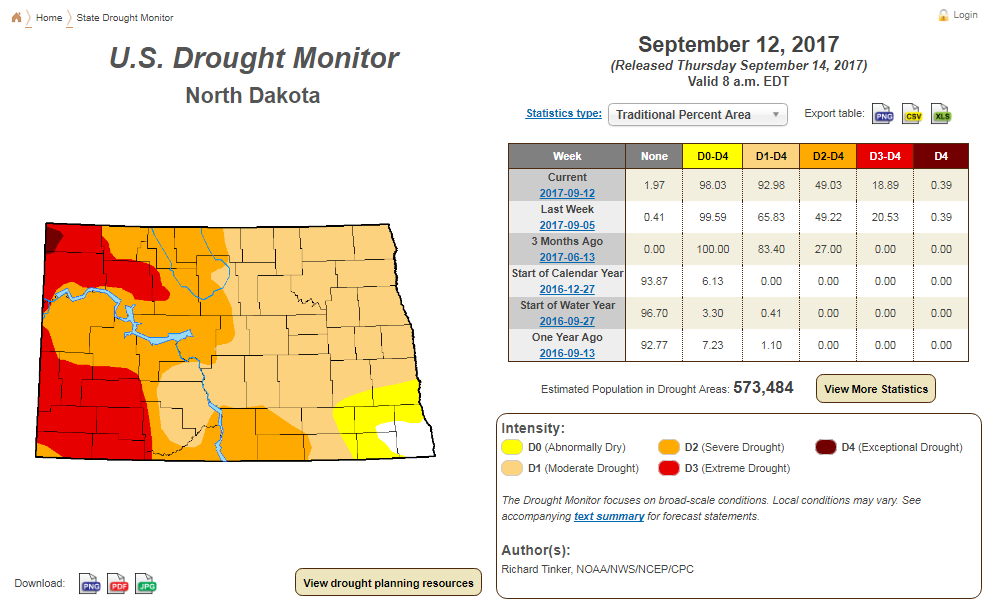
Latest Drought Monitor
Here’s the latest drought update from the US Drought Monitor, which shows EXCEPTIONAL drought conditions continuing across parts of Montana. Note that 100% of the state is considered to be in drought conditions, but the EXCEPTIONAL drought covers nearly 26% of the state. In North Dakota, less than 1% is in an EXCEPTIONAL drought, but nearly 19% of the state is still in an EXTREME drought.
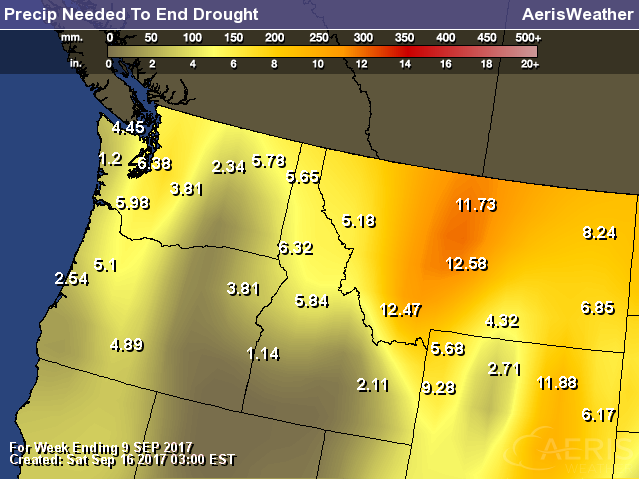
Rain Needed to End Drought
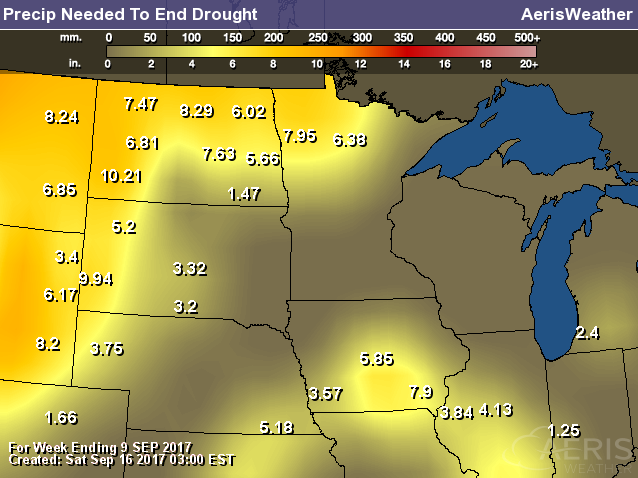
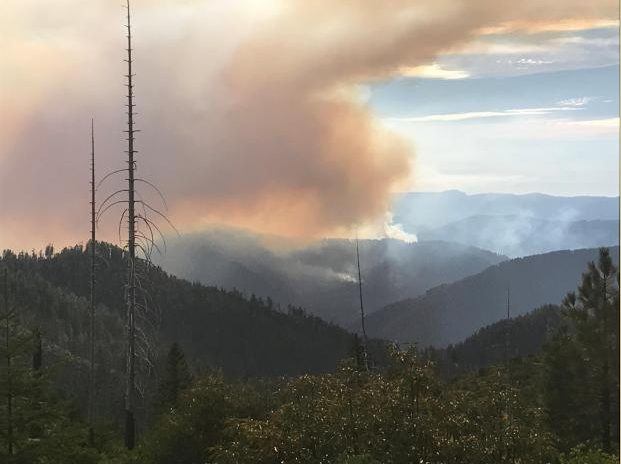
Chetco Bar Fire – 5 Miles Northeast of Brookings, OR
The Chetco Bar Fire near Brookings, Oregon is a very large wildfire in the Western US that started on Wednesday, July 12th by lightning and has grown to more than 189,000 acres! There are nearly 1,700 people working on this fire, which is 43% contained. The estimated containment date is set for Sunday, October 15th.
“Incident Summary: Chetco Bar Fire was reported on July 12, 2017. It is burning in the 2002 Biscuit Fire and 1987 Silver Fire scars located in the Kalmiopsis Wilderness, between Brookings, Oregon on the West and Cave Junction on the East. The area is comprised of mixed conifer and deciduous forest, brush and snags from the previous fires. The fire is burning in areas of fire scar and islands that were previously unburned. The combination of down, dead fuels with a newly cured grass makes the terrain quite hazardous for firefighters.”
(Close view fo smoke from the Indigo Fire, September 13. Snags from the Biscuit Fire are in the foreground. The fire is located 6 miles south of Bear Camp near the Josephine County line.)
 Diamond Creek Fire – Mazama, Washington
The Diamond Creek Fire near Mazama, Washington is a very large wildfire in the Western US that started on Sunday, July 23rd and has grown to more than 127,000 acres! There are nearly 264 people working on this fire, which is 30% contained. The estimated containment date is set for Sunday, October 15th.
“Fire Location: Diamond Creek Fire is burning within the Pasayten Wilderness and Eightmile drainage approximately 11 air miles north of Mazama, Washington. Smokejumpers responded to the fire within the first 1 1/2-2 hours of it being reported. However, due to extreme terrain, heavy dead and down timber, and critical fire weather conditions, the fire was unable to be contained on initial response. The fire crossed the Canadian Border on August 29.”
(A crew builds a handline through rocky topography south of Setting Sun Mountain)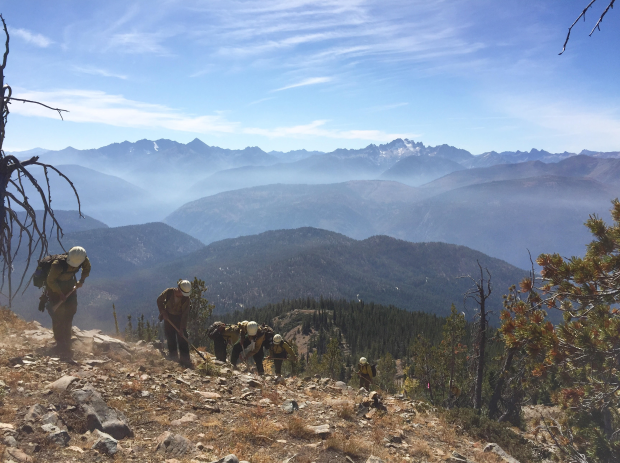
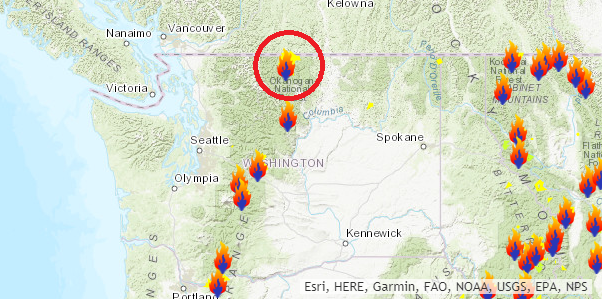
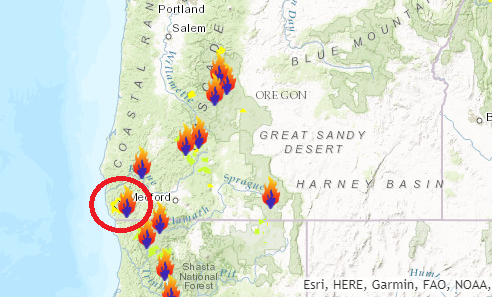
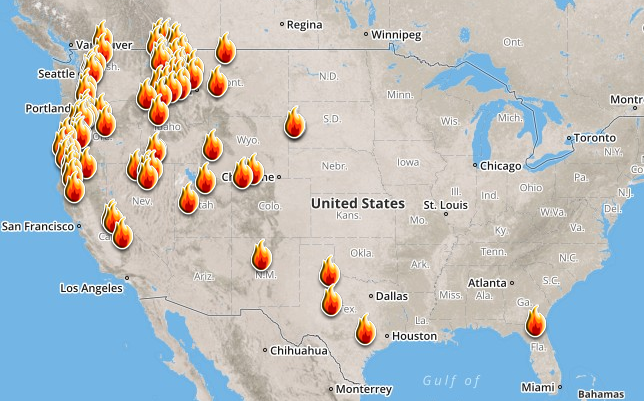
Ongoing Large Wildfires
Here’s a look at the current wildfire map across the country. Continued hot and dry weather has helped to spark several wildfires across the Western US. There have even been fires popping up in the Eastern U.S., two of the larger fires are burning in Florida.
Here’s a list of all the current large wildfires from Inciweb:
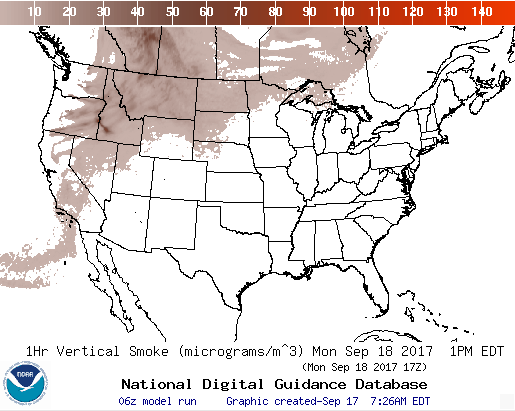
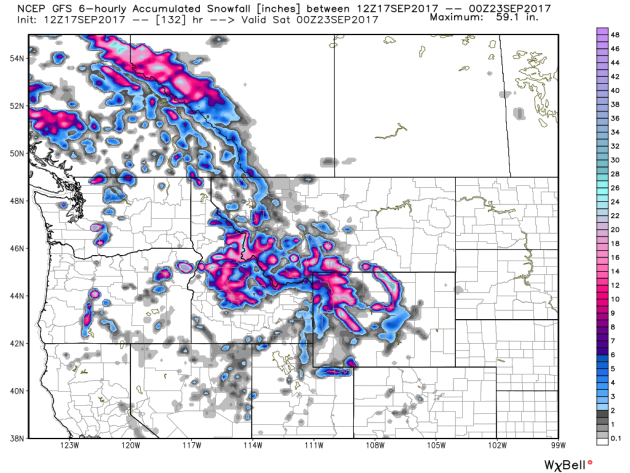
National Weather Outlook
Here’s the weather outlook through the early part of the week, which shows a cool front stalling across the central part of the country. This will keep the threat of scattered showers and storms ni place with areas of locally heavy rain. Another storm will move into the Pacific Northwest early next week, which will bring another round of much needed precipitation to areas there. It will also come with another surge of cooler air, which will help to bring another round of snow to the higher elevations. The progressive pattern will then lead to more storms across the Midwest through the early week time frame, which could lead to a few strong to severe storms. Also note JOSE, the tropical system in the Atlantic approaching the East Coast as we head into the early week time frame. This will bring heavy rain, wind and storm surge to places there.
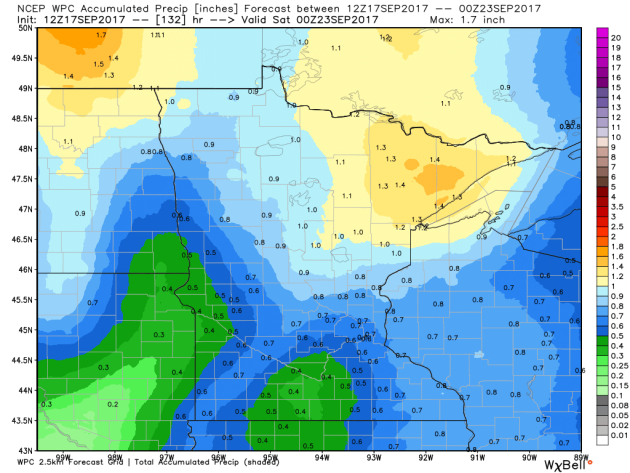
.gif)
According to NOAA’s WPC, the next several days could produce areas of locally heavy rainfall across parts of the Central and Northwestern US. It looks like we get into a much more progressive pattern, so there will be more moisture potential across the northern tier of the nation as we head into the next several days. Note that some in the Cascades could see up to 3″ to 6″+ of liquid, some of while could fall in the form of snow in the higher elevations. Also note the heavy rain potential moving into the Northeast Coast, which would be associated with JOSE.
.gif)
By Paul Douglas
_______________________________________________________
This Day in Weather History
September 18th
1997: An F3 tornado destroys several buildings and damages numerous others. Hundreds of trees are knocked down. A number of cattle are also killed in a collapsed barn. One man is injured when the tornado engulfs his car and throws it into a nearby woods. A second man is critically injured when his garage collapses, then dies several weeks later. The total path length of the tornado from 1 NE of Lastrup to Onamia is 17 miles. Total property damage is estimated at $1.7 million. In total, 6 tornadoes touch down in Morrison, Mille Lacs, and Kanabec.
1991: Duluth gets 2.5 inches of snow five days before the beginning of Fall.
1971: A brush fire at Lake Alexander in Morrison County spawns a 10-foot wide, 50-foot high ‘fire whirl.’ It moved out over the lake, overturned a 1,800 pound pontoon boat, and then dissipated as it moved back to shore.
1903: 3.75 inches of rain falls in the Minneapolis area.
________________________________________________________
Average High/Low for Minneapolis
September 18th
Average High: 71F (Record: 93F set in 1891)
Average Low: 51F (Record: 32F set in 1929)
Record Rainfall: 2.37″ set in 2015
_________________________________________________________
Sunrise/Sunset Times for Minneapolis
September 18th
Sunrise: 6:54am
Sunset: 7:19pm
Hours of Daylight: 12hours & 22mins
Daylight LOST since yesterday: ~3 minutes and 6 seconds
Daylight LOST since summer solstice (June 20th): 3 hours & 15 minutes
__________________________________________________________
Moon Phase for September 18th at Midnight
0.9 Days Before New Moon

Temperatures on Mondaty will still be quite cool across the region with temps running nearly 25F cooler than they did on Thursday. Note that the mercury topped out at 91F in the Twin Cities on Thursday, which was the warmest day since July 22nd when we hit 91F.
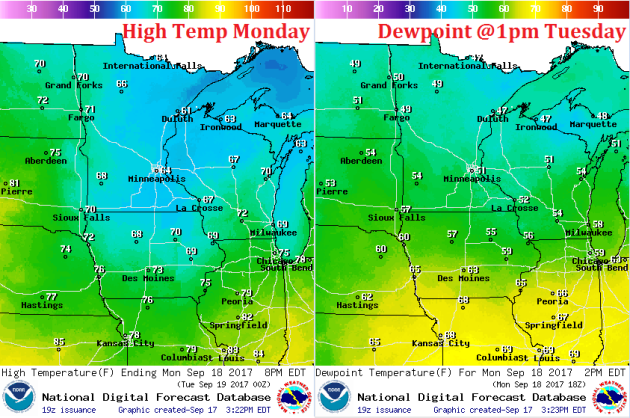
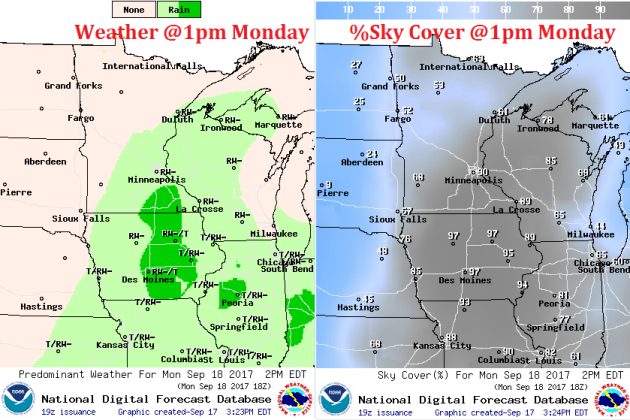
Weather Outlook For Monday
A weak storm system will be responsible for a little light rain across the southern half of the state and into Wisconsin through the first half of the day. Note that much of northwestern Minnesota will remain dry with even a little sunshine.
.png)
______________________________________________________
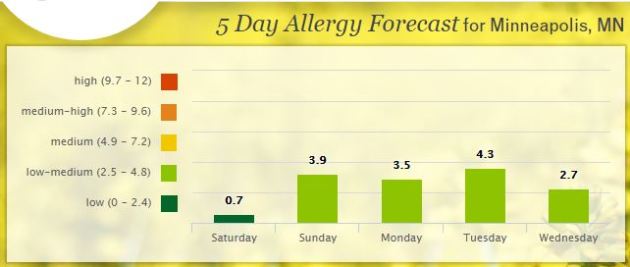
Pollen Forecast
____________________________________________________________________________
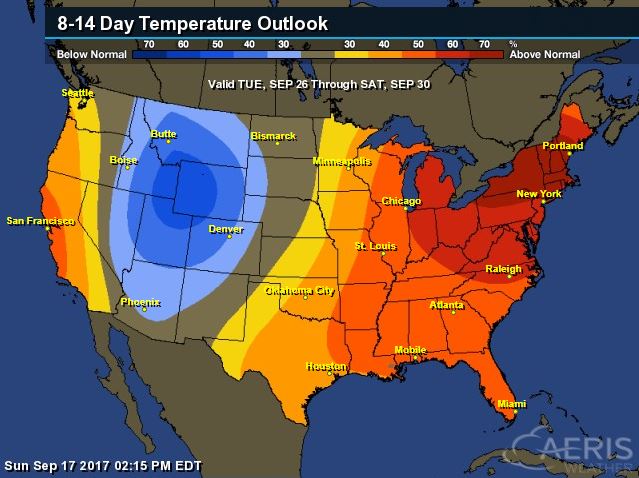
Minneapolis Temperature Outlook
Here’s the temperature outlook through October 2nd, which shows temps staying quite cool on Monday, but should be able to warm back into the upper 70s/lower 80s through the week ahead. Enjoy it because the extended forecast suggests temps falling back into the 60s by the last week of the month. Note that the average high in the Twin Cities on September 30th is 65F with an average overnight low of 46F.
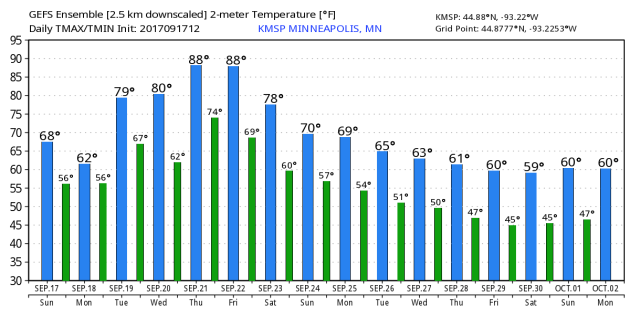
According to NOAA’s CPC, the extended temperature outlook from September 26th through the 30th suggests warmer than average temperatures will still linger across parts of the Midwest, but will likely start shifting into the Great Lakes as cooler than average temps continue to build in across the High Plains and western Dakotas.
___________________________________________________________
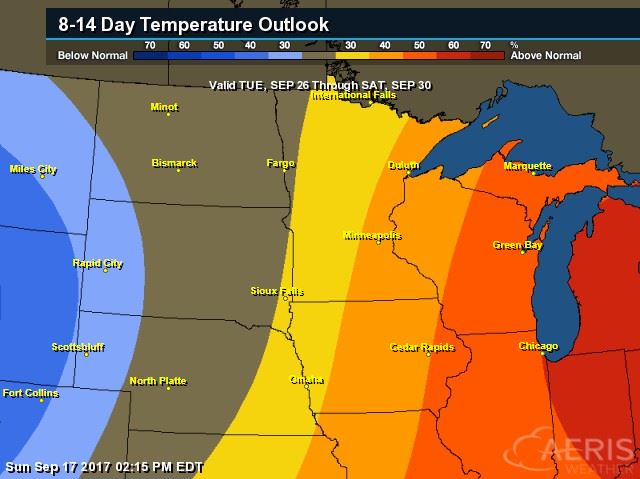
Extended Temperature Outlook
According to NOAA’s CPC, the extended temperature outlook through September 30th shows that a good chunk of the Eastern and Southern U.S. will be warmer than average, but the Western US will remain cooler than average.
 __________________________________________________________
Fall Color – Coming To A Tree Near You…
It’s about that time of the year again to gaze upon Mother Nature’s fall foliage, which is really starting to show up. By now, you’ve probably noticed a few eager trees changing color pretty rapidly, some of this could be due to a little stress, but it’s not uncommon to start seeing some changes at this time of the year.

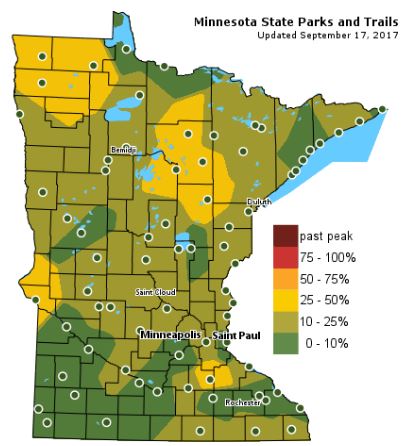
Minnesota Fall Color Update
According the MN DNR, much of the state is already starting to see hints of fall color, however, there are pockets of 25%-50% color across parts of Central, Western and Northwestern Minnesota!
Follow along as the fall colors change with the MN DNR map HERE:
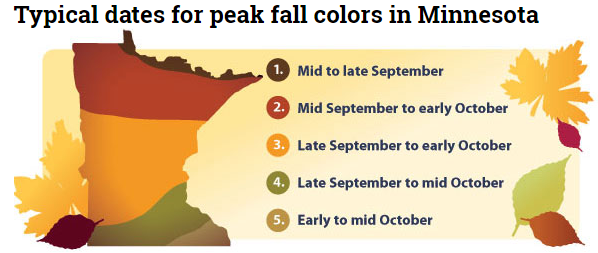
Typical Fall Color Peak in Minnesota
Here are the typical fall color peak times across the state of Minnesota and note that areas along the northern tier of the state usually see their peak toward the 2nd half of September. However, peak color usually doesn’t arrive in central Minnesota until October, but we’re getting close.
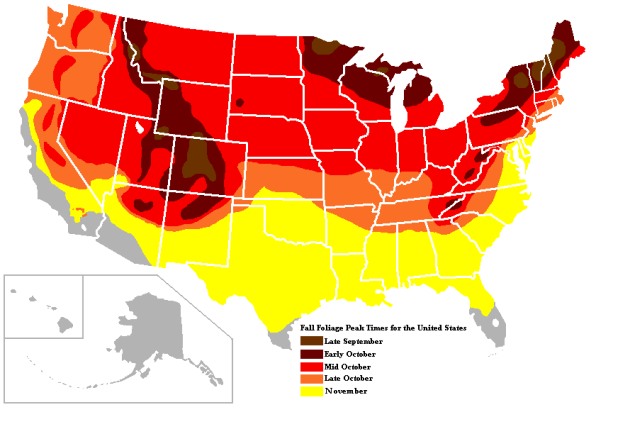
Typical Fall Color Times Across the Country
Here are the typical fall color peak times across the country, which suggests that much of the peak across the northern half of the nation usually wraps up through the month of October.
_______________________________________________________________________
______________________________________________________________________
___________________________________________________________________
______________________________________________________________________
__________________________________________________________________
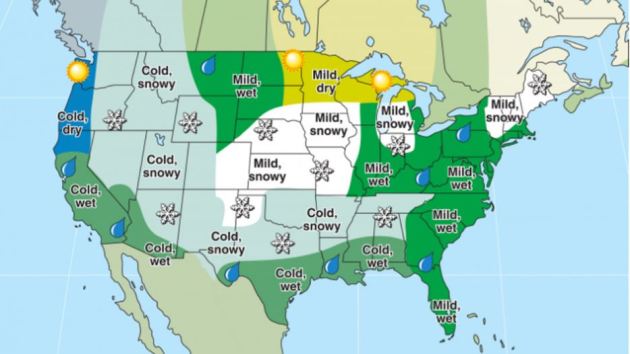
“This winter is forecast to be much colder than last year’s, but—just like last winter—not colder than usual. In fact, a large part of the northern United States will experience milder-than-average temperatures (though we would still recommend having your long underwear on-hand), while much of the South and West can expect to feel cooler than normal. Escaping this chill are Florida and the Southeast, where milder-than-usual temperatures will be felt.”
See more from SnowBoarder.com HERE:
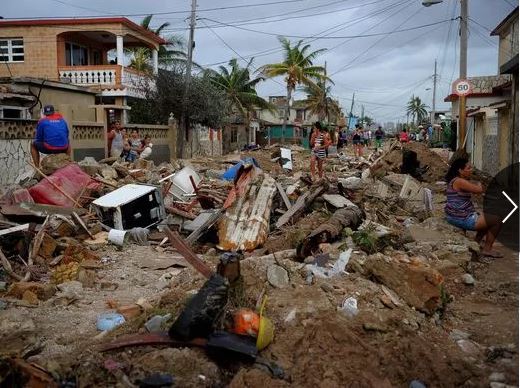
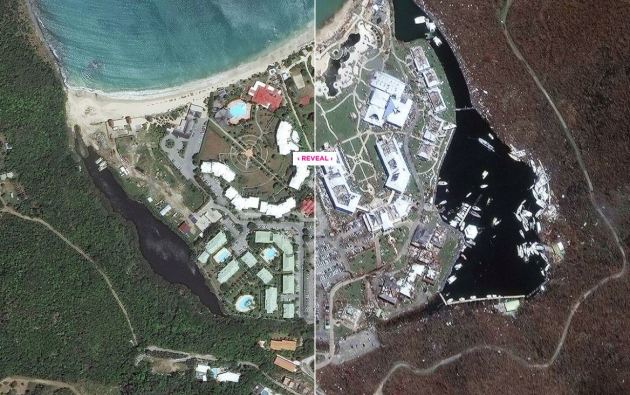
_______________________________________________________________________“Before and after photos show Hurricane Irma’s devastation in the Caribbean”
“Hurricane Irma caused billions in damage in Florida, destroying large parts of the Keys and knocking out power to at least 60 percent of the state. The destruction in the U.S., however, pales in comparison to the toll that Irma exacted in the northern Leeward Islands and parts of the Caribbean. As a Category 5 beast with sustained winds of 185 miles per hour, Irma destroyed large parts of St. Martin, an island shared by France and the Netherlands. The famous airport in St. Maarten, which is known for its picturesque, extremely low landing approaches over Maho Beach, is now closed due to extensive damage. The control tower, with its signature rooftop radar dome, has been reduced to rubble. The islands that were hardest hit are now appealing for aid as they try to stave off a humanitarian crisis due to lack of shelter, food, water, and medical supplies. The storm’s damage was so extensive that it’s viewable from space. These images were taken by DigitalGlobe’s WorldView-3, WorldView-2, and GeoEye-1 satellites before and after the storm.”
See more from Mashable.com HERE:
(Anse Marcel, St Martin)
__________________________________________________________________________
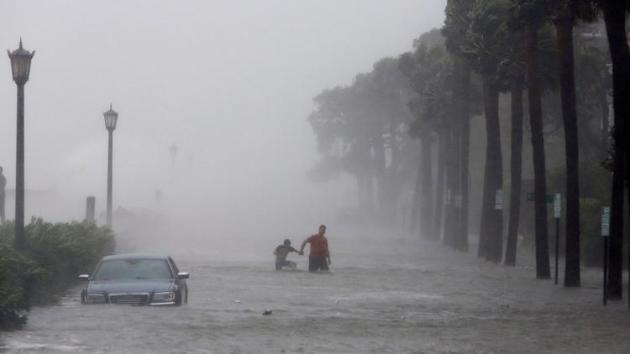
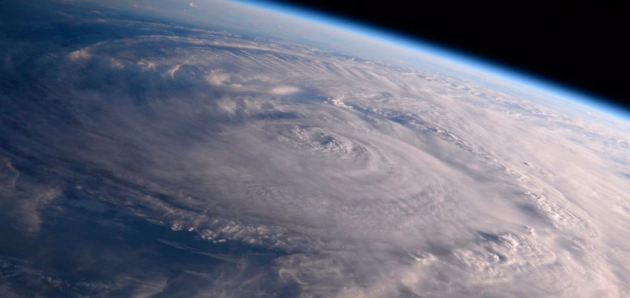
“Yes, climate change made Harvey and Irma worse”
“The right time to talk climate change is now. It might seem premature when people in the Caribbean, Florida and Texas are still mucking out their flooded homes. And no, changes in our planet’s atmosphere did not cause Hurricanes Harvey or Irma. But the consensus among scientists is that the effects of climate change, such as rising sea levels and warmer oceans, made those storms far more destructive than they would have been in previous decades. “The short version is, climate change makes these very bad storms worse,” said Sean Sublette, a meteorologist with Climate Central, a nonprofit group that studies climate change. “It’s not the approximate cause of the storm, but it makes these bad storms worse. And in the case of a really bad storm, climate change can make it totally disastrous or catastrophic.”The data on how our warming planet specifically impacted Harvey and Irma won’t be known for quite some time. It can take months and even years to collect and analyze that information.”
Thanks to Philip Klotzbach who is a meteorologist at CSU specializing in Atlantic basin seasonal hurricane forecasts for putting together these records from Hurricane IRMA… WOW – there certainly are a lot of them! Take a look: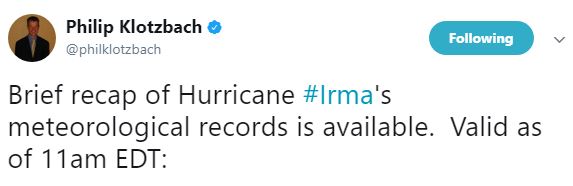 Hurricane Irma Meteorological Records/Notable Facts Recap Intensity/Day Measures
– 185 mph lifetime max winds – tied with Florida Keys (1935), Gilbert (1988) and Wilma (2005) for second strongest max winds of all time in Atlantic hurricane. Allen had max winds of 190 mph in 1980
– 185 mph lifetime max winds – the strongest storm to exist in the Atlantic Ocean outside of the Caribbean and Gulf of Mexico on record
– 185 mph max winds for 37 hours – the longest any cyclone around the globe has maintained that intensity on record. The previous record was Haiyan in the NW Pacific at 24 hours
– 914 mb lifetime minimum central pressure – lowest since Dean (2007) and 10th lowest in satellite era (since 1966)
– 914 mb lifetime minimum central pressure – lowest pressure by an Atlantic hurricane outside of the western Caribbean and Gulf of Mexico on record
– First Category 5 hurricane in the Atlantic since Matthew (2016) and first Category 5 hurricane in the tropical Atlantic (7.5-20°N, 60-20°W) since Hugo (1989)
– 3.25 day lifetime as a Category 5 hurricane – tied with Cuba (1932) for longest lifetime as Category 5
– 3 consecutive days as a Category 5 hurricane – the longest in the satellite era (since 1966)
– 12.75 named storm days – the most since Nicole (2016) and tied for 23rd most in satellite era
– 11.25 hurricane days – the most since Ivan (2004) and tied for 9th most in satellite era (since 1966) – satellite-era record is Ginger (1971) with a whopping 19.5 hurricane days
– 8.50 major hurricane days – the 2 nd most in satellite era (since 1966) – trailing Ivan (2004).
– 3.75 major hurricane days in the tropical Atlantic (7.5-20°N, 60-20°W) – trailing only Luis (1995) for major hurricane days in the tropical Atlantic
ACE Measures
– Generated the most Accumulated Cyclone Energy by a tropical cyclone on record in the tropical Atlantic (7.5-20°N, 60-20°W)
– Generated more Accumulated Cyclone Energy than the first eight named storms of the Atlantic hurricane season (Arlene-Harvey) combined
– Generated the most Accumulated Cyclone Energy in a 24-hour period on record, breaking old record set by Allen (1980)
– 67.5 Accumulated Cyclone Energy – the 2nd most by an Atlantic hurricane in satellite era (since 1966) – trailing only Ivan (70.4)
– Generated enough Accumulated Cyclone Energy to satisfy NOAA ACE definition for an average Atlantic hurricane season
– Generated more Accumulated Cyclone Energy than 18 entire Atlantic hurricane seasons in the satellite era (since 1966)
Landfall Records
– Leeward Islands: Strongest storm on record to impact the Leeward Islands defined as 15-19°N, 65-60°W for this calculation, with max winds of 185 mph. Okeechobee Hurricane (1928) and David (1979) were previous strongest at 160 mph
– Turks and Caicos: Closest approach of a Category 5 hurricane on record
– The Bahamas: First Category 5 hurricane to make landfall since Andrew (1992)
– Cuba: 160 mph, 924 mb – Category 5 – First Category 5 hurricane to make landfall since the Cuba Hurricane of 1924
– Continental United States: 1 st Landfall (Cudjoe Key, FL): 130 mph, 929 mb – Category 4
– First Category 4 hurricane to make landfall in Florida since Charley (2004) and major hurricane to make landfall in Florida since Wilma (2005)
– 929 mb pressure is tied for 7th lowest on record for U.S. landfall with Lake Okeechobee Hurricane of 1928 2 nd Landfall (Marco Island, FL): 115 mph, 940 mb – Category 3
– Exact same latitude/longitude as well as same Saffir/Simpson Category at landfall as Wilma (2005): 25.9°N, 81.7°W
______________________________________________________________
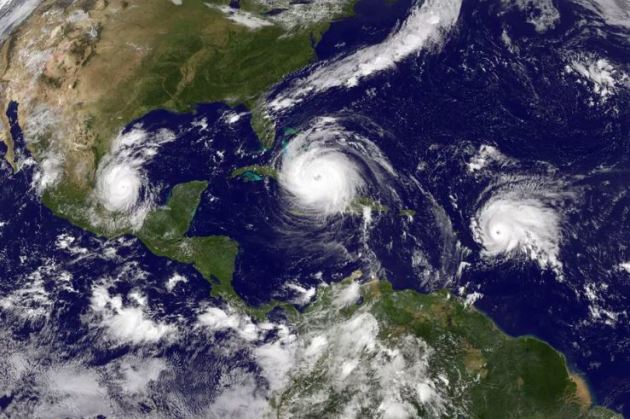
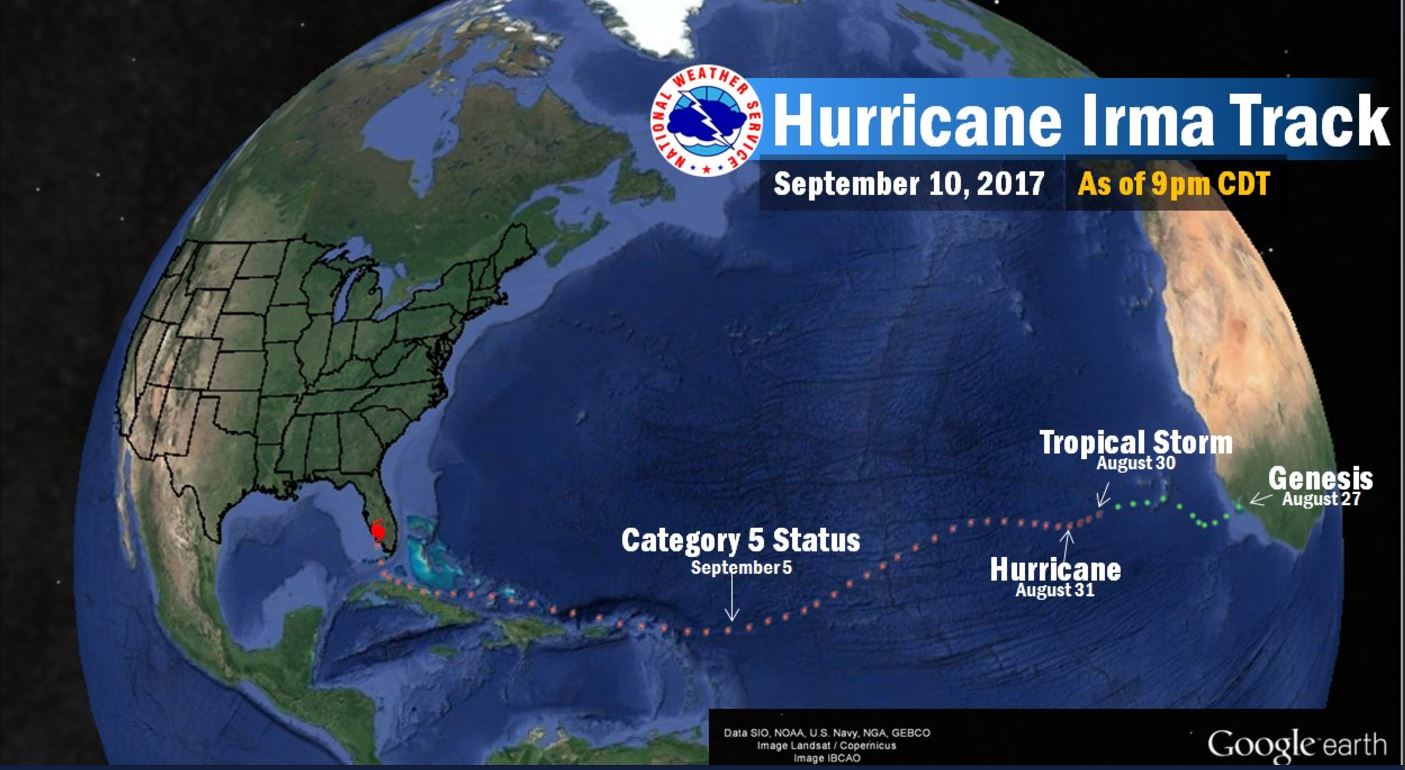
IRMA’s Track
Irma was an interesting storm as it started as a wave of energy off the west coast of Africa that quickly became a tropical storm just a few days later. 6 days after turning into a tropical storm, it was a category 5 hurricane! It then moved through the Caribbean and eventually made landfall with southern Florida on September 10th.
___________________________________________________________
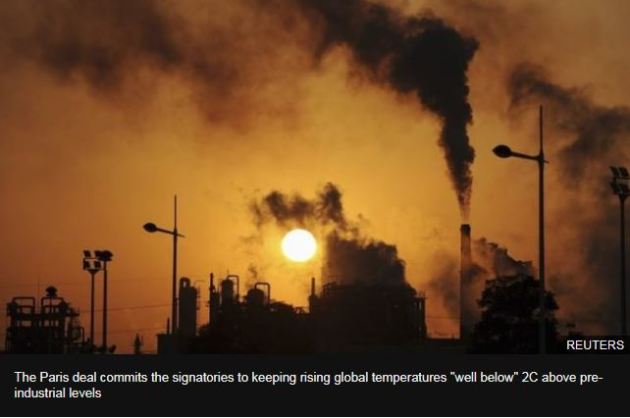
“Environmentalists get win in US coal-climate change lawsuit”
“Handing a major victory to environmentalists, a court cast doubt Friday on a longstanding U.S. government argument that blocking federal coal leasing won’t affect climate change because the coal could simply be mined elsewhere. Environmentalists have been trying for years to block federal coal leases on climate-change grounds with limited success. The ruling by the 10th U.S. Circuit Court of Appeals will require the U.S. Bureau of Land Management to provide more data to support its argument that coal makes no net contribution to climate change after it’s burned in power plants. The BLM oversees leasing of vast Western tracts that supply much of the nation’s coal. “This is big. And we’re certainly going to be wielding this and using it to confront other mining approvals both in the Powder River Basin and beyond,” said Jeremy Nichols with WildEarth Guardians. The Sierra Club and WildEarth Guardians sued to block four leases that would allow mining to continue at the Black Thunder and North Antelope Rochelle mine, the two biggest in the U.S. by production. Both are in the Powder River Basin, where vast, open-pit mines supply around 40 percent of the nation’s coal.”
(Image credit: Associated Press Via ABCNews)

____________________________________________________________
“Sachs: Big Oil will have to pay up, like Big Tobacco”
“Here is a message to investors in the oil industry, whether pension and insurance funds, university endowments, hedge funds or other asset managers: Your investments are going to sour. The growing devastation caused by climate change, as seen this month in Texas, Florida and the Caribbean, are going to blow a hole in your fossil-fuel portfolio. Not only will the companies you own suffer as society begins to abandon fossil fuels in earnest, they will also be dragged through the courts here and abroad for their long-standing malfeasance and denial of what they have done to the world.
Climate change deniers, mainly politicians in the pay of the oil industry, protest that there is no proof that destructive storms and floods are the result of human-induced global warming. Who can say that a Hurricane Harvey or Irma wouldn’t have occurred in the past?”
(Image Credit: NOAA)
__________________________________________________________
Thanks for checking in and don’t forget to follow me on Twitter @TNelsonWX