79 F. high in the Twin Cities Friday.
80 F. average high on August 22.
87 F. high on August 22, 2013.
August 22, 1955: Hail in Houston County, with piles to a foot deep at Rushmore.

Sweet Indulgence
I ate so much at the Minnesota State Fair I suspect I’m showing up on Doppler radar. Yes, I’m the yellow blob. Some of the deep-fried, butter-infused, bacon-wrapped treats should come with a heart surgeon, but I remember what my late mother told me. “Live a life of quiet moderation, but it’s OK to indulge every now and then.” This is one of those moments.
My favorites? Walleye Mac ‘n Cheese, chocolate salami (no meat, just nuts & dark chocolate) and beer gelato. It has a 1 percent alcohol content so they’ll check to make sure you’re 21. And yes, it tastes better than it sounds.
Clouds were slow to burn off Friday, keeping things more comfortable in spite of high humidity. Today will be the more reasonable day to graze the fairgrounds: peeks of murky sun with mid-80s and a drippy dew point near 67F.
Expect low 90s Sunday; probably one of the 3 hottest days of summer – a summer that hasn’t been all that hot, come to think of it. Factoring in a dew point above 70F it may fee like upper 90s by late afternoon. Pace yourself, stay hydrated, and try the beer gelato.
Next week? Far more comfortable for stumbling around the fair, as dew points drop sharply.
Canada-on-a-stick.
Weekend Storms Most Likely Western and Central Minnesota. NOAA’s 4 KM NAM model shows a potential for 2-4″ rains from late Saturday night into Sunday from west central Minnesota into portions of central and northern Minnesota, roughly Detroit Lakes and Fergus Falls to Wadena, Bemidji and International Falls. I wouldn’t be surprised to hear reports of flash flooding in this area. 60-hour accumulated rainfall: HAMweather.
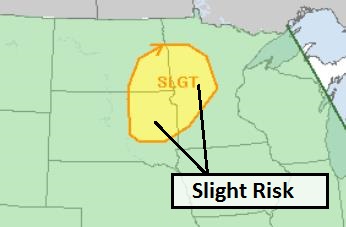
Saturday Severe Storm Risk. NOAA SPC has a slight risk of severe storms (hail and straight-line winds) from the eastern Dakotas into parts of western and central Minnesota. Be alert for possible watches and warnings later today and tonight.
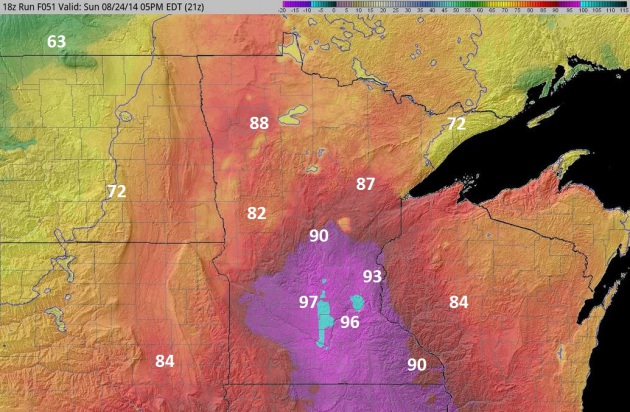
Sunday Sizzle. NOAA data is hinting at mid to upper 90s close to the metro Sunday afternoon. I’m not sure it’ll get quite that hot, but if the sun stays out most of the day with a stiff south wind I could see some mid-90s in and around the Twin Cities metro area. Heat spikes and peaks Sunday, followed by a cooling trend next week. 5 PM Sunday temperature forecast: NOAA and HAMweather.
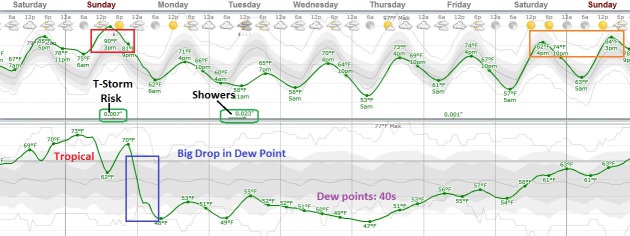
Old Fasioned A/C Next Week. After sweating it out today and tomorrow the dreaded dew point takes a big tumble Sunday night, dropping from low 70s into upper 40s by Monday and Tuesday. The next disturbance may brush southern Minnesota Tuesday; nights cool and comfortable by midweek. A dry sky is likely Wednesday into next weekend with temperatures melling through the 70s into the 80s.
Spotty, Fickle Rains So Far in August. Dr. Mark Seeley has another good weather and climate-related time capsule and summary, proving perspective to our ongoing pattern. Here’s an excerpt of this week’s edition of WeatherTalk: “…As opposed to the widespread wetter than normal pattern that prevailed across the state during the first half of summer, August rainfall has been very spotty. The US Drought Monitor expanded the geographic designation for an abnormally dry landscape in Minnesota. Last week the designated area was Freeborn and Faribault Counties and this week the Drought Monitor designation for abnormally dry includes portions of Winona, Fillmore, Mower, Blue Earth, Waseca, and Le Sueur Counties. Heavier than normal rainfall for much of Minnesota is in the outlook for the remainder of August, so most areas should see some significant rainfall amounts before the end of the month…”
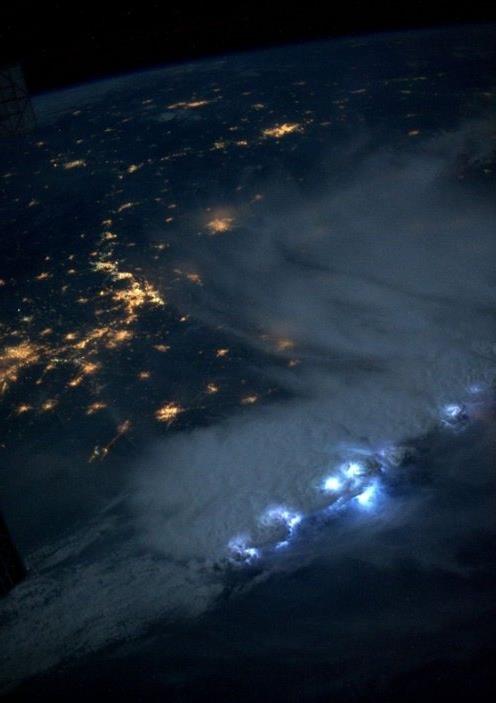
Image credit above: International Space Station, NASA.
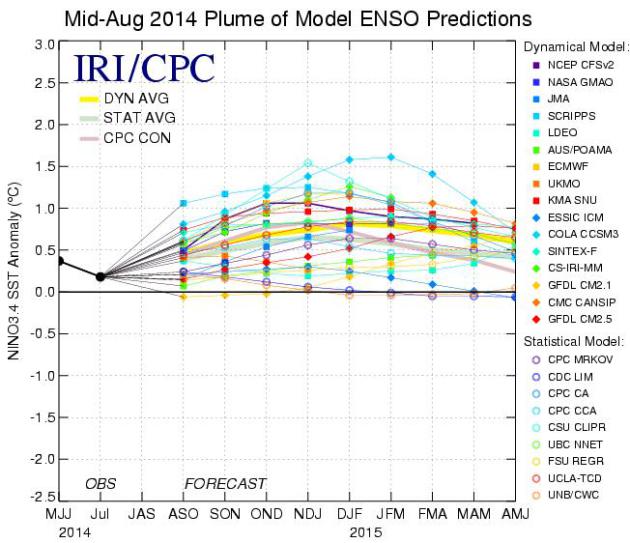
El Nino: Down, But Not Out. Here’s an excerpt of an in-depth look at ENSO and what will probably still be a mild to moderate El Nino event later in 2014 and early 2015, courtesy of International Research Institute for Climate and Society at Columbia University: “…Most of the set of dynamical and statistical model predictions issued during late July and early August 2014 predict a transition from neutral ENSO conditions to weak El Nino conditions during northern early fall 2014 with some further warming predicted into late fall and winter 2014-15. Development of El Nino conditions appears approximately 50% likely for the Aug-Oct or Sep-Nov seasons of 2014, and rises to 70-75% by Nov-Jan and Dec-Feb 2014-15…”
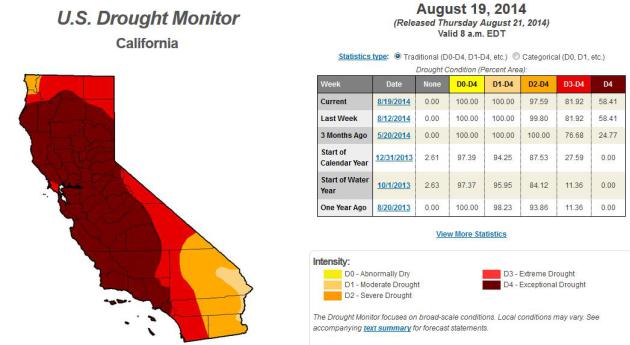
63 Trillion Gallons of Groundwater Lost in Drought, Study Finds. This story at The Los Angeles Times provides perspective, and a few staggering statistics; here’s a clip: “The ongoing drought in the western United States has caused so much loss of groundwater that the Earth, on average, has lifted up about 0.16 inches over the last 18 months, according to a new study. The situation was even worse in the snow-starved mountains of California, where the Earth rose up to 0.6 inches. Researchers from UC San Diego’s Scripps Institution of Oceanography and the U.S. Geological Survey estimated the groundwater loss from the start of 2013 to be 63 trillion gallons — the equivalent of flooding four inches of water across the United States west of the Rocky Mountains…” (Latest U.S. Drought Monitor data is here).
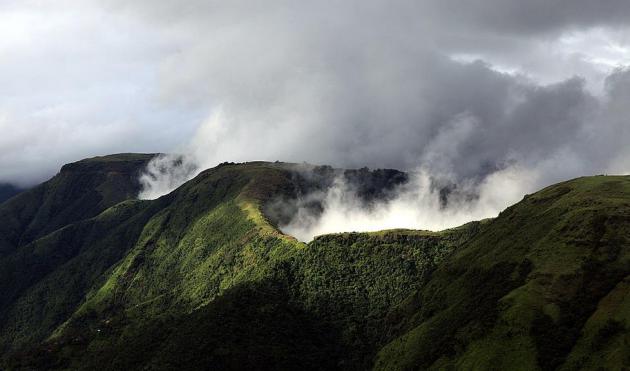
Meghalaya: The Wettest Place on Earth. The Atlantic takes us to a place with perpetual monsoons. Somehow locals have found a way to adapt, even thrive. Here’s an excerpt: “Photographer Amos Chapple returns to our site once once again, bringing amazing images from the state of Meghalaya, India, reportedly the rainiest spot on Earth. The village of Mawsynram in Meghalaya receives 467 inches of rain per year. Laborers who work outdoors often wear full-body umbrellas made from bamboo and banana leaf. One of the most fascinating and beautiful features in the region are the “living bridges” spanning rain-soaked valleys. For centuries, locals have been training the roots of rubber trees to grow into natural bridges, far outlasting man-made wooden structures that rot in just a few years...” (Photo: Wikipedia).
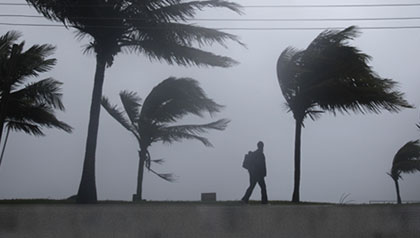
Hurricane Hype Is Here To Stay – Forecasters Must Adapt. Because now everyone is an armchair meteorologist, and can tweet information that is dubious or outright malicious. I echo many of meteorologist Jason Samenow’s concerns over at Capital Weather Gang; here’s an excerpt of what he had to say about recent hurricane-hype: “…Many weather communicators want the public to understand the full range of possibilities. We want the public to appreciate that model simulations for storms more than five days into the future aren’t realistic. We lament that armchair meteorologists (amateurs, students, novices, etc.) post unreliable model simulations on social media – without any context – of a storm obliterating a coastal city. We cringe when these suspect forecasts are shared thousands of times, misleading an unknowing public. While some us are secretly envious of the attention, we ultimately worry about a loss of public trust in weather forecasting when they are wrong (most of the time)…”
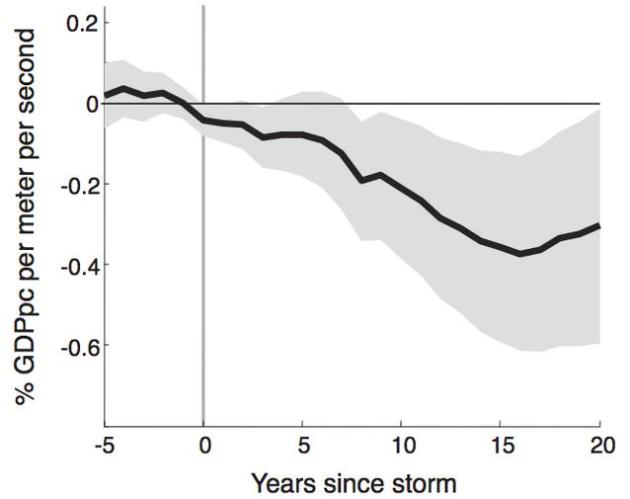
New Study Reveals The Lingering Economic Devastation Left by Hurricanes. The negative impact from hurricanes can linger not only years, but decades after a major strike. Here’s an excerpt of a story that caught my eye, courtesy of Business Insider Malaysia: “… A full fifteen years after a hurricane or typhoon strikes a country, that country’s per capita GDP will be lower by 0.38% for each meter per second of top wind speed than it would have been without the cyclone. So, a storm whose top wind speed was 10 m/s, or about 22 miles per hour, would have its per capita GDP lowered by about 3.8% fifteen years later, compared to a stormless baseline. The authors also note that cyclones have a much more severe effect on countries with multiple storms. Because each hurricane or typhoon negatively affects GDP in the long term, multiple storms over a period of time can have effects that add up…”
Graphic credit above: Hsiang and Jina, July 2014
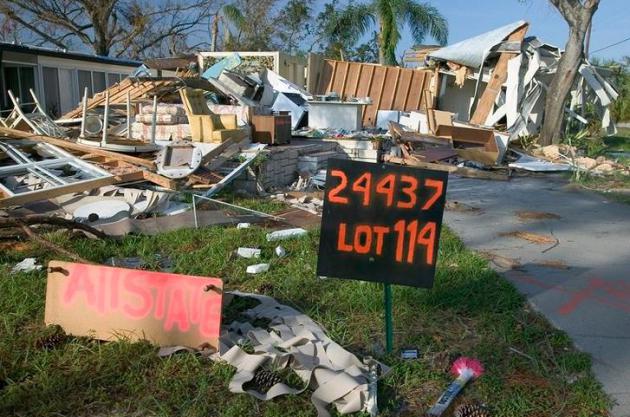
How The “Year of Four Hurricanes” Changed Florida’s Readiness. New communications tools exist that weren’t around 10 years ago, but amazing platforms like cell phone texts, Twitter and Facebook can transmit not only essential, accurate information and warnings, but also rumor, inuendo and misinformation. Here’s an excerpt of what’s changed (for the better) from Emergency Management: “…Communications: When the 2004 storms struck, Twitter did not exist. Neither did the iPhone. A new website called TheFacebook had just been created in a Harvard dorm room. When it came to hurricanes, the latest news arrived via television, the Web and radio. Today, when a storm gets close, text alerts will go out to anyone within range of South Florida cellphone antennas, even if their phone has a Cleveland or New York City area code. Emergency managers also plan to rely heavily on social media to get the word out. At the Broward County Emergency Operations Center, about 40 volunteers have been trained to monitor Facebook and Twitter for information on people trapped, in need of food or dealing with other emergency situations, said emergency manager Miguel Ascarrunz…”
Photo credit above: “Charley was the first of four hurricanes to strike Florida in 2004.” (Andrea Booher/FEMA).
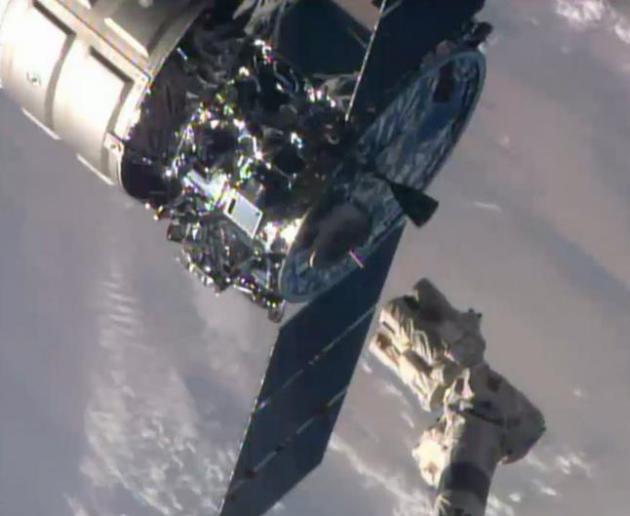
Sea Plankton Have Been Found on the International Space Station – But How Did They Get There? Good question. The Guardian has some potential explanations; here’s an excerpt: “Sea plankton have been found on the outside of the International Space Station, a Russian news agency reports. Itar-Tass says scientists on the space station, whose first component was launched into orbit in 1998, found the plankton – a source of food to many sea creatures – when taking samples from the windows (or “illuminators”)…” (Photo credit: AP Photo/NASA).
Seeds of Doubt. The New Yorker takes a look at a controversial crusade against genetically modified crops; here’s a clip: “…The fight has not been easy. Few technologies, not the car, the phone, or even the computer, have been adopted as rapidly and as widely as the products of agricultural biotechnology. Between 1996, when genetically engineered crops were first planted, and last year, the area they cover has increased a hundredfold—from 1.7 million hectares to a hundred and seventy million. Nearly half of the world’s soybeans and a third of its corn are products of biotechnology. Cotton that has been engineered to repel the devastating bollworm dominates the Indian market, as it does almost everywhere it has been introduced…”

What Does Depression Physically Feel Like? Here’s a snippet of a story from Huffington Post that caught my eye: “For people with depression, it can be a truly difficult task to explain their condition. Because it is a disease that is more commonly associated with mental symptoms — not outward, physical ones –those on the outside are often curious about what depression feels like. And it certainly feels like something: “In general, the worse the painful physical symptoms, the more severe the depression,” researchers wrote in an overview of depression and physical symptoms in the Journal of Clinical Psychology. “Symptoms have been found to increase the duration of depressed mood…”
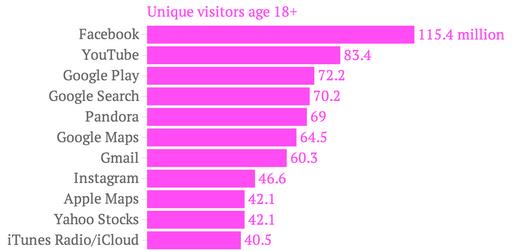
The 25 Most Popular Mobile Apps in America. No games in the Top 25? I guess that’s progress. Or is it? Playing Tetris is probably safer than updating my Faceplant account; here’s an excerpt from Quartz: “In its latest mobile app report, comScore tracks the 25 most popular apps in the US. This is an interesting slice of the App Store, as it highlights active usage, not just one-time downloads or recent popularity…”
Graphic credit: Quartz and comScore.
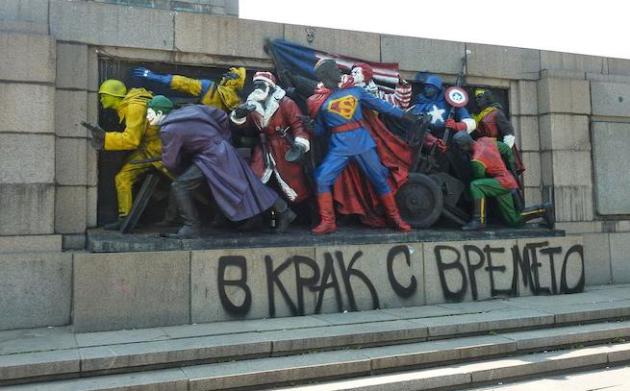
Russia Wants Bulgaria to Stop Vandalizing Sovient Monuments. It sounds like a bad joke, until you consider that maybe Russia is looking for another pretext to interfere in a former Soviet-block nation. Here’s a clip from The Moscow Times: “Russia is demanding that Bulgaria try harder to prevent vandalism of Soviet monuments, after yet another monument to Soviet troops in Sofia was spray-painted, ITAR-Tass reported. The Russian Embassy in Bulgaria has issued a note demanding that its former Soviet-era ally clean up the monument in Sofia’s Lozenets district, identify and punish those responsible, and take “exhaustive measures” to prevent similar attacks in the future, the news agency reported Monday…”
Photo credit above: Figures of Soviet soldiers at the base of a Soviet Army monument were previously transformed into superheroes in Sofia, Bulgaria.”
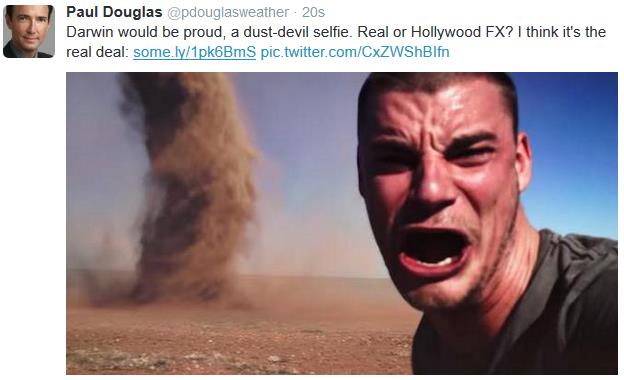
You Can’t Make This Stuff Up – Or Can You? There’s some debate online about whether this video clip of a guy in Australia stalking a dust devil is real. I’ve looked at it pretty carefully, and I don’t think this was done with special effects. Impressive, but can he get life insurance? Check it out here.
TODAY: Hazy sun. Dog Days. Dew point: 67. Winds: East 8. High: 86
SATURDAY NIGHT: T-storms western and northern Minnesota. Sultry in the metro. Low: 75 (80 downtown?)
SUNDAY: Heat spike with hot sun. T-storms late. Dew point: 71. High: 92
MONDAY: Partly sunny, less humid. DP: 53. Wake-up: 64. High: 78
TUESDAY: Showers likely. Risk of thunder. Wake-up: 60. High: near 70
WEDNESDAY: More sun. Showers linger far south. Wake-up: 59. High: 74
THURSDAY: Plenty of sun, milder. DP: 51. Wake-up: 54. High: 77
FRIDAY: Warm sun, very pleasant. DP: 57. Wake-up: 59. High: 78
Climate Stories…
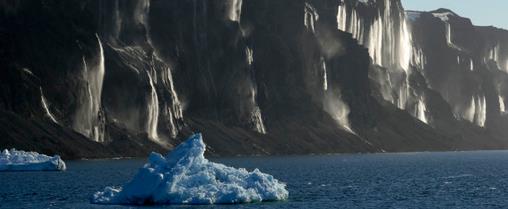
World’s Largest Ice Sheets Melting At Fastest Rate Ever Recorded. Huffington Post confirms what climate scientists have known for some time: the melting is happening even faster than most climate models predicted. Here’s a clip from Huffington Post: “…Using the European Space Agency’s CryoSat 2 satellite, the Alfred Wegener Institute from Germany has found that western Antarctica and Greenland are losing massive amounts of ice. “Combined, the two ice sheets are thinning at a rate of 500 cubic kilometres per year,” said glaciologist Dr. Angelika Humbert, one of the authors of the AWI study, in a press release. “That is the highest speed observed since altimetry satellite records began about 20 years ago…”
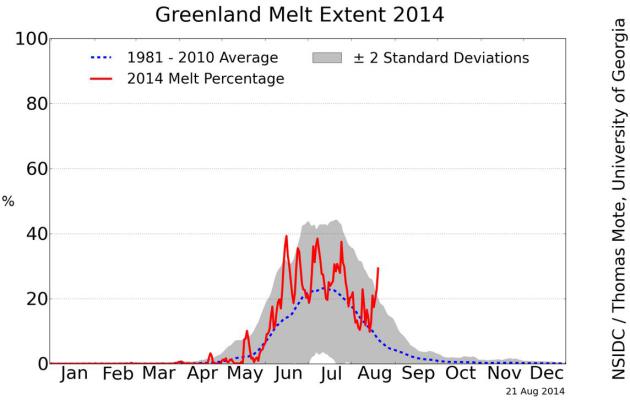
Greenland Ice Melt: 2014. Here’s an excerpt of an update on the extent of ice melt in Greenland (more than 2 standard deviations for much of June and July) from the National Snow and Ice Data Center: “Melting on the surface of the Greenland Ice Sheet in June and July 2014 has been well above the 1981 to 2010 average in most areas, but after a fast start in May, the southern region and the southeastern coast have seen lower-than-average melt. Mid-summer surface melting did not reach higher elevations (above 2000 meters) as often as in the reference period 1981 to 2010. Short bursts of extensive melting were related to periods of high air pressure over the ice sheet favoring sunny conditions, and promoting increased melting in darker areas of the ice sheet (wet snow, bare ice, or dirty snow)...”
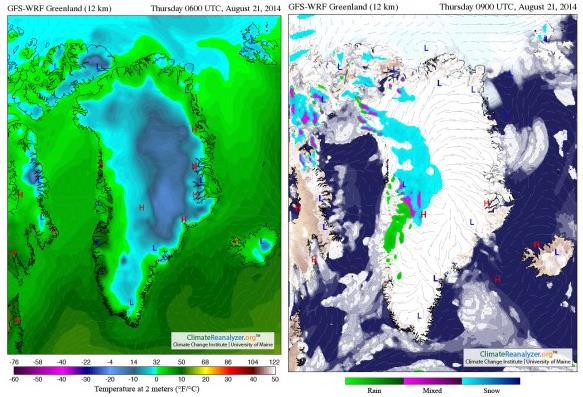
Greenland’s Late August Rain Over Melt Ponds Is A Glacial Outburst Flood Hazard. Robert Scribbler has an interesting post; here’s an excerpt: “Glacial melt ponding on steep ice faces. Above freezing temperatures for an extended period. Storms delivering rainfall to the glacier surface. These three events are a bad combination and one that, until recently, we’ve never seen before for Greenland. It is a set of circumstances directly arising from a human-driven warming of the great ice sheet. And it is one that risks a highly violent and energetic event in which melt ponds over-top and glaciers are flushed and ripped apart by surges of water rushing for scores of miles over and through the ice sheet...”
Map credit above: “GFS temperature and rainfall analysis for Greenland on August 21, 2014. Note the above freezing temperatures and rainfall over the region of the Jacobshavn Glacier for today.” Image source: University of Maine’s Climate Reanalyzer.

How Climate Scientists Really Feel. Sure, they’re supposed to be clinical, leave emotions out of their research. But these men and women are human too, and studying climate change is the environmental equivalent of being an oncologist. It wears on you over time. Here’s a web site with a collection of thoughts from noted climate scientists around the world. Here’s one entry: “How climate change makes me feel. I feel a maelstrom of emotions…
I am exasperated. Exasperated no one is listening.
I am frustrated. Frustrated we are not solving the problem.
I am anxious. Anxious that we start acting now.
I am perplexed. Perplexed that the urgency is not appreciated.
I am dumbfounded. Dumbfounded by our inaction.
I am distressed. Distressed we are changing our planet.
I am upset. Upset for what our inaction will mean for all life.
I am annoyed. Annoyed with the media’s portrayal of the science.
I am angry. Angry that vested interests bias the debate.
I am infuriated. Infuriated we are destroying our planet.
But most of all I am apprehensive. Apprehensive about our children’s future.”
Associate Professor
Anthony J. Richardson
Climate Change Ecologist
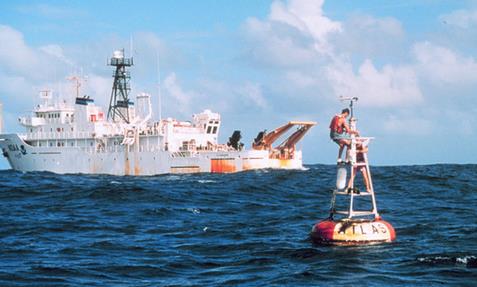
Atlantic Slows Warming, Temperature Rises Seen Resuming from 2030. Reuters has the story; here’s an excerpt: “…We’re pointing to the Atlantic as the driver of the hiatus,” Ka-Kit Tung, of the University of Washington in Seattle and a co-author of Thursday’s study in the journal Science, told Reuters. The study said an Atlantic current carrying water north from the tropics sped up this century and sucked more warm surface waters down to 1,500 meters (5,000 feet), part of a natural shift for the ocean that typically lasts about three decades...” (Photo credit: NOAA).

Jet Stream Changes Driving Extreme Weather Linked Again to Global Warming, Arctic Ice Loss. Here’s a story, video and links to research from ThinkProgress; an excerpt:
Weather extremes in the summer — such as the record heat wave in the United States that hit corn farmers and worsened wildfires in 2012 — have reached an exceptional number in the last ten years. Man-made global warming can explain a gradual increase in periods of severe heat, but the observed change in the magnitude and duration of some events is not so easily explained. It has been linked to a recently discovered mechanism: the trapping of giant waves in the atmosphere. A new data analysis now shows that such wave-trapping events are indeed on the rise.
A number of studies in recent years have linked this quantum jump in extreme weather to global warming and the warming-driven loss of Arctic ice (see here and here). Jennifer Francis of Rutgers University’s Institute of Marine and Coastal Sciences has been at the forefront of this research. She explains her findings in this video…”
