How long can Dad hold his breath? Just going out to fetch the paper may require the backstroke this morning. Be careful out there. A Flash Flood Watch is posted, and I expect very heavy rains during the morning hours, capable of sparking flash flooding of streets, streams and poor drainage areas. Skies dry out later today but a nagging warm frontal boundary keeps us thundery into Friday. At least it’ll heat up; the first 90 degree high of 2014 possible by Tuesday.
Waterlogged Dads
“A father has pictures where his money used to be.” Yep, that sounds about right. You may see more of dear old dad today. No need to water the yard, and debilitating sunburn will not be a problem. Then again, if you have your health and your kids are doing OK, how bad can it be?
Peering out my rain-splattered window it’s not hard to believe that June is Minnesota’s wettest month of the year. Pond-size puddles and leftover storms give way to brightening skies later today. You may even salvage a little lukewarm sun by late afternoon and evening.
A sluggish warm front will torment us much of this week as patterns stall; Minnesota on the northern edge of a huge heat bubble with 90s and sauna-worthy dew points just to our south. This set-up will create a ROF, or “ring of fire”: an arc of thunderstorms bubbling up, especially at night. An additional 1-3 inches of rain may fall. With saturated soil it won’t take much additional moisture for flash flooding.
Temperatures surge into the 80s to near 90F by midweek with T-storms sprouting every day into Friday.
Next week looks hotter and drier as we finally limp into a real summer pattern as the core of the jet stream (finally) lifts into southern Canada. Coming after one of the wettest springs on record.
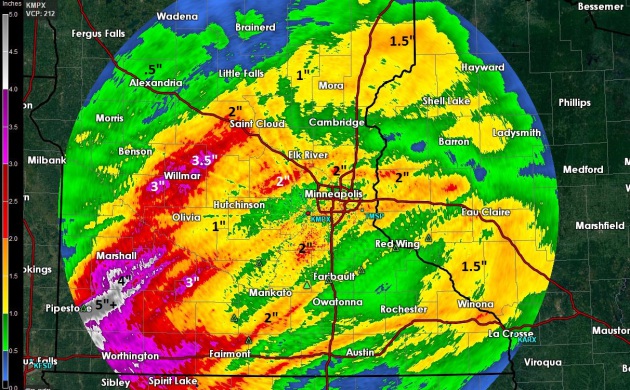
Another Saturday Soaking. Rainfall amounts (NWS Doppler estimated) as of midnight show some 1-2″ amounts common across the Twin Cities metro yesterday, as much as 4-5″+ near Marshall and Pipestone. More heavy rain is likely this morning.
Peak Wind Gusts Saturday:
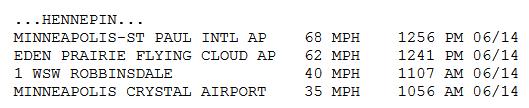
Wind-Related Damage. NOAA has a complete list of wind and hail damage from Saturday’s severe T-storms and gravity-wave-induced high winds in and around the Twin Cities metro. See below.
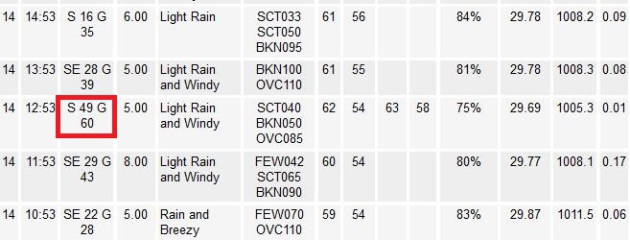
Damaging Winds Saturday Induced by Gravity Waves? MSP International experienced a wind gust to 68 mph shortly before 1 PM Saturday, with only light rain in the area – no severe thunderstorms nearby. The probably culprit: gravity waves, which are virtually impossible to predict in advance. Here’s a good explanation of how gravity waves can spark strong winds on the surface, courtesy of NOAA: “A gravity wave is a meteorological phenomenon where strong winds of one to two hours’s duration occur along with a rapid fall and rise in surface pressure. graveity waves usually form along the back edge of a large area of precipitation followed by rapid drying in the middle layers of the atmosphere. There is a net upward motion in the area of rainfall followed by a net downward motion in the dry air behind. This produces a small pressure disturbance at the surface. The pressure disturbance is allowed to grow due to the presence of a layer of stable are anywhere from 5,000 to 12,000 feet above the ground. This stable layer maints and “ducts” the now-growing pressure wave horizontally along the earth’s surface instead of allowing it to disperse up and outward through the depth of the atmosphere….”
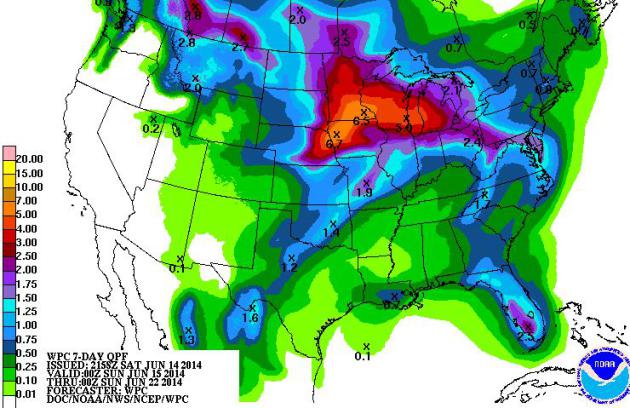
Yet Another Soggy Holding Pattern. No, lake and river levels won’t be going down anytime soon. Once again the weather is getting stuck, a warm frontal boundary lurking just south of Minnesota will spark the development of multiple waves of showers and T-storms into Friday of this week. NOAA models suggest some 5-7″ rains over the next 7 days – much of Minnesota is on track for the wettest spring on record.
84-Hour Future Radar. NOAA’s 12km NAM shows the heaviest rain and embedded T-storms coming this morning and midday, with drying during the afternoon hours. We may salvage a few peeks of sun by the dinner hour, especially over southern and southwestern Minnesota. We dry out briefly on Monday before more storms flare up along the northern boundary of inflamed, 90-degree air Monday night. Storms may become more numerous by Wednesday night and Thursday. Loop: NOAA and HAMweather.
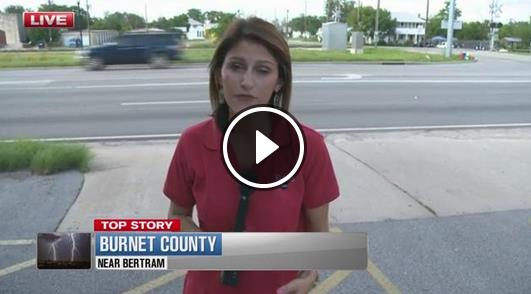
Tornado Carries Home 100 Yards With Family Inside. KVUE-TV has the harrowing details and a video update; here’s an excerpt: “A tornado touched down in Burnet County, just outside Bertram. It even carried a home about a football field distance away. The home is still standing, the family of four inside was not hurt. Surveyors with the National Weather Service said they haven’t seen anything like this. They spent the day there following the path of the tornado…”
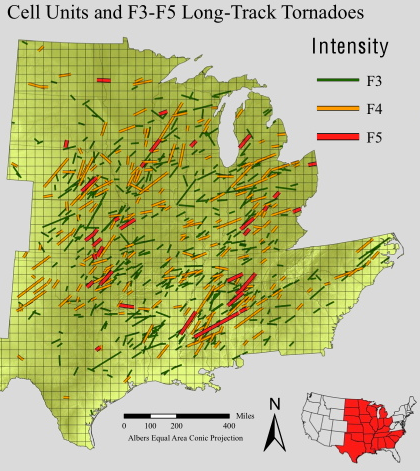
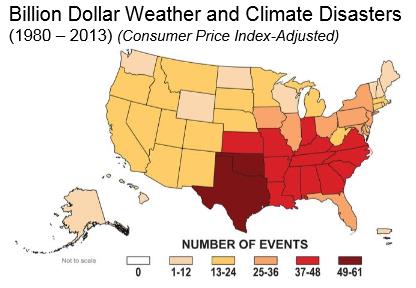
Real Tornado Alley Much Farther South. Are we seeing an eastward shift in Tornado Alley over time, or is this just a function of tornadoes impacting more populated regions of the USA? Here’s an excerpt of an AP story at timesdaily.com: “…Oklahoma and Kansas may have the reputation as tornado hot spots, but Florida and the rest of the Southeast are far more vulnerable to killer twisters, a new analysis shows. Florida leads the country in deaths calculated per mile a tornado races along the ground, followed by Tennessee, North Carolina, Ohio and Alabama, according to an analysis of the past three decades by the federal Southeast Regional Climate Center at the University of North Carolina. That’s because Florida is No. 1 in so many factors that make tornadoes more risky: mobile homes, the elderly and the poor, said center director Charles Konrad II, who headed the new work…”
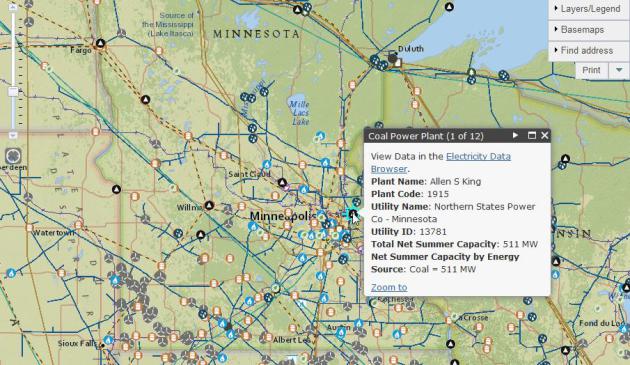
Map Shows Energy Installations In Extreme Weather’s Path. Climate Central just ran a story that caught my eye – here’s a clip: “…Are there natural gas, oil pipelines or electricity transmission lines that could break and leak in the flood or storm surge? Are oil and gas wells nearby that could flood and leach hydrocarbons into the river? Those answers can be found online using the U.S. Energy Information Administration’s interactive U.S. Energy Mapping System, which shows all the major energy infrastructure for any given address in the U.S. It allows anyone to look closely at what power plants, refineries, oil wells, power lines and other installations might exist in a place that is vulnerable to extreme weather…”
Interpreting How Climate Change Affects Extreme Events. Here’s a good 2 page overview (PDF) from NOAA. An excerpt: “The vulnerability of coastal regions to storm surge flooding is expected to increase with future sea level rise and coastal development, although this vulnerability will also depend on future storm characteristics. It is virtually certain (99-100% chance) that the frequency and intensity of daily heat extremes will increase, and there will be fewer cold extremes. It is very likely the frequency of heavy precipitation events will increase over many regions, but there is uncertainty around effects on flooding in specific areas…”
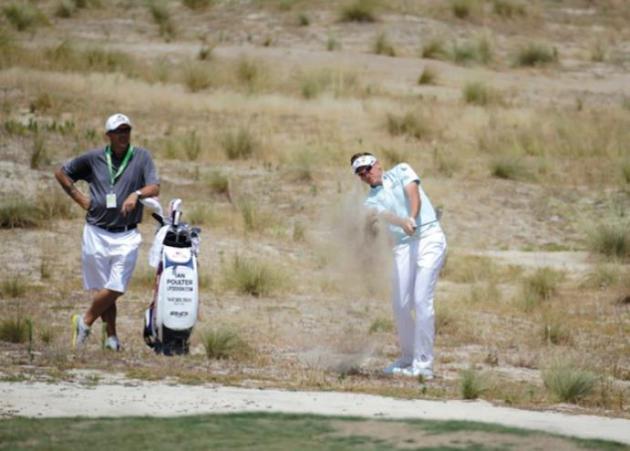
Brown Is The New Green at U.S. Open: Water is “Biggest Obstacle” Facing Golf, Says USGA. Joe Romm has an interesting angle for anyone who likes golf (or water!) at ThinkProgress; here’s a clip: “If you tune into the U.S. Open golf championship this Father’s Day weekend, you may think you’re watching the Dubai Desert Classic or the infamous “Brown British Open.” But the U.S. Golf Association wants you to know that what you’re really seeing at Pinehurst #2 in North Carolina is the future of golf. The Washington Post reports that USGA executive director Mike Davis said this week:
“We happen to think that, long term, water is going to be the biggest obstacle in the game of golf…. It’s not going to be a question of cost. It’s a question of: Will you be able to get it?”
Brown is the new green. Or, rather, browns are the new greens…”
Photo credit above: “Ian Poulter practices on fifth hole of U.S. Open in Pinehurst, NC. The course has slashed water use, a future in store for many courses, thanks to man-made climate change.” (Photo: AP)
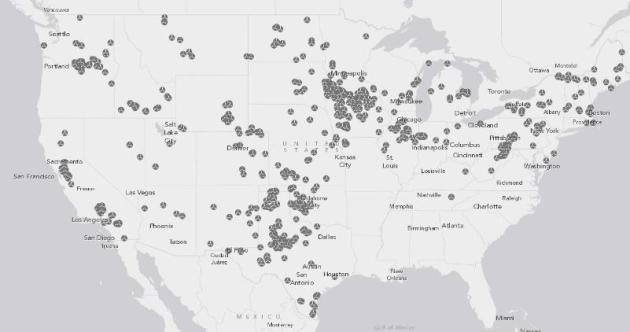
11 Maps That Explain The U.S. Energy System. Vox has a fascinating article that helps to put things into perspective; here’s an excerpt: “…Wind has been rising fast, albeit from a low base. In 2008, wind provided about 1 percent of the nation’s electricity. That rose to 3.6 percent in 2012 and 4.1 percent in 2013. There are two big reasons for that rapid growth: The federal government has provided both tax credits and subsidies (with a big boost in the 2009 stimulus bill). What’s more, many states now have laws requiring utilities to get a certain portion of their electricity from renewables. (One notable exception here is the Southeast.)...”
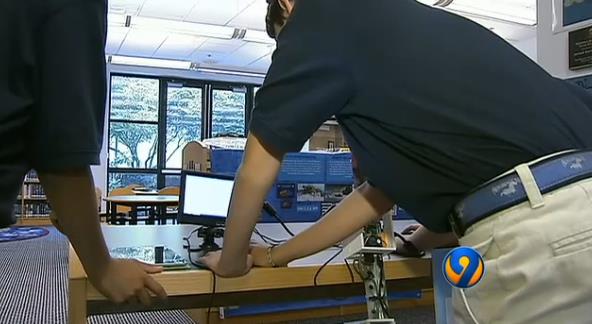
Are You Smarter Than a 6th Grader? Our kids and grandkids will be cleaning up many of our messages, and you can’t help but be impressed with a group of 6th graders in Charlotte, North Carolina, building apps (!) to lower the risk of flood disasters. Here’s a video and excerpt from WSOC-TV: “A group of 6th graders in Charlotte created a flood level detection device and smartphone app to alert people when there is flooding in their neighborhood. The device is such a success the team won a regional science completion and is headed to Washington D.C. on Monday. A state of emergency was declared in North Carolina last summer due to summer floods that left the western part of the state under water. It was the worst flash flooding the area has seen in decades. This device was made to help better prepare people for situations like this…”
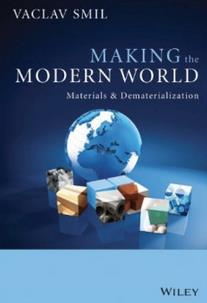
Have You Hugged A Concrete Pillar Today? I tend to take so much for granted, including the materials that power modern life. Bill Gates has an interesting review – and how we need to find new energy-efficient ways of powering our economies, at Quartz; here’s an excerpt: “…This isn’t just idle curiosity. It might seem mundane, but the issue of materials—how much we use and how much we need—is key to helping the world’s poorest people improve their lives. Think of the amazing increase in quality of life that we saw in the United States and other rich countries in the past 100 years. We want most of that miracle to take place for all of humanity over the next 50 years. As more people join the global middle class, they will need affordable clean energy. They will want to eat more meat. And they will need more materials: steel to make cars and refrigerators; concrete for roads and runways; copper wiring for telecommunications…”
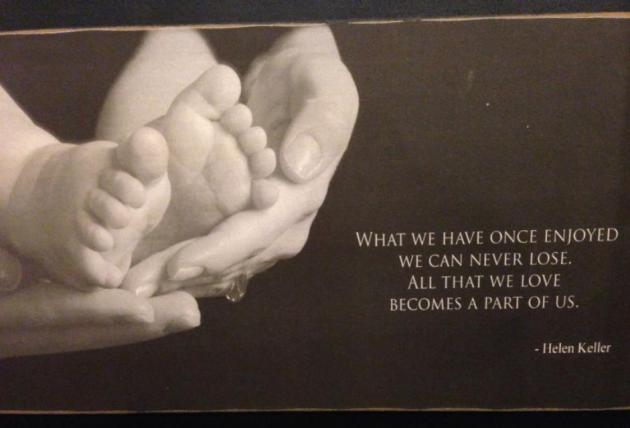
10 Favorite Quotes About Fathers. There are a few great ones in here – thanks to PBS Next Avenue for sharing these: “There’s no denying that fathers play a special role in their children’s lives. Whether it’s patiently teaching us how to cast a fishing line, encouraging us to follow our dreams, or simply working hard to provide opportunities, dads remind us over and over again that love can be expressed in many different ways. In honor of Father’s Day, here is a selection of quotes that capture the trials and triumphs of fatherhood…”


FATHER’S DAY: Flash Flood Watch. Heavy rain early, drying out late. Flash Flooding risk into early afternoon. Winds: S/SW 15-25. High: 76
SUNDAY NIGHT: Partial clearing. Low: 62
MONDAY: Sticky sun, more T-storms late. High: 86
TUESDAY: Hot sun, steamy. Dew point: 67 Wake-up: 70. High: near 90
WEDNESDAY: Free sauna. Few pop-up T-storms. Wake-up: 71. High: 88
THURSDAY: More numerous T-storms. Dew point: 68. Wake-up: 71. High: 83
FRIDAY: Unsettled, lingering showers. Wake-up: 63. High: 77
SATURDAY: Partly sunny, find the sunscreen. Wake-up: 62. High: 84
Climate Stories.
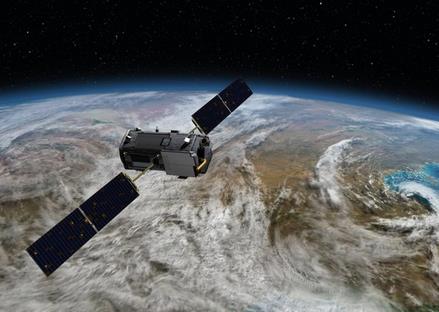
NASA To Launch First Satellite To Chart Levels of Carbon Dioxide in Atmosphere. Bloomberg has the details; here’s the introduction: “The National Aeronautics and Space Administration plans to launch July 1 its first satellite dedicated to measuring carbon dioxide levels in Earth’s atmosphere. The $465 million Orbiting Carbon Observatory-2 (OCO-2) mission seeks to provide a more complete picture of human and natural sources of carbon dioxide globally, as well as sinks where carbon dioxide is absorbed. On average, the Earth’s plants and oceans absorb about half of the nearly 40 billion tons of carbon dioxide added to the atmosphere each year from the burning of fossil fuels and other human activities…”
Photo credit above: JPL/NASA “NASA’s Orbiting Carbon Observatory-2 (OCO-2) satellite, dedicated to measuring carbon dioxide levels in Earth’s atmosphere.”
Global Climate Change Is Worsening Instability And Making It Harder To Keep The Peace. Just another rant from a flaming liberal with an ax to grind? Not quite. Here’s an excerpt from at Huffington Post: “…From rising sea levels to increased frequency and intensity of extreme weather events such as droughts, floods, and storms, to resource scarcity, the effects of climate change are already exacerbating security risks abroad and threatening our military installations here at home, putting critical infrastructure at risk. In Pakistan, record-breaking floods in 2010 inundated more than one-sixth of the country, rendering large swaths of ungovernable territory vulnerable to recruitment efforts from extremist groups. In Syria, the historic five-year drought from 2006 to 2011 destroyed livelihoods for millions of rural farmers and herders, who then sought relief in urban centers that were not prepared to accommodate the overwhelming influx of people…”

Climate Change Historians Will Look Back And Ask “Why Didn’t They Act?” Because of greed, special interests, ignorance, inconvenience and inertia. Here’s an excerpt from The Guardian: “Most historians think about the past. Some study the present. Very few, it has to be said, write about the future. But Naomi Oreskes, a Harvard professor in the history of science, believes that our inertia in the face of climate change will puzzle academics for centuries to come. “The historian of the future will look back on today and ask, what happened? Why didn’t they act on what they knew?” she says in her sunny office in Cambridge, Massachusetts, surrounded by rocks that speak of her own past as a geologist. Oreskes’ latest book, The Collapse of Western Civilization: A View from the Future, imagines a Chinese scholar in 2393 analysing the slow-motion disintegration of 21st-century democracies as they fail to tackle a growing environmental catastrophe…”
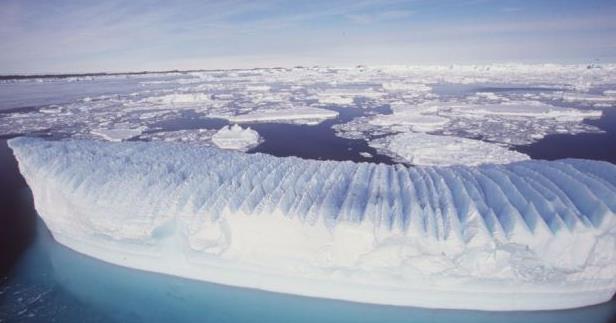
Apparent Pause In Global Warming Blamed on “Lousy” Data. Sea levels continue to rise, a byproduct of steady warming of the world’s oceans. Here’s an excerpt from a story at The Guardian: “A widely reported “pause” in global warming may be an artefact of scientists looking at the wrong data, says a climate scientist at the European Space Agency. Global average sea surface temperatures rose rapidly from the 1970s but have been relatively flat for the past 15 years. This has prompted speculation from some quarters that global warming has stalled. Now, Stephen Briggs from the European Space Agency’s Directorate of Earth Observation says that sea surface temperature data is the worst indicator of global climate that can be used, describing it as “lousy”. “It is like looking at the last hair on the tail of a dog and trying to decide what breed it is,” he said on Friday at the Royal Society in London…”
Photo credit above: “The belief that global warming has paused is based on the stability of sea surface temperatures over the past 15 years.” Photograph: Image Source/REX.

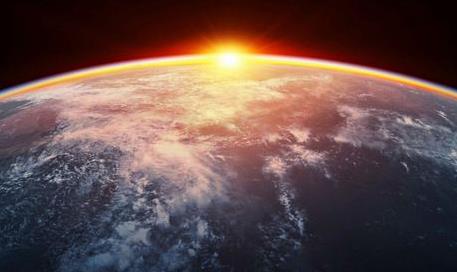
Don’t Give Climate Deniers Equal Time. I’ll be happy to debate climate science, right after the debate on gravity and the the (alleged) curvature of the Earth. I think NASA is touching up those photos from space (did we even go into space?) Because the Earth sure looks flat outside my window. Here’s an Op-Ed at philly.com: “…One of the most important strategies we could employ to stop climate change is for the media to stop giving time and space to climate-change deniers. There is only one side of this story: Climate change is real, it is happening now, we are the cause, and it will be worse than we predicted. The real story that should be covered is why, in the face of overwhelming, unequivocal evidence, do people still deny climate change? Is it lack of environmental literacy? Is it due to either political or financial self-interest? Why?…” (Photo credit: Shutterstock).
