Turning of the Wheel
This is a test. This is only a test. Can you keep your sense of humor, a sunny sense of long-range optimism, while knee-deep in slush – on the 5th day of April?
I’m developing a severe case of weather-amnesia, but a reader reminds me we picked up nearly 18 inches of snow last April. The latest 30 year average is 2.4 inches in April, if anyone has the courage to ask.
More fun with weather statistics: NOAA reports the period from December 1 to March 31 averaged 13.8F; the 10th coldest such stretch on record and the coldest since 1936. Have a nice day!
Target Field will be miraculously devoid of slush for Monday’s Twins Opener; temperatures in the 50s with a stray (rain) shower. ECMWF guidance even hints at a few glorious 60s next week.

The wheel is turning, the cycle is shifting. My (few) supernaturally serene Buddhist friends describe the yin and yang of everyt4hing including the weather. Less yin, please. Temporary pain, but no long-term weather suffering, as spring finally surges into Minnesota next week.
The extended outlook calls for more whiplash. The maps I’m staring at hint at 60s, strong thunderstorms and potential flash flooding the weekend of April 12-13.
Like turning on a light switch.
Let’s start with the good news:
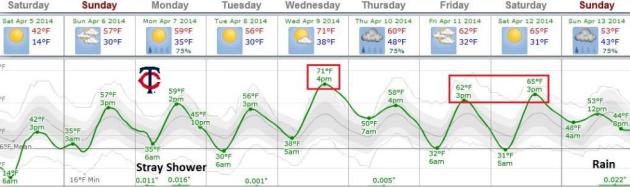
From Slush To Thunder In A Little Over A Week? ECMWF guidance shows mellowing temperatures over the weekend; 50s expected for the Twins Home Opener Monday at Target Field. After cooling down slightly on Tuesday we warm to near 70F on Wednesday, 60s again late next week. The European model is hinting at a vigorous warm front the weeekend of April 12-13, possibly capable of showers and even a few heavier T-storms. Any heavy rain falling on frozen ground will quickly result in run-off and possible urban street flooding issues. Too early to tell with any confidence, but we’ll keep an eye on it.
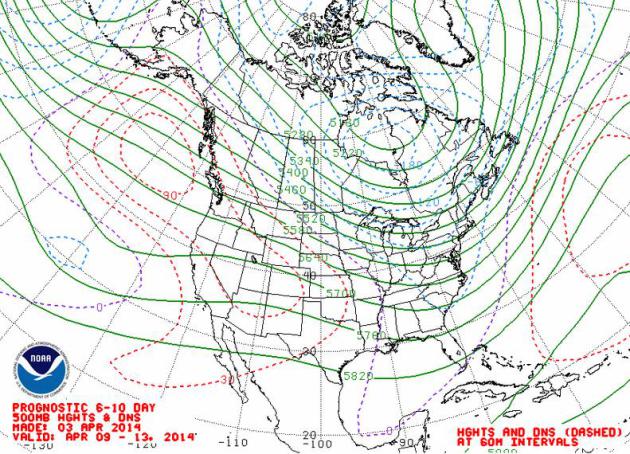
Modified Zonal Flow. Finally! The maps are finally starting to take on a more springlike appearance over the northern USA, with winds aloft forecast to blow from Seattle and Vancouver (instead of the Yukon) between April 9-13. The Big Melt is almost here. 500 mb map above: NOAA.
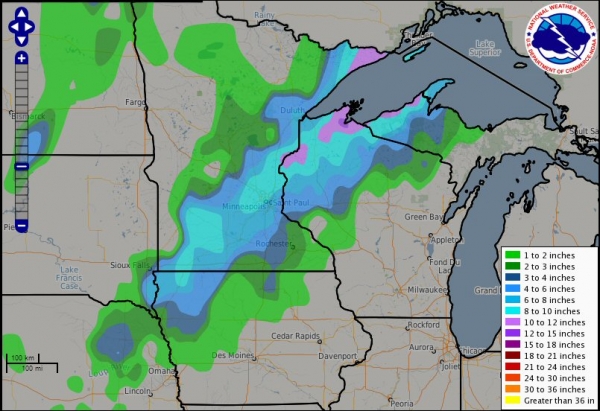
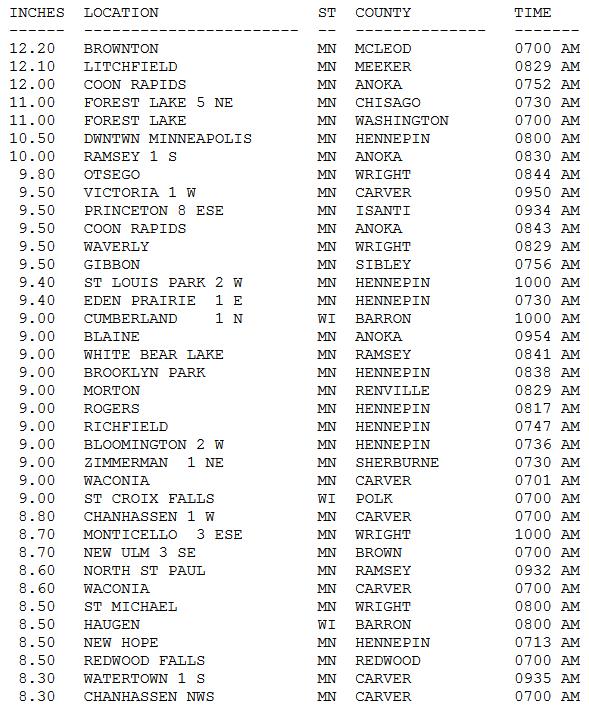
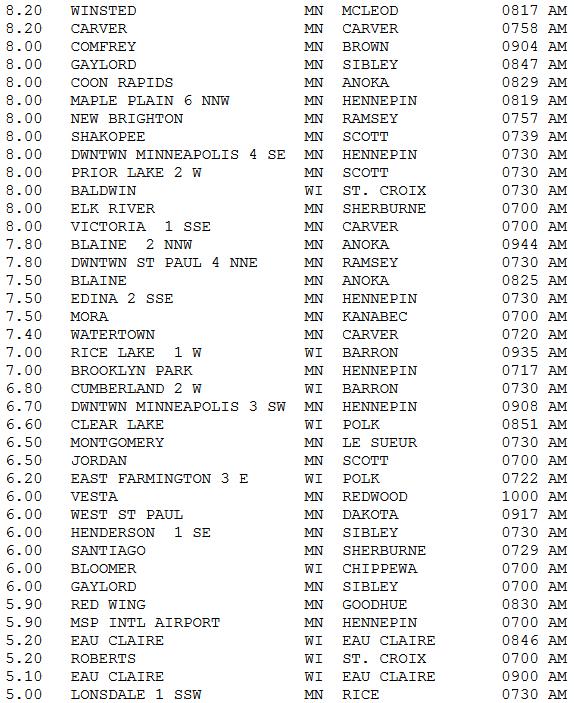
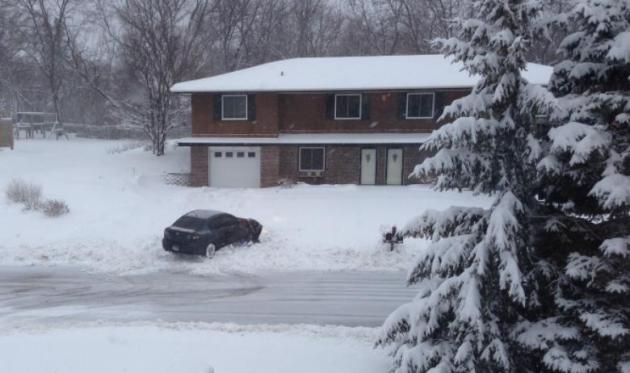
Preliminary Snowfall Totals. As expected a (very) plowable snowfall event materialized from northwest Iowa into much of Minnesota and northwest Wisconsin, as much as 10″ in the suburbs of the Twin Cities, where travel conditions will slowly improve this afternoon. For the northern USA spring is coming reluctantly again this year. Here is a list, courtesy of the local Twin Cities National Weather Service, how how much fell. As much as 10-12″ caked a few northern suburbs, but most amounts were in the 4-9″ range. Quite enough, thank you.
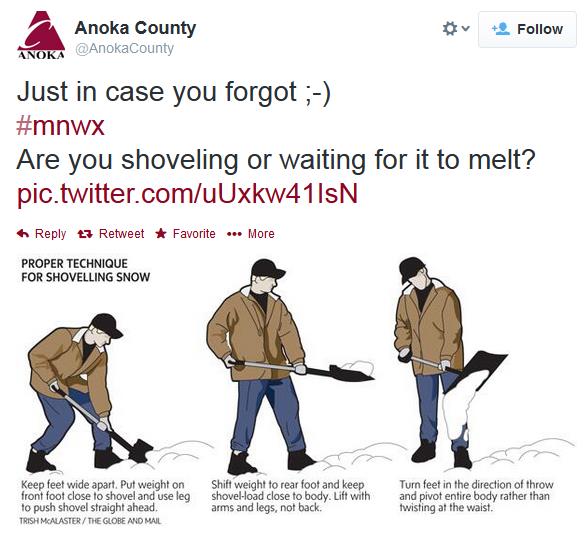
Timely Shoveling Tips. Thanks to Anoka County for passing this along – a reminder that the snow that fell Thursday night and Friday morning had a very high water content. Some call this “heart attack” snow because it’s much harder to get off your driveway than a light, fluffy January snowfall. Be careful out there.
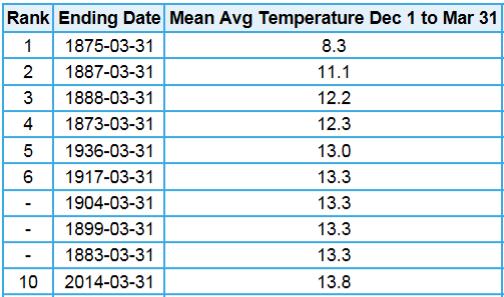
December Thru March: Coldest Since 1936. Unless I’m missing something here, which is entirely possible considering how sleep-deprived I am, the 4 month period from December 1, 2013 thru March 31, 2014 was the 10th coldest on record, and the coldest for MSP since 1936. Yep, I’d say we’re all ready for spring right about now. Details from NOAA here.
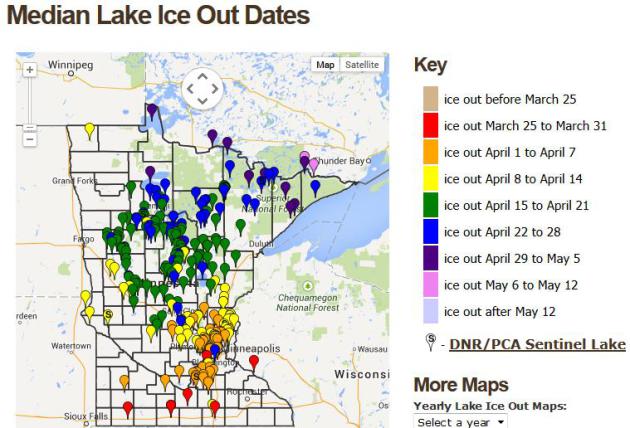
A Late Ice-Out? Even with a rapid thaw next week with 50s and 60s odds favor a later ice-out than usual on Minnesota lakes, maybe 1-2 weeks later. Here’s an excerpt of a post from The Minnesota DNR: “…Given present ice conditions, and the forecast for continued cool weather, it is unlikely that lake ice out dates will be earlier than historical median dates. However, the question of how long ice out will be delayed beyond the historical median dates is impossible to answer.”
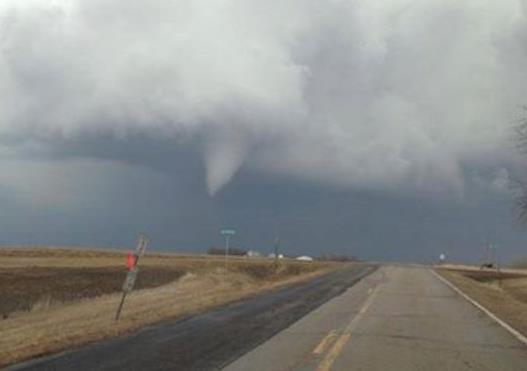
More on Monday’s Rare “Blizz-nado”. Dr. Mark Seeley has a unique perspective of Monday’s unusual March tornado near St. Leo, touching down in a county under a Blizzard Warning at the time – along with a few nuggets I was not aware of. Here’s an excerpt from this week’s Minnesota Weathertalk: “Can a tornado, thunder-snow, and a blizzard converge on the same geography on the same day? Yes, apparently. Earlier this week on March 31st a strong winter storm crossed the Dakotas and Minnesota bringing a variety of weather. Ahead of the storm temperatures in southwestern Minnesota soared into the upper 50s F (61 F at Marshall), then high winds, rain, freezing rain, sleet, and snow brought blizzard warnings to many western counties, including Yellow Medicine and Lac Qui Parle. At 4:10 pm a Yellow Medicine County Sheriff confirmed a tornado touched down near St Leo causing damage to some nearby farm buildings. This tornado was rare in historical terms, just the 21st such storm reported in the month of March during the modern era (post 1950), but it was remarkably rare and perhaps the only case in state history where a tornado was confirmed in a county with an active blizzard warning! The real blizzard conditions that day ended up further north in the Red River Valley which reported its 11th blizzard of the 2013-2014 season, accompanied by thundersnow. The last March tornado reported in Minnesota was during the unusually warm spring of 2012 on March 19 near Elysian (Le Sueur County)...”
Photo courtesy of KARE-11 and Ronni V, via Facebook.

Alerts Broadcaster SitRep: Excerpt of a report issued Friday morning, April 4, 2014.
General reports
– 8 confirmed tornado reports yesterday, per the SPC. At least 3 in Texas, 2 in Missouri, 1 in Illinois (tough to tell on the map)
– Over 200 reports of wind/hail
– More than 37,000 without power (as of 2 AM) in Arkansas
– Nearly 3,000 without power in northern Ohio
– “Several thousand” power outages in NE Texas
– About 3,000 without power in Missouri as of late yesterday
– 7.17″ of rain in St. Ann, MO (near St. Louis), 5.87″ in Jefferson City, MO
-Over 5″ in Evansville, IN
Thursday Storm Reports. Here’s a map showing the location of the 8 tornado touch-downs, damaging winds, hail and flash flooding reports, courtesy of NOAA and Ham Weather.
| 2302 | RICH FOUNTAIN | OSAGE | MO | 3840 | 9188 | CONFIRMED TORNADO SPOTTED BY MISSOURI TROOP F (LSX) | |
| 0027 | PRINCETON | COLLIN | TX | 3318 | 9650 | HAMS REPORTED THAT TORNADO CROSSED HWY 380 AT NORTH 6TH STREET (FWD) | |
| 0107 | 5 NE DONIPHAN | RIPLEY | MO | 3667 | 9076 | (PAH) | |
| 0111 | 5 NE FAIRDEALING | BUTLER | MO | 3671 | 9055 | (PAH) | |
| 0222 | 3 S COOPER | DELTA | TX | 3333 | 9568 | BRIEF TORNADO BETWEEN COOPER AND COOPER LAKE (FWD) | |
| 0229 | SHAWNEETOWN | GALLATIN | IL | 3771 | 8817 | UNCONFIRMED (PAH) | |
| 0245 | MOUNT VERNON | FRANKLIN | TX | 3317 | 9522 | TORNADO ON THE GROUND NORTH OF MOUNT VERNON ALONG HIGHWAY 37. (SHV) | |
| 0246 | 5 NNW MOUNT VERNON | FRANKLIN | TX | 3324 | 9525 | BARN MOVED OFF FOUNDATION AND SEVERAL TREES DOWN NEAR WHITE OAK CREEK BOTTOM (SHV) |
Tornado Reports.
* The list above is from NOAA SPC, with details on each tornado touchdown yesterday. Some of the most extensive damage was in and around Denton, Texas, just north of Dallas.
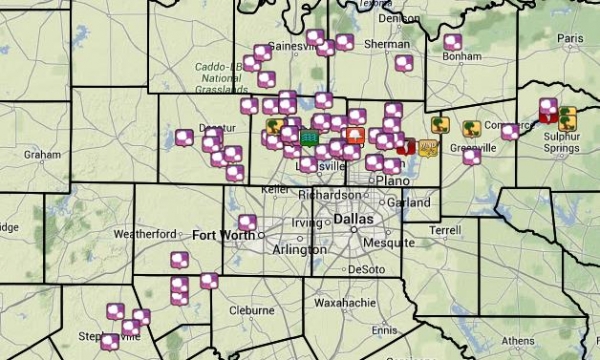
Texas Touch-Downs. The map above shows the hail swaths and tornado touchdowns from near Denton to Sulphur Springs, Texas, with the majority of the severe weather tracking just north of Dallas and Plano. A close call indeed. NOAA has more details here.
Hail
-1.75″ hail – Commerce, TX
-1.75″ hail – Orange Grove, TX
-1.5″ hail – near Pearsall, TX
-1″ hail – Lewisville, AR
-1″ hail – Jackson, TN
-0.88″ hail – Texarkana, AR
-0.88″ hail near Walnut Hill, IL
Winds
65 MPH wind gust in Olive Branch, MS
64 MPH wind gust in Cullman, AL
60 MPH wind gust in Robinsonville, MS
60 MPH wind gust in Dubach, LA
59 MPH wind gust near Metcalfe, IN
Snow
-12.5″ of snow in Mouth of Brule, MN
-12.5″ of snow in Oulu, WI
-12″ of snow near Redridge, MI
-12″ of snow in Hawthorne, WI
-11.3″ snow in Hutchinson, MN
-11″ snow in Winchester, WI
-10.5″ of snow two miles from downtown Minneapolis
-9.8″ of snow in Superior, WI
-8.8″ of snow near Chanhassen, MN
-4.8″ of snow near Northwood, IA
Paul Douglas – Senior Meteorologist – Alerts Broadcaster (with special thanks to WeatherNation TV meteorologist Chris Bianchi for helping me compile these severe weather reports and updates).
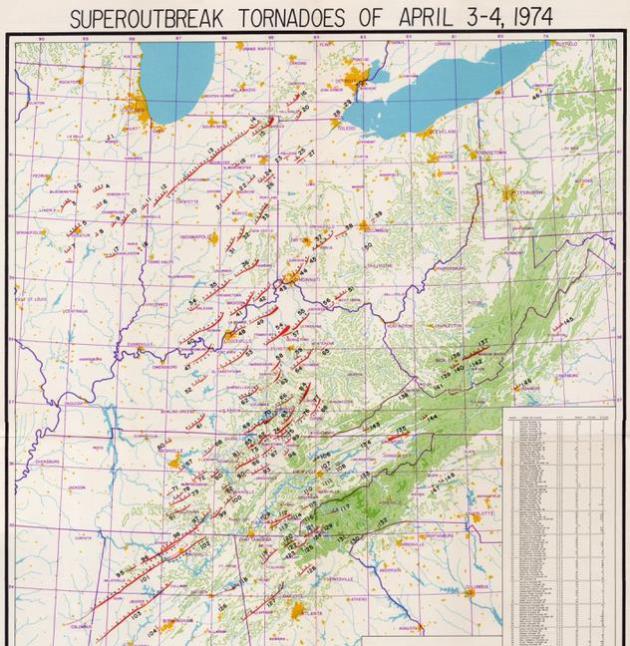
Tornado Technology Innovation Born From 1974 Tragedy. It’s hard to believe it’s been 40 years since the “Super Outbreak”, 150 tornadoes in 13 states, but that swarm, a record at the time, set the stage for new technologies and innovations that have dramatically lowered the death toll from these fickle storms. Climate Central has more details; here’s a clip: “…Tornado prediction has also dramatically improved. To illustrate some of those advancements, the Storm Prediction Center used observations of conditions that preceded the 1974 storm and ran computer models on Wednesday to see how well they could forecast the outbreak if it happened today. It turns out the models were able to identify conditions that were conducive for tornadoes to develop in a number of locations where twisters did touch down in 1974…”
Graphic credit above: “A hand-drawn map by Ted Fujita showing the 1974 Super Outbreak of tornadoes in the U.S.” Credit: National Weather Service, Wilmington.
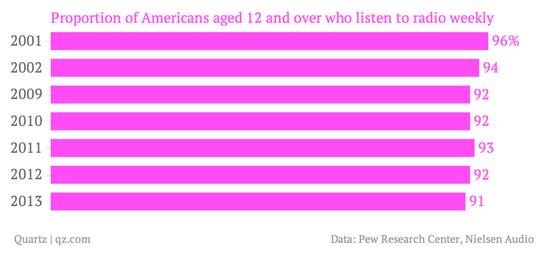
The Remarkable Resilience Of Old-Fashioned Radio In The U.S. Most of us are still stuck in our cars, listening to terrestrial radio. Satellite radio hasn’t made much of a dent, overall. Will that change with Internet-connected vehicles coming on line, when you can suddenly call up Spotify or Pandora and listen to your own custom play-list? Quartz takes a look; here’s an excerpt: “…Yet while old-fashioned radio has proved remarkably resilient up until now, it could be approaching an inflection point thanks to the advent of the internet-connected car. GMSA, an industry group representing mobile operators, last year said it expects 50% of all new vehicles (pdf) sold by 2015 to be internet-enabled, and 100% by 2025. Internet radio services give listeners a near-infinite amount of options, and advertisers the ability to target specific audiences, but they also face disadvantages…”
TODAY: Plenty of sunshine. Slushy meltdown. Winds: S 10-15. High: 45
SATURDAY NIGHT: Clear to partly cloudy, not as chilly. Low: 36
SUNDAY: Spring regains its bounce. Milder. High: 56
MONDAY: More clouds – spotty rain shower for Twins Opener? Wake-up: 38. High: 57
TUESDAY: Some sun, a bit cooler. Wake-up: 37. High: 52
WEDNESDAY: Serious jolt of spring fever. Nice! Wake-up: 32. High: 68
THURSDAY: Showers, then windy, cooler. Wake-up: 48. High: 56 (falling by afternoon).
FRIDAY: More sun, more hints of spring. Wake-up: 34. High: near 60
* More 60s are possible the weekend of April 12-13
Climate Stories…
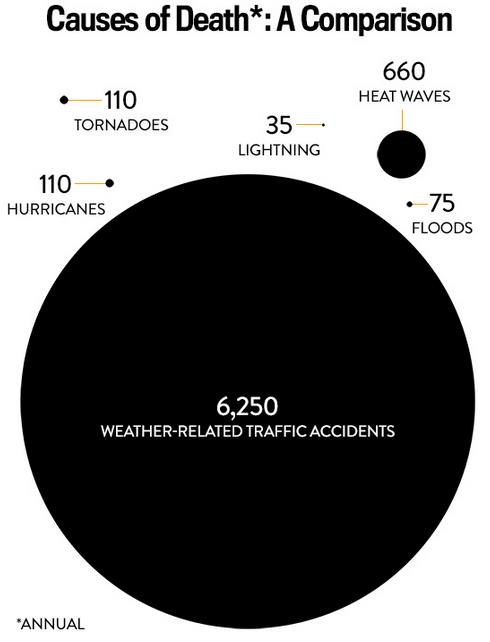
Investing More Money In Tornado Research Would Be A Disaster. Look past the headline to understand the logic behind meteorologist Eric Holthaus’s train of thought and you’ll see the larger point he’s trying to make. Of course we want to improve the technology behind better/faster tornado watches and warnings, but at the expense of climate science? Here’s an excerpt from Eric at Slate: “…Essentially, the bill, which was approved by a voice vote on Tuesday, invests scarce funds in high-profile weather events at the expense of those that cause many more deaths. Boosted by human-caused climate change, heat waves now kill more people in the United States each year than hurricanes, tornadoes, lightning and floods combined, according to the CDC. And weather-related traffic accidents kill 10 times more than heat waves—more than 6,000 people per year...”
Graphic credit above: Data from NWS, CDC and DOT. Infographic by Holly Allen.
Earth Has A Fever, But The Heat Is Sloshing Into The Oceans. Here’s an excerpt from a story at The Guardian: “…Doug McNeall added,
“If you want to measure global warming on timescales of about a decade, measure the temperature of the oceans. The deeper you measure, the more accurately you’ll measure the warming.”
As I’ve said before, there is no “pause” in global warming. The Earth continues to absorb enormous amounts of energy. My own research and my colleague’s have shown this, so too does updated and available data from NOAA. This paper is just the umpteenth nail in the coffin of that myth. It is also a note of caution from this paper: don’t confuse the “slosh” with the “fever”, or you might end up with egg on your face.”
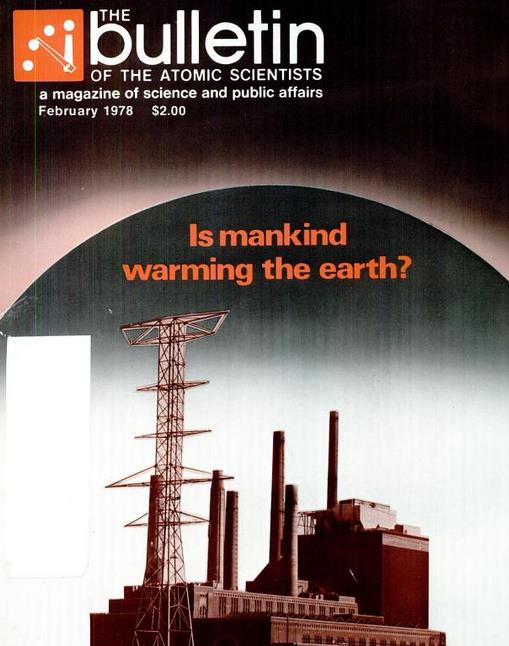
Atomic Scientists Were Right About Climate Change – In 1978. Here’s an excerpt from an eye-opening predicting in the late 70s from The Bulletin of the Atomic Scientists: “…We are surprised and alarmed when an unusually severe winter or an unusually prolonged drought occurs, because our ‘tribal’ memories tend to be too short to recall past years when things were equally unusual. Furthermore, the dim history of periods at the dawn of civilization, when it was considerably warmer or colder for thousands of years on end, have not survived at all as a tribal memory. That longer record is still being laboriously reconstructed, ” wrote meteorologist William Kellogg, of the National Center for Atmospheric Research outside Boulder, Colorado. But Kellogg didn’t write those words for the IPCC. He wrote them for the Bulletin of the Atomic Scientists—more than 36 years ago, in February 1978…”

Climate Change Accelerates. With an eye toward impact on agriculture, here’s a clip from Capital Press: “…USDA is establishing regional climate hubs to help ag producers with accelerating climate change, which is causing erratic weather patterns and extreme events. The scientific community says warming temperatures are behind the changes that are challenging agriculture. USDA has established regional climate hubs across the country to help farmers, ranchers and forest landowners adapt to a climate that is changing more quickly than it has in the past…”

Tail Risk vs. Alarmism, by Kerry Emanuel. Are climate scientists being alarmist in their predictions? I’d argue that many of the trends we’re seeing, especially with Arctic ice melt, rising sea levels and ocean acidification are, in fact, alarming. This is a classic case of risk management, explained in this excerpt from The Climate Change National Forum; here’s an excerpt: “…In assessing the event risk component of climate change, we have, I would argue, a strong professional obligation to estimate and portray the entire probability distribution to the best of our ability. This means talking not just about the most probable middle of the distribution, but also the lower probability high-end risk tail, because the outcome function is very high there. For example, here is an estimate of the probability distribution of global mean temperature resulting from a doubling of CO2 relative to its pre-industrial value, made from 100,000 simulations using an integrated assessment model. (We use this here as an illustration; it should not be regarded as the most up-to-date estimate of global temperature increase probabilities.)….
