44 F. high in the Twin Cities Saturday.
30 F. average high on December 5.
32 F. high on December 5, 2014.
1″ of snow on the ground at KMSP
December 6, 1950: A snowstorm hits Duluth with 23.2 inches of snow in 24 hours, and a storm total of 35.2 inches.
December 6, 1939: Warm weather occurs over parts of Minnesota. The high temperature hits 62 at New London.

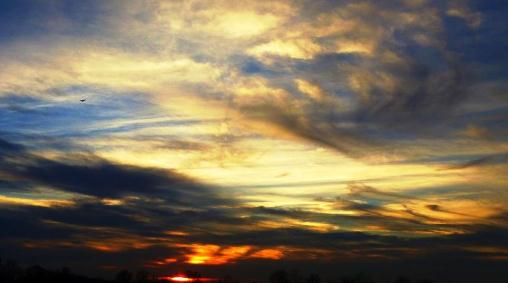
Green Lawns & Open Water
What is Going On?
The symptoms of a warming climate are becoming harder to deny. Like 4 separate thousand-year floods in Minnesota since 2004. Or 50F and rain in December. This is “weather” but all weather is being flavored by warming now underway.
“All of our current weather is impacted by human emissions of heat-trapping gases” St. Thomas climate scientist John Abraham e-mailed. “What that means is every drought, storm, and heat wave is made stronger because of humans. That means they cost more in terms of lives and destruction.”
More CO2 is adding 400,000 Hiroshima-sized bombs worth of heat to Earth’s system daily; 93 percent of that warmth is going into the oceans. Now that heat is coming out of the Pacific in the form of a turbocharged El Nino, maybe the biggest ever recorded.
Today will be gray and foggy but 40s linger most of this week; a few newly snowless towns may report 50F midweek. Rain showers are possible late Tuesday; again Thursday as a puff of Canadian air arrives. More mid-March than mid-December.
The chance of a big rain storm next weekend has diminished; ECMWF (European) guidance pulls seasonably cold air back into the Midwest next week. Keep the coats handy.
But in the meantime I’m tempted to put my dock back in and do a little waterskiing. In Minnesota. In December.
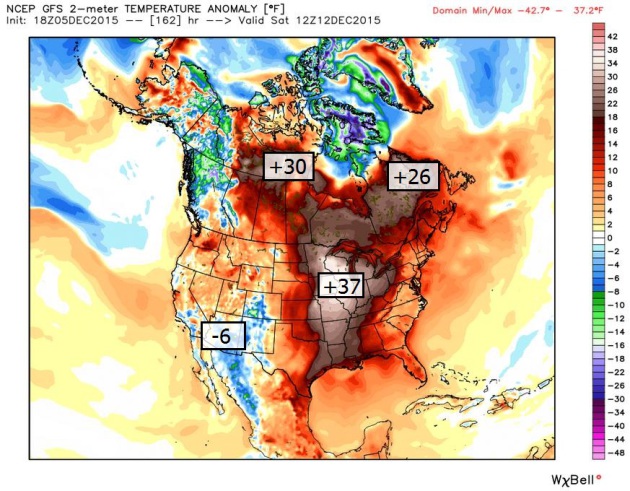
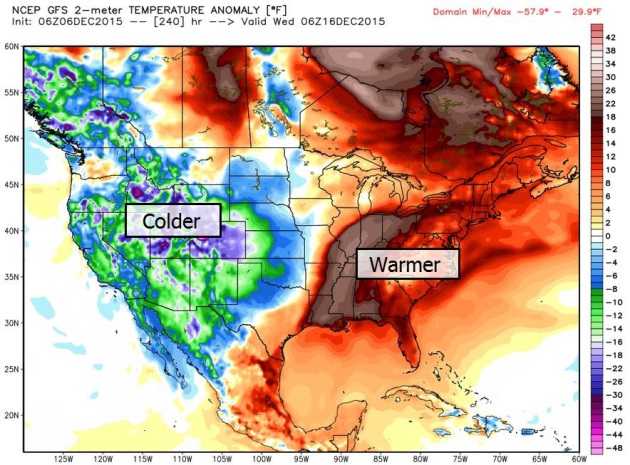
Warmth: Impressive in Scope and Intensity. The forecast temperature anomalies (in Fahrenheit) Saturday morning show a huge area of relative warmth; temperatures forecast to be as much as 25-35F warmer than average for December 12. This will manifest itself in a series of records, mostly record-warm nighttime mins. Map credit: Weatherbell.
Back to “Average” by the Middle of Next Week. GFS guidance shows a warm ridge over the eastern USA most of next week; temperatures dropping well below average from the Plains across the western half of the USA – temperatures (finally) cold enough for snow across Minnesota by Tuesday night.
More Vague HInts of March This Week. NAM guidance shows the spastic journeys of the 32F isotherm over the next 84 hours (highlighted in orange). For at least the next 4-5 days nighttime lows will be a few degrees warmer than average highs this time of year. Source: NOAA and AerisWeather.
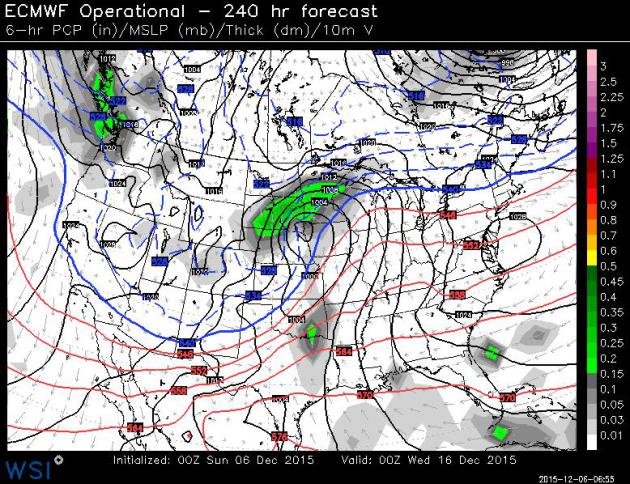
Accumulating Snow a Week from Tuesday? It’s early and as good as the ECMWF is I’m skeptical of any 240 hour forecast. Disclaimer aside it will be (marginally) cold enough for snow next week; European guidance brings a smear of accumulating snow into western and central Minnesota next Tuesday night. Source: WSI.
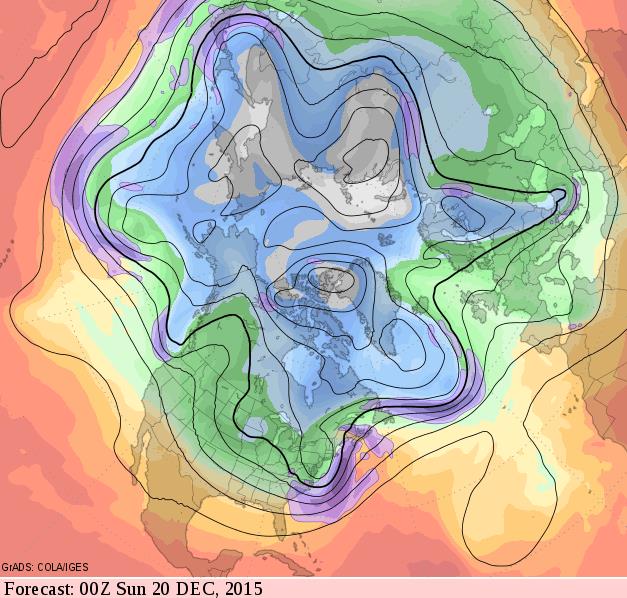
A Little Snow for Christmas? Although we’re still forecast to be in a modified zonal flow by Saturday evening, December 19, a few waves or troughs of low pressure embedded in the flow are capable of giving us a series of (minor) snowfalls. I don’t see the big one between now and Christmas, but I’ll keep looking.
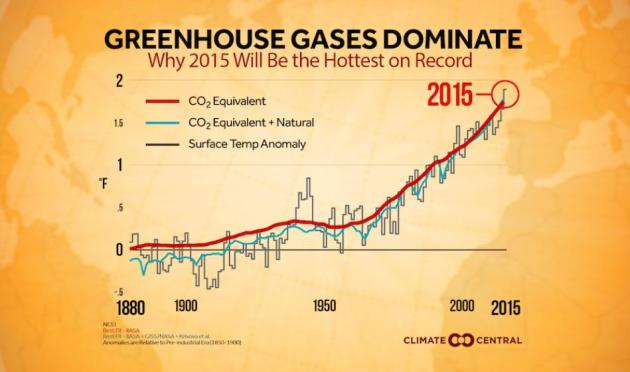
Global Warming Key Driver of 2015’s Record Heat. Is it El Nino, or global warming, or some symbiotic mash-up of both? Here’s an excerpt from Climate Central: “It is virtually certain that 2015 will be the warmest year on record, with one of the strongest El Niños ever recorded combining with manmade warming to send global temperatures soaring. But which of these is more responsible for the record heat this year? Global warming fueled by the buildup of heat-trapping gases in the atmosphere is the overwhelming contributor, according to a new analysis by scientists involved with Climate Central’s World Weather Attribution program and at the University of Reading. That analysis, which broke down the effects of a number of different possible influences on the global temperature, found that El Niño provided only a relatively small, though still noticeable, assist. And with 2015 not even officially yet in the record books, 2016 could see even more of a warming boost from El Niño, thanks to the delayed effect it has on temperatures...”
Graphic credit above: “The gray line on this graph shows observed surface temperatures from 1880 to 2015. The red line shows the effective temperature forcing of greenhouse gases and aerosols (converted to CO2), and the blue line shows the forcing from both those manmade sources and natural factors, like solar radiation. Early on in the temperature record, the red and blue lines diverge because natural factors meant the full impact of greenhouse gases on temperatures wasn’t being felt, but in recent years, the two lines match closely, showing how much greenhouse gases are dominating global temperatures. 2015 is slightly above the red line because of a small push from El Niño as well as even smaller contributions from solar radiation and random weather variations.”
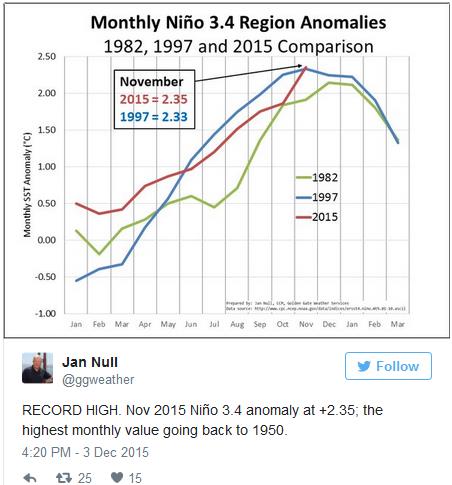
This Remarkably Strong El Nino Has Topped Yet Another Significant Record. The Capital Weather Gang has more details on the persistent and near-record setting warm phase in the Pacific and the implications for the rest of the winter. It is winter, right? “The exceptionally warm waters of the tropical Pacific Ocean have surpassed yet another milestone, pushing this El Niño one step closer to becoming the strongest on record. The strength of El Niño is measured by how abnormally warm the ocean water is in the equatorial Pacific. There are many zones in the Pacific that are used to quantify the strength of an El Niño, including the often-cited Niño 3.4 zone. Ocean surface temperature is measured and averaged over the entire region in periods of a week, a month and three months. The records in this region are typically broken by fractions of degrees…”
A Warm and Wet November. Here’s more perspective on last month, courtesy of Dr. Mark Seeley at Minnesota WeatherTalk: “…November of 2015 ranked as the 4th warmest in history on a statewide basis. Most observers reported a mean monthly temperature that ranged from 7 9F above normal. For the Twin Cities it was also the 4th warmest November since 1872. Over 40 weather observers reported at least one daytime high temperature of 70F or greater. Only a handful reported any subzero temperature readings. With the exception of a few observers in northwestern counties, November of 2015 was wetter than normal, ranking as the 9th wettest historically on a statewide basis. Several observers reported over 4 inches of precipitation for the month. Snowfall generally ranged from 2 to 5 inches, mostly coming toward the end of the month. Isabella, above the shoreline of Lake Superior reported 15.5 inches for the month…”
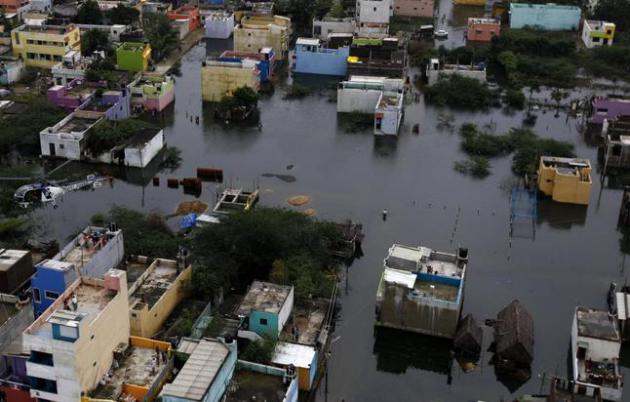
The Chennai (India) Floods are a Devastating Preview of Unnatural Disasters to Come. Here’s an excerpt from meteorologist Eric Holthaus at Slate: “…But there are deeper reasons these floods happened where they did. Like New Orleans in 2005, Chennai has a sharp and growing rich-poor divide, and is near sea level—at the front lines of climate change. Photos of people awaiting rescue from rooftops and highway overpasses are eerily similar to post–Hurricane Katrina New Orleans 10 years ago. Unlike New Orleans, Chennai has a booming economy. Chennai has become one of India’s primary information technology and health care hubs, though like many developing country megacities, its infrastructure has strained to keep up with the rapid growth. For a city built on a floodplain, development has essentially gone unchecked: Critical infrastructure—like the airport, automobile manufacturing plants, and IT centers as well as countless houses—has been built over streams and marshes, and plastic bags clog drainage networks..”
Photo credit above: “A residential area is seen surrounded by floodwaters in Chennai, India, Saturday, Dec. 5, 2015. Although floodwaters have begun to recede, vast swaths of Chennai and neighboring districts were still under 2 1/2 to 3 meters (8 to 10 feet) of water, with tens of thousands of people in state-run relief camps.” (AP Photo/Arun Sankar K).
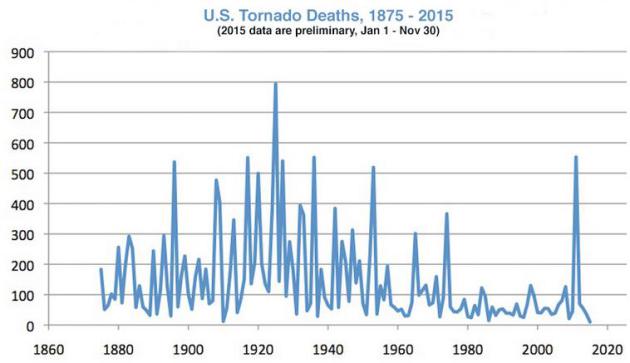
Twisters Give Nation a Pass in 2015: Lowest Death Toll on Record? A low tornado count coupled with better technology and warnings? Here’s an excerpt of an interesting post from Bob Henson at Weather Underground: “Amid all the genuinely awful news making the rounds in recent days, here is one bright spot: the year 2015 may end up with the lowest number of U.S. tornado fatalities in at least 141 years. As of December 2, preliminary numbers from the NOAA Storm Prediction Center show only 10 tornado-related deaths nationwide. If this number holds through the end of the year, it will beat the 12 deaths reported in 1910 to become the lowest annual total on record. NOAA/SPC keeps tabs on tornado statistics, including fatalities, back to 1950…”
Graphic credit above: “Tornado deaths are far below the levels observed prior to the advent of the National Weather Service watch/warning system in the 1950s, although the catastrophic tornadoes of 2011 produced the biggest spike in fatalities in more than 80 years.” Data provided courtesy Harold Brooks, NOAA National Severe Storms Laboratory; data sources are NWS (1950 – 2015) and Thomas Grazulis (1875 – 1949).
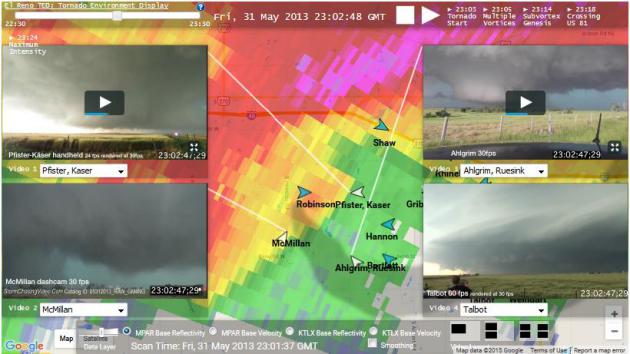
Look Inside Largest Tornado Ever With New Tool. The supercell that spawned the massive 2.6 mile-wide EF-5 in El Reno, Oklahoma on May 31, 2013 produced hail estimated as large as 8″ in diameter. I’ve never seen that before. National Geographic has the story and link to a new visualization tool; here’s an excerpt: “Scientists now have a way to understand the fierce tornado that killed veteran stormchaser Tim Samaras in 2013 in El Reno, Oklahoma. The May 31 storm was the largest ever recorded, and one of the fastest. New software has allowed scientists to piece together video footage of that deadly storm from 45 different stormchasers. The video is synchronized with maps and radar data to create a unique 3-D picture of the tornado. For the first time, scientists can now actually see the “sub-vortex” that spun out of the tornado at 175 miles (280 kilometers) per hour, killing Samaras, his son Paul, and colleague Carl Young...”
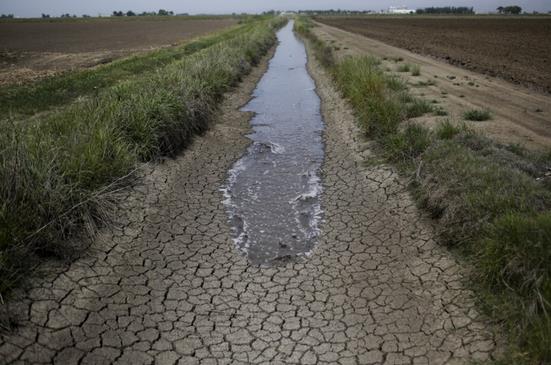
Alarming Research Finds Humans Are Using Up Far More of Earth’s Water than Previously Thought. Here’s an overview and summary of a new research study at The Washington Post: “Freshwater is one of the planet’s most precious resources — and as the global population grows and our demand for water rises, so does the need to carefully monitor its use and availability. Numerous studies have attempted to calculate the amount of freshwater humans consume globally from year to year. But in a worrying new study in the journal Science, scientists argue that we’ve been significantly underestimating our water footprint — in fact, their research raises the estimate of our global water consumption by nearly 20 percent and suggests that we may have crossed an unsustainable threshold in our water use…”
Photo credit above: AP/Jae C. Hong.
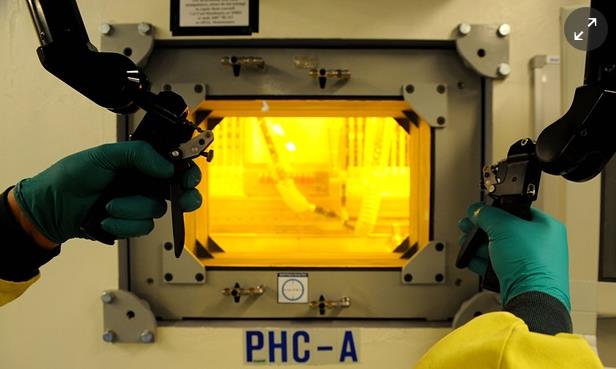
Nuclear Power Paves The Only Viable Path Forward on Climate Change. James Hansen and other scientists argue that only (newer/cleaner/safer) generations of nuclear power will provide electricity at scale that’s needed as we transition to a low-carbon economy; here’s an excerpt at The Guardian: “…Nuclear power, particularly next-generation nuclear power with a closed fuel cycle (where spent fuel is reprocessed), is uniquely scalable, and environmentally advantageous. Over the past 50 years, nuclear power stations – by offsetting fossil fuel combustion – have avoided the emission of an estimated 60bn tonnes of carbon dioxide. Nuclear energy can power whole civilisations, and produce waste streams that are trivial compared to the waste produced by fossil fuel combustion. There are technical means to dispose of this small amount of waste safely. However, nuclear does pose unique safety and proliferation concerns that must be addressed with strong and binding international standards and safeguards. Most importantly for climate, nuclear produces no CO2 during power generation…”
Photo credit above: “A build rate of 61 new reactors per year could entirely replace current fossil fuel electricity generation by 2050.” Photograph: Tracey Nearmy/AAPIMAGE.
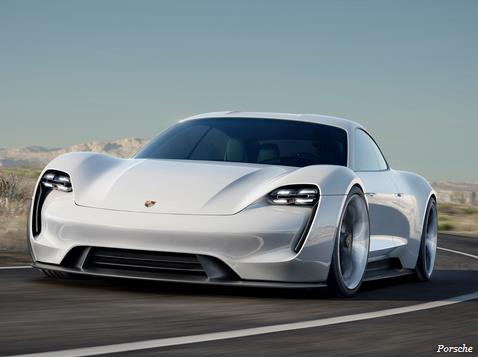
Porsche’s Tesla Killer Is Officially On The Way. Wow. Impressive looking vehicle; hopefully the production version will look as good as the concept; here’s an excerpt at Business Insider: “…The production form of the car is expected to be a four-door, four-seat sedan featuring an all-electric drivetrain producing more than 600 horsepower. Porsche predicts the Mission E will be able to sprint from 0-62 mph in less than 3.5 seconds with a range of more than 310 miles. All of the Porsche’s stats seem to be in the same neighborhood as the benchmark Tesla Model S P90D’s “Ludicrous Mode” 2.8-second 0-60 time, 763-horsepower rating, and 300-mile range. Like the Tesla, the Porsche’s lithium ion battery pack will be stored under the floor of its passenger cabin…”

The Potentially Life-Saving iPhone Feature You Probably Didn’t Notice. I had no idea – but it’s probably a good idea to fill this out. Here’s a clip from Business Insider and Slate: “…Many people keep an emergency contact in their phone, generally labeled as ICE. If you use a passcode for your phone—which you should do—that contact, though, becomes locked underneath your pin code. Last fall, Apple created a new feature called the “Medical ID” which it keeps hidden in the iOS health app. When I talk with people about their phones, it’s often the feature most people have never heard of, but also the one that could save your life. On your medical ID, you can fill out as much information as you want a medical provider (or a snooping colleague) to know, including allergies and your emergency contacts…”

‘Tis the Season of Audi. It’s hard not to be swept up in the commercialism and materialism of Christmas. Doing otherwise feels a little like swimming upstream. Craig Bowron pushes back against the art of the sale at Sojourners; here’s an excerpt: “As in Biblical times, the Christmas season officially begins the day after Halloween, and that’s when the holiday catalogs started showing up. Gird your loins, folks: the Season of Audi has arrive. The deep introspection, the “Emmanuel, God with us” soul-searching can wait until January, when all the hubbub has passed and the bills start arriving. We piled the catalogs up on the dining room buffet as a visual warning against the coming materialistic storm…
TODAY: Clouds and fog – skies may brighten by late afternoon. Winds: NW 5-10. High: 39
SUNDAY NIGHT: Partly cloudy, milder than the average high for December 6. Patchy fog. Low: 30
MONDAY: Intervals of sun, October flashback. High: 45
TUESDAY: Mostly cloudy, few sprinkles? Wake-up: 31. High: 44
WEDNESDAY: Winter in Tulsa. Few clouds, mild. Wake-up: 32. High: 44
THURSDAY: Cool frontal passage. Few rain showers. Wake-up: 36. High: 46
FRIDAY: More clouds than sun. Wake-up: 29. Winds: NW 10-15. High: near 40
SATURDAY: Overcast, sloppy mix late? Wake-up: 28. High: 39
* Photo credit above: Timothy Butz.
Gird your loins, folks: the Season of Audi has arrived.
The deep introspection, the “Emmanuel, God with us” soul-searching can wait until January, when all the hubbub has passed and the bills start arriving.
– See more at: https://sojo.net/articles/tis-season-audi#sthash.KLwI5ng3.dpuf
Climate Stories…
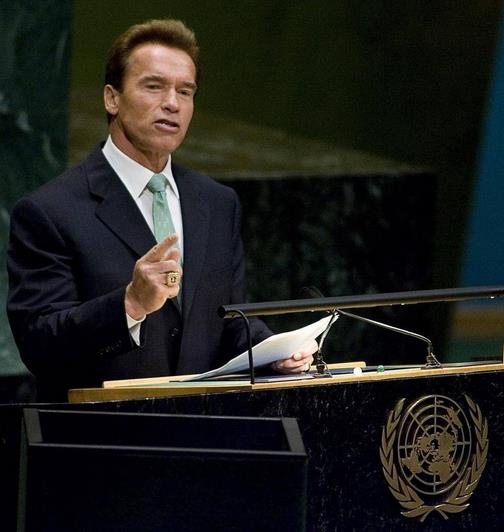
Arnold Schwarzenegger: Simplify the Message on Climate Change. Here’s a clip from The Sacramento Bee: “…We’ve just got to simplify the message,” he said. “We need to have the general public become part of the movement, and the only way the general public becomes part of the movement is if it is a simple message, and if it’s an uplifting message, and if they know that if we don’t go in the right direction it goes south and we’re going to have the consequences of all these people dying. And I think we can do better than that...”
A Lesson from Kyoto’s Failure: Don’t Let Congress Touch a Climate Deal. Here’s a clip from an article at FiveThirtyEight: “…The Paris approach is less ambitious, but it’s probably more realistic. The pledge that his administration submitted to the climate conference — to reduce emissions by 26 percent to 28 percent below 2005 levels by 2025 — relies on actions administered through the Environmental Protection Agency and Department of Energy, which gets around the need for congressional ratification. Republican members of Congress are already fighting these measures, and if a Republican takes the White House, the administrative actions could be undone. While politicians talk about what to do, greenhouse gas emissions continue to rise. Since the Kyoto Protocol was negotiated, the number of weather and climate disasters worldwide has risen 42 percent, and the seas have risen nearly 6.2 centimeters, on average.”
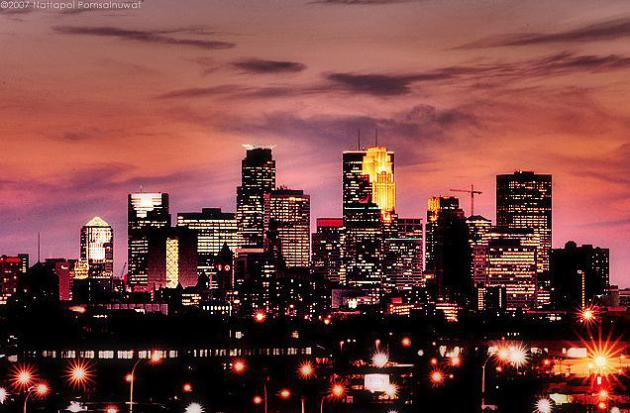
Can Big-City Mayors Help Solve Global Warming? Here’s an excerpt from The Wall Street Journal: “…In the U.S., Democratic-leaning big cities often elect mayors with green planks in their platforms, in contrast to the Republican-dominated U.S. Congress, which has sought to thwart President Barack Obama’s climate agenda. (Mr. Bloomberg, a Republican mayor, backed several major environmental initiatives.) “We don’t find in our city that kind of diversity and divisiveness that you find at the state and national level” on climate change and the environment, said Ralph Becker, the mayor of Salt Lake City. “We have set reducing our carbon emissions as a goal for every project we do.”
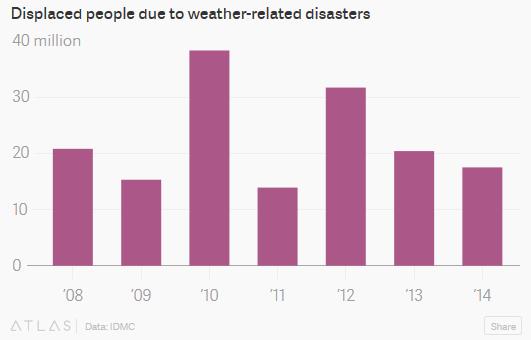
For Climate Change Refugees, It’s Already Too Late to Cut Emissions. Here’s a snippet from Quartz: “…The exact number of climate-change refugees is hard to pin down because migrants are often set off by a variety of factors, experts say, but there could be millions. The Internal Displacement Monitoring Centre estimates that weather-related disasters, which are expected to multiply as temperatures rise, have displaced an average 22.5 million (pdf, page 9) people a year since 2008, the vast majority of them from poor countries...”