64 F. high temperature on Saturday in the Twin Cities.
74 F. average high on May 30.
87 F. high on May 30, 2014.
May 30, 1998: Devastating line of storms hits east central Minnesota. 100 mph winds in Scott and Dakota County. Over 500 homes damaged in Washington County. 15,000 trees lost in the Twin City metro area. 500,000 without power in Minneapolis.
May 30, 1985: Tornado hits Lakefield. The Twin Cities report 67 mph winds.

Minnesota: Retirement Destination?
Like everyone else I have too much on my plate; doing the job of at least 3 people. I’m a meteorologist, also a weather consultant, and a “retirement planner”. People come up and ask me where they should retire.
“What about Florida?” South Florida is probably the most vulnerable region of America as sea levels rise, threatening fresh water supplies. Do NOT buy right on the water – find a place a few blocks inland and be patient. You’ll eventually get your waterfront property. “California, Arizona or Denver?” Sunny, but I worry about future availability of water. New Mexico is probably the safest state, in terms of natural disasters. The Pacific Northwest may fare relatively well, but there’s a slight risk of an 8.0 quake, and less snow in the winter may impact water supplies in Seattle down the road.
I am not being paid by The Minnesota Chamber of Commerce (or FIFA) but my advice: use VRBO to rent homes in the dead of winter but stay put! With abundant water and winters slowly mellowing with time Minnesota will be a net winner as the climate continues to warm.
Compared to much of America our weather remains benign – no controversy or drama. The sun gets tangled up in a cobweb of cirrus clouds today – but showers remain over the Dakotas. Plan on midweek T-storms here; the mercury tops 80F later this week but blast-furnace heat stays to our south looking out 2 weeks.
We’ll be treated to some of the best weather in the USA.
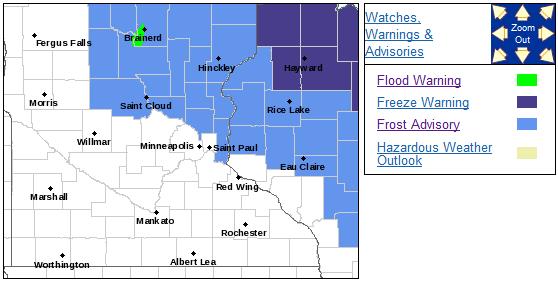
Late-Season Frost Potential. The urban heat island will protect the downtowns and close-in suburbs, but a touch of frost is possible north and east of I-94 early this morning under clear skies with light winds. Freeze Warnings are posted closer to Hayward and Rhinelander.
...FROST ADVISORY FOR PARTS OF CENTRAL MINNESOTA AND WEST CENTRAL
WISCONSIN LATE TONIGHT...

.A FROST ADVISORY HAS BEEN ISSUED FROM 1 AM UNTIL 8 AM SUNDAY
MORNING FOR LOCATIONS MAINLY ALONG AND NORTH OF INTERSTATE 94 IN
CENTRAL MINNESOTA AND WEST CENTRAL WISCONSIN.

AREAS OF FROST ARE LIKELY AS LIGHT WIND AND TEMPERATURES IN THE
MID 30S PROMOTE FROST...DEVELOPING AFTER MIDNIGHT TONIGHT.
TEMPERATURE SENSITIVE OUTDOOR VEGETATION MAY BE DAMAGED IF PROPER
PRECAUTIONS ARE NOT TAKEN.
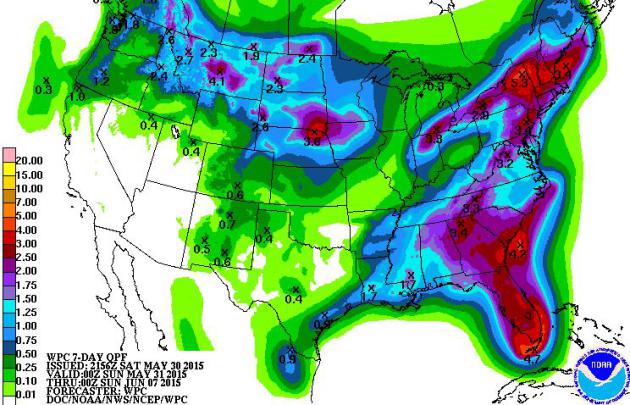
A Soggy, Slow-Motion Pattern. NOAA guidance shows some 3-6″ rainfall amounts from Florida to New England in the next week, sparking sporadic flash flooding. Models continue to print out some heavy rainfall amounts from near Omaha and Sioux Falls into far southern Minnesota.
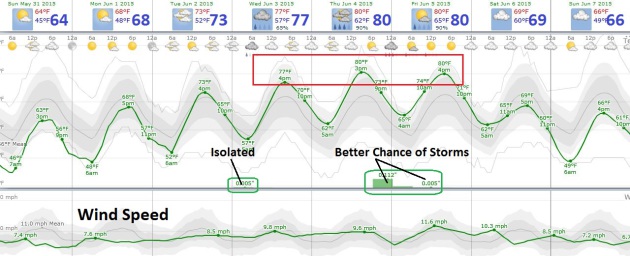
Limping Into June. It feels more like late September out there this morning, but the sun is too high in the sky for cool weather to linger for long. We warm into the 70s by Tuesday, temperatures top 80F the latter half of the week with scattered (heavy) T-storms Thursday into Friday. We may cool off a bit again next week; not quite as chilly as it is out there right now. Source: Weatherspark.
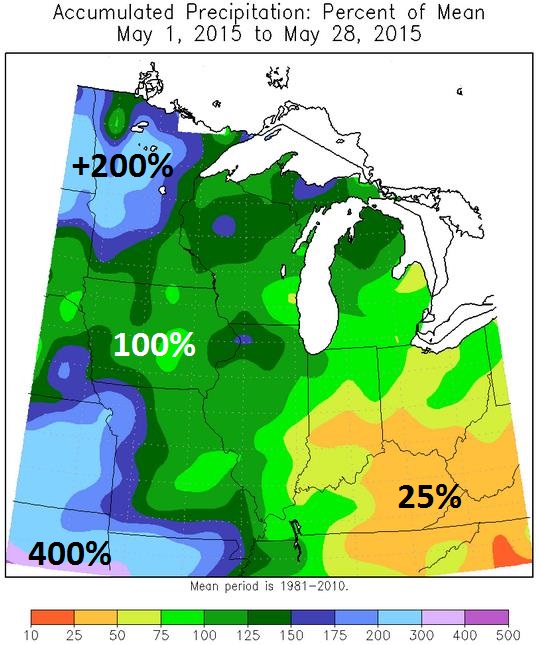
A Drought-Busting May. Much of the state is still too dry, but the trends are encouraging. Here’s an excerpt of Mark Seeley’s latest WeatherTalk Newsletter: “…The most notable feature of the month was surplus rainfall. Most climate stations reported above normal rainfall amounts, and in some cases twice normal rainfall. The wettest part of the state was across the central counties where 4 to 6 inch amounts were common. Many places reported measurable rainfall on half the days of the month. Over 40 communities reported new daily record rainfall amounts for selected dates during the month…”
Graphic credit: “Percentage of mean precipitation for May, to date“. Courtesy: Midwest Regional Climate Center.
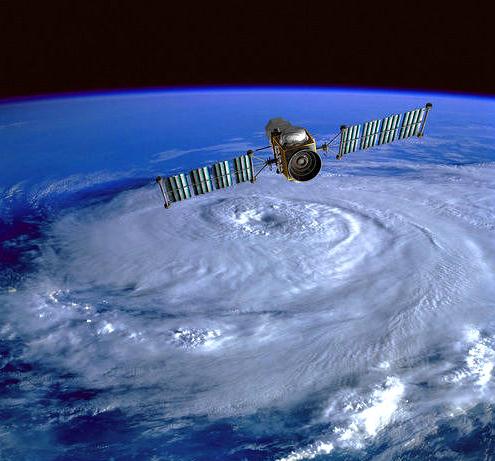
Hurricane Season 2015: Better Track Forecast Since Katrina, But Intensity a Puzzle. What keeps hurricane forecasters up at night? A Category 1 hurricane approaching a heavily populated area – people deciding to stay put and ride out the storm (“it’s only a cat 1!”) only to have the storm intensify rapidly before reaching land, putting millions at risk. Here’s an excerpt of a story at New Orlean’s NOLA.com: “…But as the 2015 hurricane season begins Monday, experts warn that efforts to forecast the intensity of hurricanes are still lagging behind, especially when a storm intensifies by more than one category in a few hours — a process called rapid intensification. “On tracks, we’re definitely 20 to 25 percent better than we were in the Katrina timeframe,” said Frank Marks, director of NOAA’s Hurricane Research Division. “On intensity, we’ve moved the bar from no change in our forecasts to some change…”
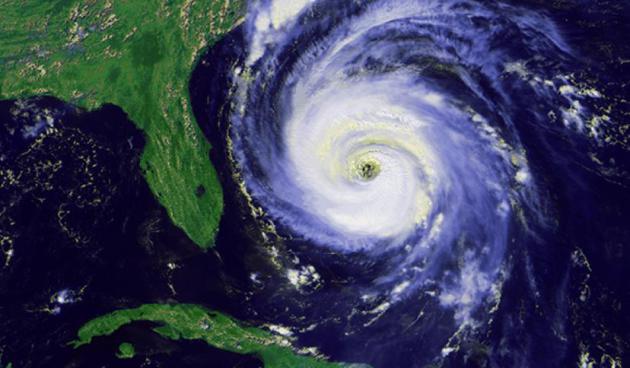
Florida Setting Amazing Hurricane Record. At some point the hurricane drought will come to an end and we may tip over into a much more active pattern. Here’s an excerpt of a story at wtsp.com: “No hurricane has hit Florida in nearly 10 years. It’s a dry spell that has kept us safe, but it also creates a huge, dangerous challenge for emergency planners. This is the longest stretch without a hurricane Florida has experienced since records started being kept in 1851. It’s one of the big things they’ll be talking about at the free Tampa Bay Hurricane Expo on Saturday at MOSI in Tampa...” (Image credit: NOAA).

Which Hurricane Forecast Model Is The Best? It’s still ECMWF. I hope the GFS and HWRF can catch up and surpass what the Europeans are capable of – I wouldn’t bet against them over the long term, but the USA is just not there yet. Here’s an excerpt of a story at CNBC: “…According to most people in the industry—or just plain statistics—the European model is the best, and has been for years. Almost any report will describe it as the best. Technically, you want to look for the acronym it goes by—ECMWF—which stands for the European Center for Medium-range Weather Forecasting. A big factor in its dominance recently is due to a 2006 improvement in its model. The Europe model’s advantage comes from several sources: Powerful supercomputers that can analyze larger amounts of data, taxes paid by the member nations of the European Union to help keep funding up, and charging money to other forecasters who want its data…”
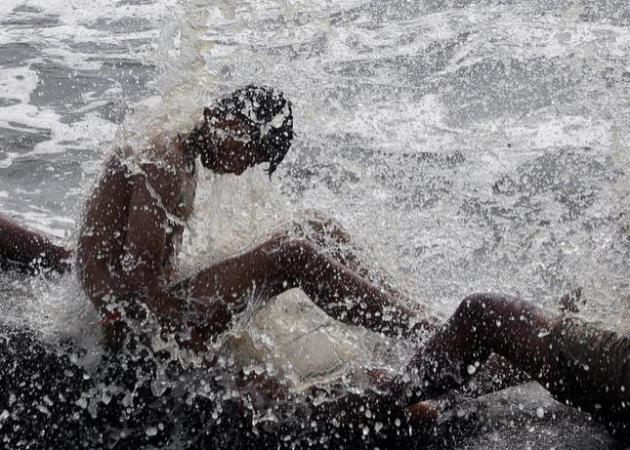
The Death Toll From India’s Hellish Heat Wave Is Now More Than 1,800. TIME has more details on the historic heat wave now underway in India; here’s an excerpt: “…Forced to work under the blazing sun, construction workers like Devi, along with the homeless and the elderly, have been the hardest hit by the heatwave that so far has led to over 1,800 deaths, the vast majority of them concentrated in the southeastern Indian states of Andhra Pradesh and Telangana. Together, those states account for over 1,750 deaths. Deaths have also been reported in Delhi and other states, including Gujarat and Odisha, where temperatures earlier this week peaked at a sweltering 116.6°F (47°C)…”
Photo credit above: “An Indian man enjoys high tide waves at the Arabian Sea coast in Mumbai, India, Friday, May 29, 2015. Dizzying temperatures caused water shortages in thousands of Indian villages and killed hundreds more people over the past day, driving the death toll from a weeks long heat wave to more than 1,000, officials said Friday.” (AP Photo/Rajanish Kakade)
India Heat Wave May Be 5th Deadliest on Record. Dr. Jeff Masters has some eye-opening details at Weather Underground: “The death toll from India’s horrid May heat wave has risen to 1,826, making this year’s heat wave the second deadliest in India’s recorded history–and the fifth deadliest in world history. According to statistics from EM-DAT, the International Disaster Database, India’s only deadlier heat wave was in 1998, when 2,541 died. With over 400 deaths recorded in just the past day and the heat expected to continue over India for another week, the 1998 death toll could well be exceeded in this year’s heat wave…”
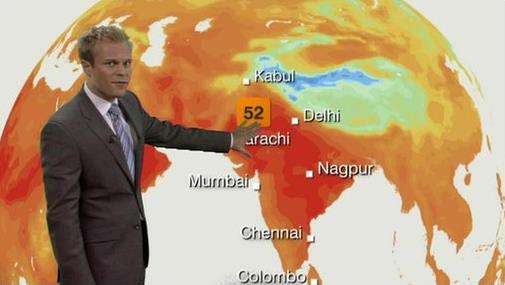
The 10 Deadliest Heat Waves in World History
1) Europe, 2003: 71,310
2) Russia, 2010: 55,736
3) Europe, 2006: 3,418
4) India, 1998: 2,541
5) India, 2015: 1,826+
Image credit above: BBC News.
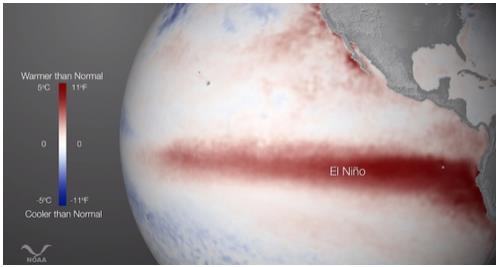
El Nino Can Raise Sea Levels Along U.S. Coast. As water warms it expands, which causes water levels to rise. Here’s an excerpt of a good explainer from Climate Central: “The El Niño event underway in the Pacific Ocean is impacting temperature and weather patterns around the world. But its effects aren’t confined to the atmosphere: A new study has found that the cyclical climate phenomenon can ratchet up sea levels off the West Coast by almost 8 inches over just a few seasons. The findings have important implications in terms of planning for sea level rise, as ever-growing coastal communities might have to plan for even higher ocean levels in a warmer future…”
Image credit above: “Sea surface temperatures in the eastern tropical Pacific Ocean during the very strong 1997 El Nino event.” Graphic courtesy of NOAA.
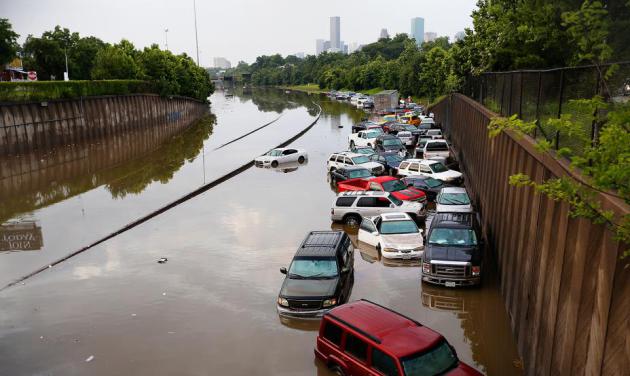
A Silver Lining To Texas’s Biblical Floods? No, Mother Nature is not on a dimmer switch. Moisture is either on or off. Either Exceptional Drought, or Monsoon-like Flood. This was one heckuva way to end a prolonged drought. Here’s an excerpt of a story at WIRED: “...The devastation caused by these floods is heart-wrenching. But you could consider Texas’ weather whiplash to be a good thing: These dousing storms, which seem more and more like the consequence of a strengthening El Niño, have brought an end to a four-year water shortage. Just how much of a silver lining these floods are creating, though, depends on the particular geography of Texas’ different regions—it is a gigantic place, y’all. And the land’s composition also plays a crucial role in just how bad the flooding has gotten...”
Photo credit above: “Motorists are stranded along I-45 along North Main in Houston after storms flooded the area, Tuesday, May 26, 2015. Overnight heavy rains caused flooding closing some portions of major highways in the Houston area.” Cody Duty/Houston Chronicle/AP.
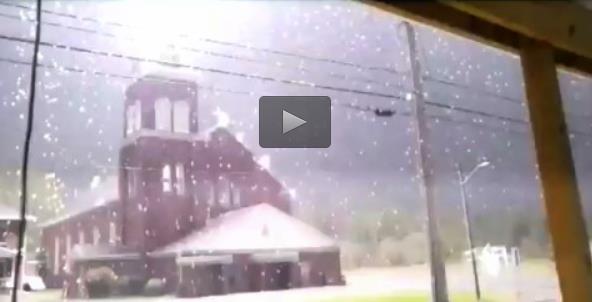
Don’t Try This At Home: Grand Isle Student Captures Lightning Strike on Church Steeple. Yes, this is a little too close for comfort. Check out the video and story at Bangor Daily News: “…About 6 p.m., as a line of strong thunderstorms was passing through the St. John Valley, Bouley stood on his Grand Isle home’s front porch and aimed his iPhone camera toward the St. Gerard Catholic Church steeple. Seconds later, a bright streak of lightning can be seen hitting the building, producing a fireball and accompanied by a massive crack of thunder. “As soon as I pointed the camera to the ground and back up, it happened,” Bouley said…”

Google Wants To Turn Your Clothes Into a Computer. I can’t wait for “smart underwear”. The very definition of progress. Here’s an excerpt from The New York Times: “If you thought it was only a matter of time before Google tried to turn your pants into a computer, well, guess what, you were right. On Friday, the second day of its annual developer conference, Google I/O, one of the search giant’s semi-secretive research divisions announced a project that aims to make conductive fabrics that can be weaved into everyday clothes…”

I Fooled Millions Into Thinking Chocolate Helps Weight Loss. Here’s How. Don’t believe everything you read on the Internet – or the mainstream media for that matter. Here’s a clip from io9.com: “…Other than those fibs, the study was 100 percent authentic. My colleagues and I recruited actual human subjects in Germany. We ran an actual clinical trial, with subjects randomly assigned to different diet regimes. And the statistically significant benefits of chocolate that we reported are based on the actual data. It was, in fact, a fairly typical study for the field of diet research. Which is to say: It was terrible science. The results are meaningless, and the health claims that the media blasted out to millions of people around the world are utterly unfounded…”

TODAY: Sun fades through high clouds. Winds: E 10. High: 67
SUNDAY NIGHT: Partly cloudy. Low: 49
MONDAY: Partly sunny, a little milder. High: 69
TUESDAY: Hazy sun, feels like early June again. Wake-up: 53. High: 74
WEDNESDAY: Sticky sun, few T-storms. Dew point: 60. Wake-up: 61. High: 80
THURSDAY: A few strong T-storms. Dew point: 63. Wake-up: 64. High: 82
FRIDAY: Some sun, few storms bubble up. Wake-up: 65. High: 81
SATURDAY: More sun, cooler and less humid. DP: 54. Wake-up: 62. High: 73
Climate Stories….

Join The Tar Sands Resistance March. The march is one week from today in St. Paul, ending at the Capital lawn for a rally. Details here: “It’s not just Keystone XL. Big Oil is trying to build and expand an enormous network of tar sands pipelines — some even bigger than Keystone XL — from Canada into the Midwest. These tar sands pipelines, along with crude oil trains and tankers, pose a growing risk to the Great Lakes, our rivers, our communities and our climate. That’s why on June 6, thousands will gather in the Twin Cities for the Tar Sands Resistance March — the largest anti-tar sands event ever in the region. We are coming together to send a clear message: keep toxic tar sands out of America’s Heartland, fight for clean water, clean energy, and a safe climate!...”
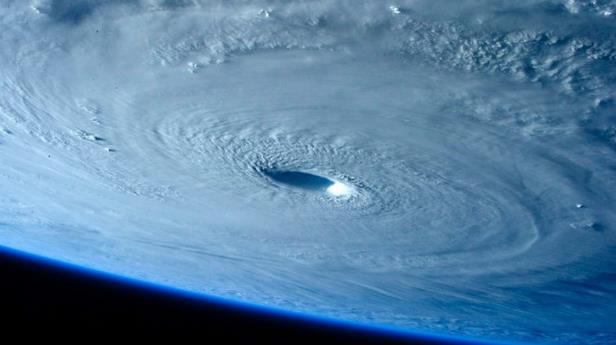
Super Typhoons To Increase In Strength With Climate Change. This applies to hurricanes in the northwest Pacific (called typhoons), based on research highlighted at Stuff.co.nz: “…A study covering 850 typhoons in the region found the intensity of the damaging storms has increased by about 10 per cent since the 1970s, said Wei Mei, a climate scientist at the Scripps Institution of Oceanography at the University of California, San Diego, and a co-author of the study published in the journal Science Advances. Using 20 models and a mid-range projection of carbon dioxide emissions, the researchers found the peak intensity of storms such as super Typhoon Haiyan, which tore through the Philippines in November 2013, will become even stronger and more common...” (Image: NASA).
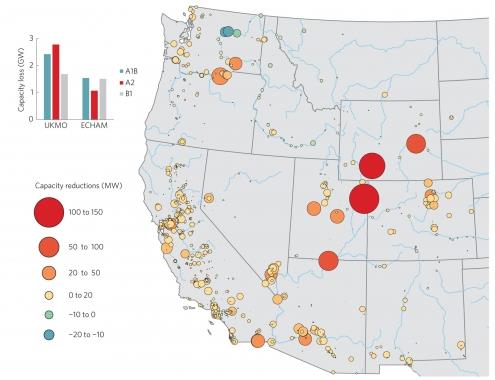
Nearly Half of Western U.S. Power Plants Vulnerable To Climate Change. Greentech Media has the story – here’s an excerpt: “The effects of climate change could hamper electric generating capacity in the Western U.S. during peak summertime energy use by about 3 percent on average, and up to nearly 9 percent if there is ongoing drought. A new study from Arizona State University looked at the effects of climate change on streamflow, air and water temperature, humidity and air density…”

Bill Nye Under Attack For Linking Texas Floods to Climate Change. EcoWatch has the story – here’s a snippet: “…And while no one single weather event can be linked to climate change, recognizing that the event is part of a larger trend of extreme weather, which is caused by climate change, should have been no big deal to do. Scientists have been saying for years that as carbon emissions increase, so will extreme downpours. “When you have a warmer atmosphere, then you have the capability to hold more water vapor,” Brenda Ekwurzel of the Union of Concerned Scientists told Alternet. “When storms organize, there’s much more water you can wring out of the atmosphere compared to the past...”
File photo credit: Brian Ach/AP Images for Sylvan Learning.
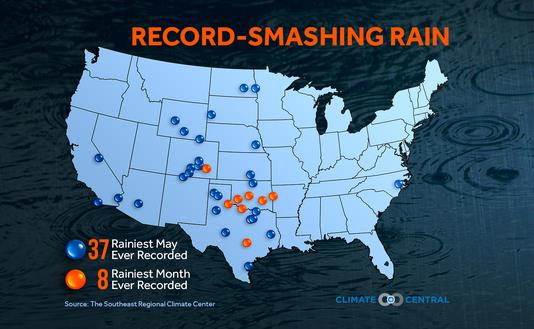
Flooding From Extreme Downpours May Be More Common With Climate Change. Here’s a snippet of a story at Tucson News Now: “…The below graphic shows where new records were set for May or monthly rainfall. Phoenix even made the list with 1.17″ of rain, much of that coming in two spring storms passing over the city on May 4 and May 15. No flooding occurred in Phoenix but it stacks up as the wettest May on record because May is usually one of the driest months of the year for the city. June is on-average the only month drier than May…” (Graphic credit: Climate Central).

Flawed Forecast From Ducey And Climate Change Skeptics. Here’s an excerpt of an Op-Ed from azcentral.com in Arizona: “…According to a University of Arizona and Stanford University study, more than 70 percent of Arizona residents believe the government should limit greenhouse gases. The conclusions of the scientists cited above are based on methodical study of the natural world, not on whether they belong to the Republican Party or are Democrats.We live a state where climate change will have a huge impact on our lives. We need elected officials who are educated in the changes. Ducey is “skeptical” of the science. I’m skeptical of politicians.”

Nice Website 😉