57 F. high in the Twin Cities Monday (before the cold front arrived).
61 F. average high on October 9.
60 F. high on October 9, 2016.
October 10, 1977: A few locations receive early accumulating snow, including Minneapolis with 2.5 inches, Gaylord with 2 inches, and Jordan with 2 inches.
October 10, 1970: Early snowfall is recorded in west central Minnesota. Snow totals range from a trace to 4.2 inches in Benson. Other areas include Montevideo with 4 inches, Canby with 3.2 inches, Morris with 2.6 inches, and Willmar with 2.5 inches. New London, New Ulm, and Buffalo all recorded 2 inches of snowfall.
October 10, 1949: An incredibly strong low pressure system brings hurricane force winds across Minnesota. This was possibly the strongest non-thunderstorm wind event seen in Minnesota. Top winds are clocked at 100 mph at Rochester, with a gust of 89 mph at the Twin Cities International Airport. 4 deaths and 81 injuries are reported. Numerous store windows are broken, and large chimneys toppled. The top 10 floors of the Foshay building are evacuated with the tenants feeling seasick from the swaying building.
October 10, 1928: Record high temperatures are set across central Minnesota with highs in the upper 80s to lower 90s.
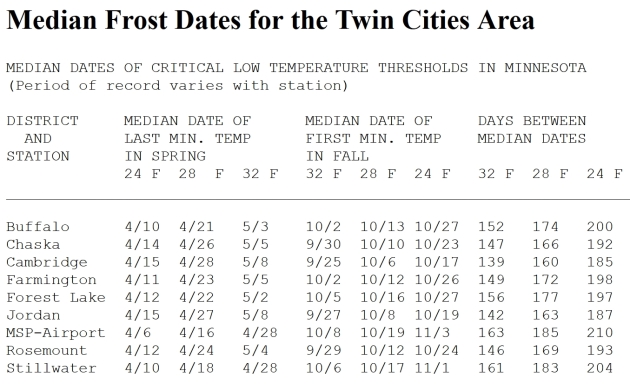
Comedian Carl Reiner finds snow to be “an unnecessary freezing of water”. Does he feel the same way about frost? If you live outside the 494/694 freeway system, well away from the urban heat island, you may be waking up to an icy, crystalline carpet of white.
Flood Statement
National Weather Service Twin Cities/Chanhassen MN
736 PM CDT Mon Oct 9 2017

...The flood warning continues for the following rivers in
Minnesota...
  Cottonwood River at New Ulm affecting Brown County
  South Fork Crow River below Mayer affecting Carver County
  South Fork Crow River at Delano affecting Wright County
  Minnesota River at Montevideo affecting Chippewa...Lac qui Parle
  and Yellow Medicine Counties
  Crow River at Rockford affecting Hennepin and Wright Counties

Overview...The following forecast takes into account the rain
that has already fallen across the basin...and predicted rainfall
for the next 48 hours.
Nothing Too Forbidding – Yet. ECMWF model data for the Twin Cities shows highs mostly in the 60s, but next week gets off to a chilly start. Looks like October to me. Graphic: WeatherBell.
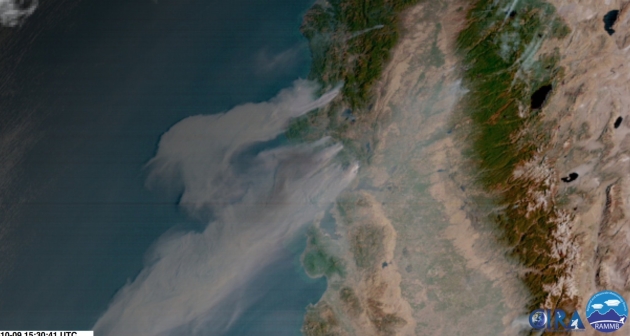
84-Hour Rainfall Potential. NOAA’s 12km NAM model prints out heaviest 1-2″+ rainfall amounts across the Midwest and Great Lakes in the coming days; a surge of heavy rain pushing into the Pacific Northwest. But there is no rain in the short-term forecast to help firefighters across California. QPF outlook: Tropicaltidbits.com.
Positively Zonal. If you believe the GFS model the forecast winds aloft 2 weeks out will be blowing west to east, implying temperatures close to average and an absence of wild storms (with the possible exception of New England).
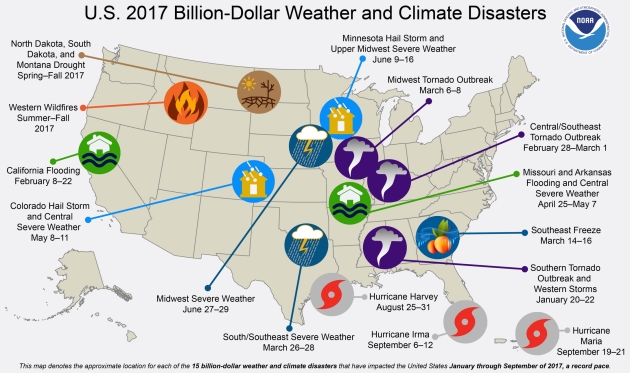
15 Separate Billion-Dollar Disasters So Far in 2017. Harvey, Irma and Maria were all billion-dollar disasters; it remains to be seen if Category 1 Nate produced a billion dollars of damage for the Gulf Coast last weekend. Details via NOAA NCEI: “In short, tropical cyclones are the most costly of the weather and climate disasters. Since 1980, the U.S. has sustained at least 218 weather and climate disasters where overall damages/costs reached or exceeded $1 billion (including Consumer Price Index adjustment to 2017). The total cost of these 218 events exceeds $1.2 trillion. However, this total does not include the costs for Hurricanes Harvey, Irma, and Maria, which are substantial and are still being assessed. Not including hurricanes Harvey, Irma, and Maria, 35 tropical cyclones have caused at least $583.5 billion in total damages—with an average of $16.7 billion per event. Accounting for just under a fifth (17 percent) of the total number of events, tropical cyclones have caused almost half (47 percent) of the total damages attributed to billion-dollar weather and climate disasters since 1980. These numbers will dramatically rise once the 2017 hurricanes costs are included…“
Map credit: NOAA NCDC.

I’ve Looked at Clouds From Both Sides Now. Are you a member of the Cloud Appreciation Society? A story at The Washington Post explains how clouds shape our moods and cognition: “…Psychologically speaking, clouds also have both positive and negative impact. Overcast weather turns us inward and helps us focus, the experts say. Sunny weather, by contrast, slows cognition. Researchers in Australia tested their theory with an experiment several years ago. They showed — for the first time in a real-life setting — weather-induced moods can significantly affect memory. On rainy, cloudy days, which caused a gloomy mood, the ability to recall objects was three times greater than on sunny days, despite all the positive vibes they triggered…The group, of course, has nothing good to say about lovers of cloudlessness — including beachgoers, most prominently. They call the worship of monotonous cloudlessness “blue sky thinking.” Pretor-Pinney rejects such a limited view of the heavens. “Cloudspotting is a conscious invitation to daydream, a sensitivity to your surroundings,” he said. “It’s a kind of sky geekiness, which is beautiful.”
File photo: NOAA.


In a World Without TV Sets, What Do We Call TV? Quartz asks the rhetorical question: “…None of this is TV in the standard sense. It comes as TV sets are disappearing from American homes, and more media is being consumed (pdf) through a combination of other devices including smartphones, tablets, desktop computers, game consoles, and multimedia devices like Rokus, radio, and DVD and Blu-ray players. Almost everything can be watched through one glass screen or another. But if it looks like TV and sounds like TV, why isn’t it? It’s a question I ask myself daily. It’s my job to describe TV, streaming, and other programming to readers. If I don’t know what to call this stuff, does anybody?…”

No, You Can’t Always Get What You Want. Turns out the Rolling Stones lyrics have a creation story in lovely Excelsior, Minnesota, as reported by swnewsmedia.com: “…According to local lore, Jimmy ordered a cherry Coke and saw Mick Jagger. In later interviews, Jimmy said he introduced himself to the musician and Jagger called him Mr. Jimmy. When Jimmy’s drink came, it was a regular Coke instead of the cherry he wanted. He pointed it out to Jagger, but added “You can’t always get what you want.” Whether Jimmy actually had anything to do with the song that came out several years later is an issue that’s long been debated. A lot of people believe that the Mr. Jimmy mentioned in the song refers to Rolling Stones producer Jimmy Miller. During the Tapping History presentation, the audience will hear from a woman who was a waitress that day at Bacon, who remembers serving Jimmy a regular Coke because they were out of cherry syrup and hearing him say the famous line...”

TODAY: Cool with increasing clouds, showers southeast MN. Winds: NE 5-10. High: 55
TUESDAY NIGHT: Risk of a shower or sprinkle, especially south/east of MSP. Low: 41
WEDNESDAY: Partly sunny, breezy and milder. Winds: SE 7-12. High: near 60
THURSDAY: Intervals of sun, a lukewarm daydream. Winds: S 10-15. Wake-up: 50. high: 71
FRIDAY: Clouds increase, showers develop. Winds: NE 7-12. Wake-up: 52. High: 61
SATURDAY: Some sun, better day of the weekend. Winds: NE 5-10. Wake-up: 44. High: 58
SUNDAY: A cold rain, windy and foul. Winds: NE 10-20. Wake-up: 42. High: 52
MONDAY: Clearing skies, rather brisk. Winds: W 8-13. Wake-up: 38. High: 56
Climate Stories…
Climate Change and Harvey. Here’s an excerpt from a story at The Battalion, from Texas A&M: “When Hurricane Harvey made landfall in August, the country watched as the storm dumped more than 60 inches of rain throughout South Texas. Now, experts like Andrew Dessler, atmospheric sciences professor at Texas A&M, are saying that climate change played a role in the size and intensity of Hurricane Harvey. According to Dessler, climate change doesn’t create storms, but it does strengthen preexisting storms. “The occurrence of a storm itself is largely [due to] chance and other environmental factors like El Niños and internal variability,” Dessler said. “The way humans have affected it is they have made the impacts of the storms a little bit worse.” Dessler said as humans continue to warm the ocean and climate, storm conditions intensify…”
