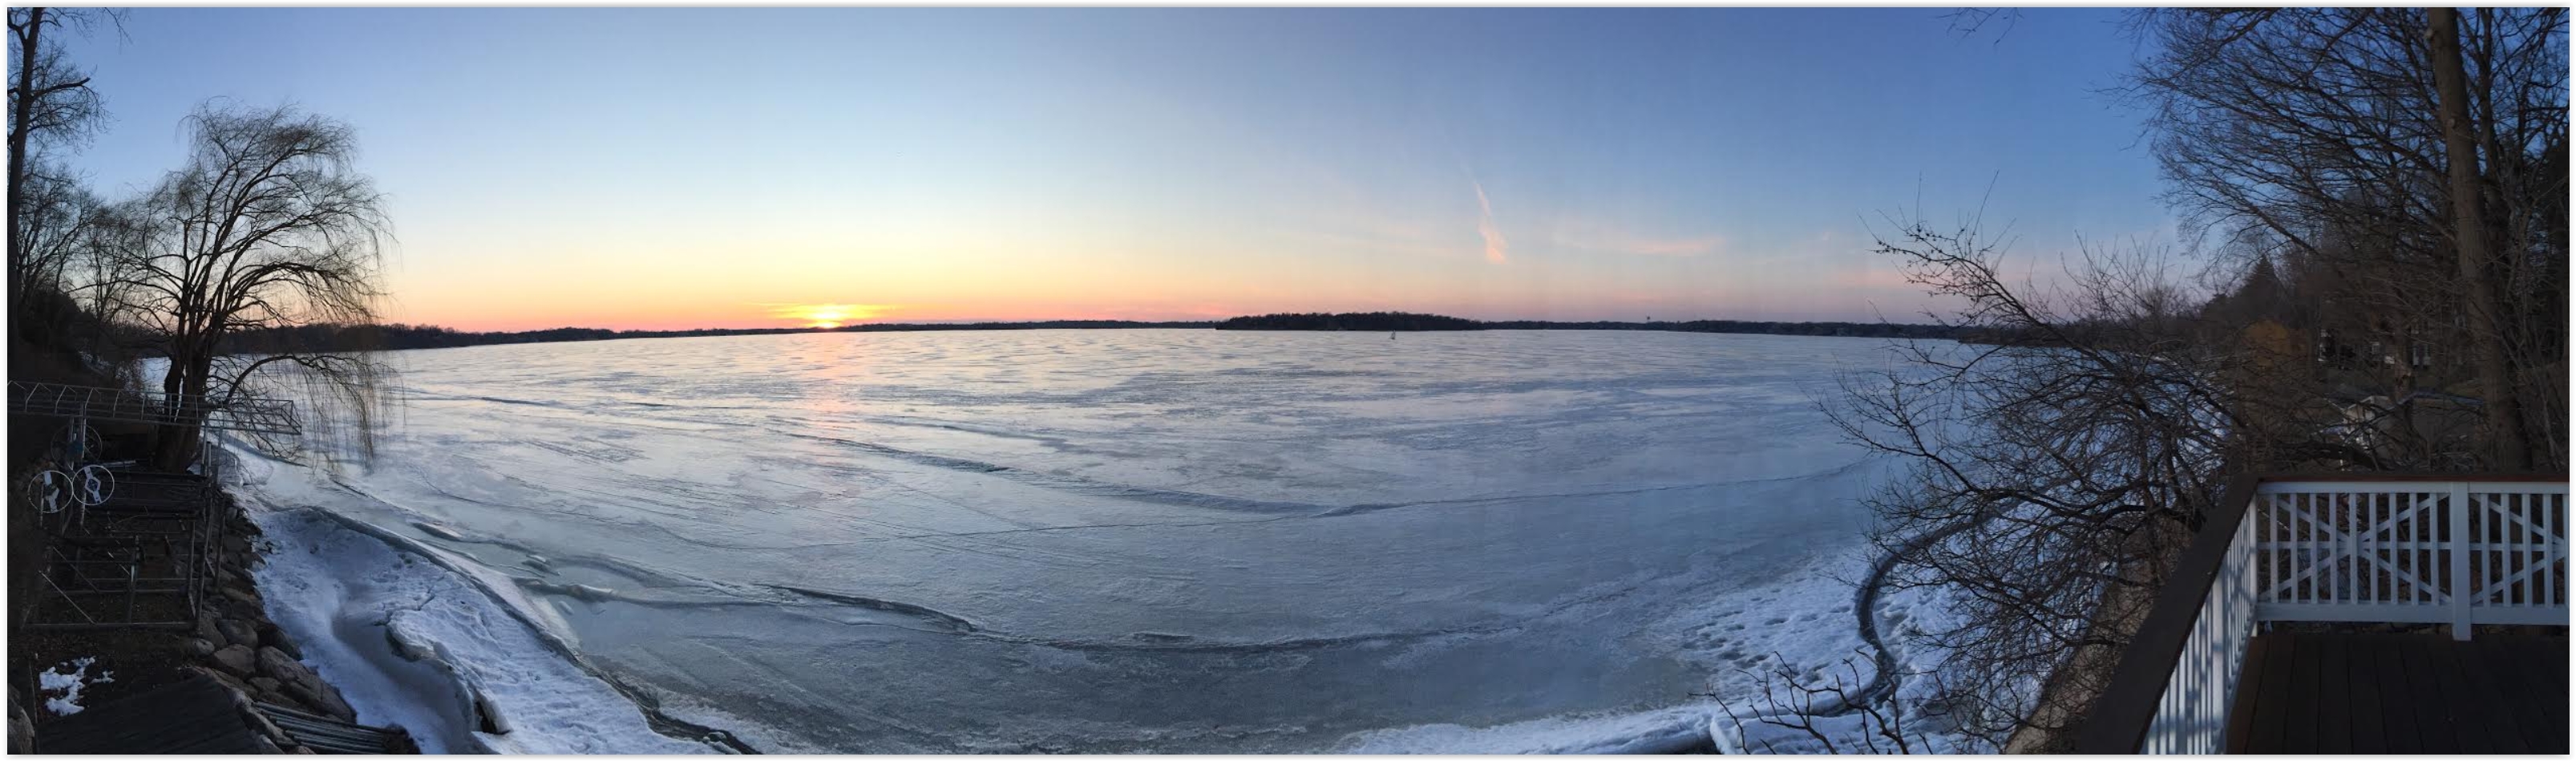
A Midwinter Night’s Dream: 50s in February?
I’m dazed and delirious; standing over a hot grill with my shirt off. I think the neighbor-lady just called 911. I don’t blame her.
You see, I’m disoriented. It was in the 60s yesterday in southwest Minnesota. 80F at Denver, the earliest 80 on record, broke the previous record for earliest 80-degree reading by nearly 5 weeks.
In Meteorology 1, the first course I took in college, they taught me which finger to point to the weather map with, how to chuckle on-cue, and the seasons. February is still “winter”, with bitter cold and heavy snow at this lofty latitude.
Not this year. We’ll see a few minor spasms of cold air – possibly a few sloppy snowfalls into March. But subzero cold, the days that make you want to RUN to the airport and fly ANYWHERE, so long as it’s south, are probably behind us now.
The pattern is consistent with an El Nino warm phase in the Pacific, with a strong subtropical jet stream whisking the biggest storms south of Minnesota. Numbing air remains bottled up over Canada – a westerly “zonal” flow keeping temperatures here 10-30F above average. We cool off a little by midweek, but ECMWF guidance shows 50s next weekend.
Average for mid-April.
No snowstorms brewing, just a premature taste of spring. Winter is now on life-support.
Thursday Records. 60s into southwest Minnesota, 80F at Denver with 90s over the southern Plains, on the 10th day of February? It’s all a bit surreal. Map: coolwx.com.
Winter Hangs On Across New England. Much of America is heating up, but not New England, still digging out from Thursday’s snowfall. Another storm is brewing for the weekend, mainly Sunday PM into Monday, when another intense nor’easter may buffet the coast with 50 mph winds and high surf. Maine could wind up with 1-2 feet of snow from this next system with 3-5 foot drifts. 84-hour NAM guidance: NOAA and Tropicaltidbits.com.
 Drying Out West Coast – Another Major Snowstorm for New England. Here is future radar (and isobars) showing another monster storm spinning up east of New Hampshire by Monday morning; an extended easterly fetch off the Atlantic may drop over 2 feet of snow on parts of Maine. Boston may see a plowable accumulation. Meanwhile the western USA dries out for a few days.
Atmospheric No-Man’s Land. The 2-week outlook (GFS) for 500mb winds continues to show a strong subtropical jet stream, but relatively light winds aloft from the Pacific Northwest into the Plains; the coldest air of winter still swirling over central and northern Canada.
Jaw-Dropping Heat. Temperatures may hit 90 degrees across much of Texas today. With a February like this who needs May?
Brief Return of Subzero Temperatures. Bitter cold will definitely be the exception, not the rule this month. Here’s an excerpt from Mark Seeley’s WeatherTalk: “This week saw the return of subzero temperature readings to many parts of the state with the dominance of a polar high pressure system. Most northern and central Minnesota climate stations reported some overnight lows that were subzero. It was -1°F as far south as Winona Dam and Redwood Falls. Many observers measured their coldest temperatures since the second week of January. No daily record low temperatures were reported, but Minnnesota did report the coldest temperature in the nation on some dates this week (see below):
Coldest in the nation reports this week came from:
Goodridge (Marshall County), MN with -13°F on the 5th
Hallock (Kittson County), MN with -29°F on the 8th
Crane Lake and Embarrass (St Louis County), MN with -22°F on the 9th…”
Welcome to Another “Mild Winter”, According to Winter Misery Index. Based on snowfall & temperatures this has been yet another mild winter, according to the Minnesota DNR’s Winter Misery Index. If anyone asks, the Twin Cities have only seen 2 severe winters since 2000. There were 2 severe winters in the 90s, 3 in the 80s, 4 in the 70s and 5 in the 1960s. At the rate we’re going snowbirds may move back.
Winter Misery Index courtesy of the Minnesota DNR. Click here for details on how the index is calculated.
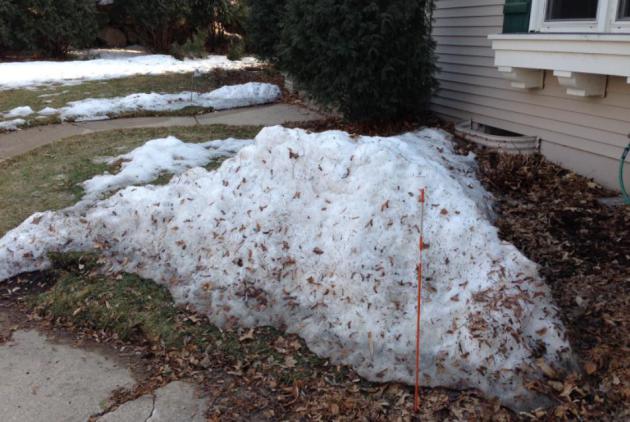
The Lack of Snow and its Impact on Farming. KEYC.com in Mankato has a few good reminders about the implications of little or no snow this time of year: “…Snow in the winter protects the soil from wind blowing it away, and keeps things warmer than they normally are. Though we’re apparently safe on that front too. “The downside to a lack of snow cover this time of year, especially on tilled soil, is the potential for soil erosion. Especially wind erosion. We’d like to keep that to a minimum – some cover on the ground is helpful for that. We haven’t seen the extreme temperatures. Our soil temperatures at the four-inch depth haven’t been below 25 degrees. Exposed soil and extreme cold weather can be on perennial crops, but we haven’t been in trouble yet,” Hoverstad said. And if the status quo remains, it’ll be a good thing. Less snow means farmers can get in the fields sooner.”
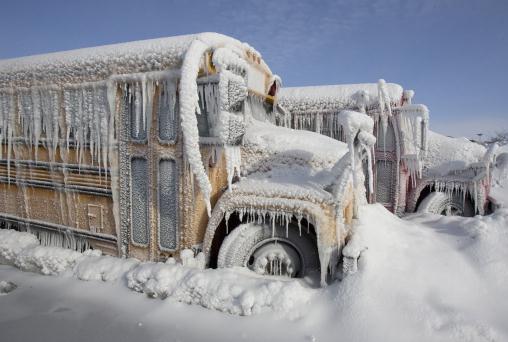
A Few Good Reasons Not to Warm Up Your Car in the Cold. Blasphemy? Here’s a video link and story excerpt at Esquire that made me do a double-take: “…Jason goes thorugh the details of what happens in a cold engine, and points out the hidden damage of letting your car idle for a long time on a cold day: Engine oil dilution. It turns out, while you might have thought that letting your car slowly warm up was reducing wear and tear, all that idling time leads to raw gasoline seeping into the oil, breaking down the oil’s lubrication properties and increasing the wear. so what should you do? Start it up, make sure all your windows are clear of ice/snow/fog, and just drive the thing! The engine will warm up faster, and therefore you’ll get nice warm heat coming out of the vents sooner, which is what you want anyway…”
File photo: AP.

Serious Snows in Caribou, Maine. The town in far northern Maine has more snow on the ground than any time since 1998, according to The National Weather Service.
La Nina Is Out and El Nino May Be Coming, And Here’s What That Means For Our Weather. Here’s an excerpt from Brian McNoldy and Phil Klotzbach writing for Capital Weather Gang: “…If El Niño were to develop quickly this year, it could potentially reduce levels of Atlantic hurricane activity this summer. While El Niño’s impacts on summer weather in the United States are not particularly strong, it has significant impacts on winter weather. In general, El Niño winters are characterized by enhanced moisture across the southern tier because of a stronger-than-normal subtropical jet stream. The northern states experience warmer-than-normal temperatures in El Niño, with anomalously dry conditions experienced across the Ohio Valley. Of course, all of these potential impacts hinge on whether El Niño actually develops. At this point, it is a possibility by the end of 2017.”
Graphic credit: “Forecast of future tropical Pacific SST conditions from 25 different models.” (NOAA).
Half-Mile Wide Tornado Damaged 940 Homes. The Hot Springs Sentinel Record has the story: “Dwight Powell lost his Lexus to the massive tornado that injured 33 people and destroyed or seriously damaged 940 properties on a half-mile wide rampage through two miles of east New Orleans. He had just parked it inside his garage to avoid hail damage when the twister struck. At least his Yukon pickup truck would be OK, he thought: It was in a friend’s repair shop, 60 miles north. Then his phone rang. “The man called me this morning and said, ‘Man, the tornado hit your truck,'” Powell said Wednesday. That’s a bad joke to tell a friend who just lost his house, he told him. But it wasn’t. The truck was slammed by another tornado that hit Donaldsonville, one of at least five confirmed twisters tearing up Louisiana on Tuesday as a line of severe weather moved across the Deep South…”
Photo credit: The New Orleans Advocate.
Coastal Cities Could Flood Three Times a Week by 2045. Climate Central explains that the Mid Atlantic region is most vulnerable to flooding from rising seas: “…Washington and Annapolis, Md. could see more than 120 high tide floods every year by 2045, or one flood every three days, according to the study, published last week in the journal PLOS ONE. That’s up from once-a-month flooding in mid-Atlantic regions now, which blocks roads and damages homes. “The flooding would generally cluster around the new and full moons,” said Erika Spanger-Siegfried, a Union of Concerned Scientists analysts who helped produce the new study. “Many tide cycles in a row would bring flooding, this would peter out, and would then be followed by a string of tides without flooding.” The analysis echoed findings from previous studies, though it stood out in part because of its focus on impacts that are expected within a generation — instead of, say, by the end of the century. It showed high tide floods along southeastern shorelines are expected to strike nearly as often as they will in the mid-Atlantic, portending a fast-looming crisis for more than 1,000 miles of coastal America….”
New Study: Despite Drought-Reducing Rains, Central California Continues to Sink. Pumping water out of underground aquifiers is the most likely cause, according to a recent study highlighted at The Mercury News: “Even as California struggles with surface flooding, the state is going dry underground, triggering sinking in parts of the great San Joaquin Valley, according to a new NASA report released by the Department of Water Resources. The most comprehensive study yet of the problem reveals the startling pace and extent of the damage: NASA satellites found the ground subsiding up to 20 inches in a seven-mile area near the Fresno town of Tranquillity, because the state’s subterranean water supply was drained to record lows by farms and towns coping with the recent drought…”
California Could Be Overdue for a 100-Year Mega-Flood. Details via SFist.com: “It may not be in the cards this year, but California has an extended history of mega-floods — the likes of which the state has not seen since 1862, when about 40 days of straight rain turned the Central Valley and much of Sacramento into a lake, killing countless people and thousands of livestock and leveling a number of barely decade-old west coast towns. Hydrology researcher Dave Reynolds argued in a 2012 paper that despite the lack of weather records for the state prior to the 1850s, the Great Flood of 1862 should be considered a 200-year event that could be expected to repeat itself with much more disastrous effects now that the west coast is so much more densely populated. But now KPIX/CBS 5 picked up on this historic flood narrative, noting that the “atmospheric river” effects we’re seeing this season from the colloquially named Pineapple Express could lead to a mega-flood catastrophe sooner than we think...”
Image credit: “An illustration of K Street in Sacramento in January 1862.”
A Warm and Wet January, 2017. Meteorologist D.J. Kayser reports at AerisWeather: “January ended up being a very warm month from the Southern Plains into the Northeast, with 61 long-term NWS climate locations recording one of their top ten warmest January’s on record. Only one of those locations, though, ended up having their warmest January on record – Bridgeport, CT. January 2017 beat the previous warmest January in Bridgeport by a whole 0.1°, which had been set in 1950. While records only go back to 1948, two days (both the 12th and 13th) set new record highs. Here’s a list of select locations that saw a top ten warmest January last month:
- Bridgeport, CT: 36.9 (Warmest)
- Oak Ridge, TN: 46.8 (2nd warmest)
- Sault Ste Marie, MI: 24.8 (2nd warmest)
- Tupelo, MS: 50.8 (2nd warmest)
- Huntsville, AL: 50.9 (3rd warmest)
- Charleston, SC: 56.6 (4th warmest)
- Paducah, KY: 42.4 (4th warmest)
- Caribou, ME: 18 (5th warmest)
- Nashville, TN: 47 (5th warmest)
- Birmingham, AL: 52.5 (5th warmest)
- Atlanta, GA: 52 (6th warmest)...”

New Apps Set Atmospheric Data Spinning in 3D. Augmented reality with environmental data? Here’s an excerpt of a very eye-opening post from UCAR: “…Datasets in the atmospheric sciences cover everything from observations made by weather balloons to satellite measurements of cloud cover to output from climate model runs. Now the National Center for Atmospheric Research (NCAR) is helping make those data less abstract and more concrete — a little closer to a rock sample and a little further from a computer file. The result is two apps: one using virtual-reality and one using augmented-reality techniques to create 3D visualizations of datasets on a globe that students can move around and view from different perspectives. Meteo VR (Virtual Reality) and Meteo AR (Augmented Reality) are available for use on iPhone, iPad, and Android devices. They were developed by NCAR’s Computational and Information Systems Lab (CISL)…”
Animation credit: “The Meteo AR app uses augmented-reality techniquest to make atmospheric science data more accessible to the public.” (©UCAR. This animation is freely available for media & nonprofit use.)
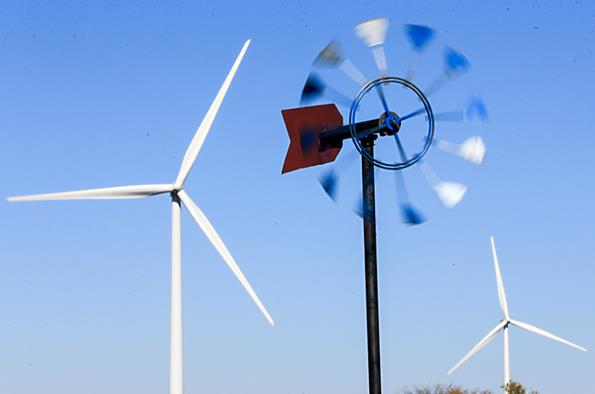
Vestas Leaps to Top Spot in U.S. Wind Market. Reuters reports: “Danish wind turbine maker Vestas Wind Systems has leapt to the top of the U.S. wind market, overtaking General Electric in new capacity installed last year, although slower demand growth and doubts over political support could threaten its position. Vestas came back from the brink of bankruptcy just four years ago. Now the wind industry is entering a new phase with slower growth and more steady demand for turbines, prompting producers to turn to servicing and replacement of older turbines to grow revenue. Vestas, the world’s biggest wind turbine maker, supplied 43 percent of the 8.2 GW of wind power capacity connected to the U.S. power grid last year, the American Wind Energy Association said in a quarterly report...”
Photo credit: “Maintenance work is done on a Vestas wind turbine (R) at a wind energy park near Heide, Germany, September 9, 2010.” REUTERS/Christian Charisius/File Photo.

The “New Normal” in America: Renewables Boom, Emissions Plunge and Consumers Save More Than Ever. Here’s the intro to a summary at Greentech Media: “After decades of technology development, business model innovation and policy progress, the U.S. economy is now decisively growing — independent of energy consumption and carbon emissions. Since 2007, U.S. GDP has grown by 12 percent, while energy consumption has fallen by 3.6 percent, according to the new 2017 Sustainable Energy in America Factbook, compiled by Bloomberg New Energy Finance (BNEF) for the Business Council for Sustainable Energy (BCSE). This year’s fifth edition report builds on last year’s Factbook findings that show the U.S. economy grew by 10 percent since 2007, while energy consumption fell by 2.4 percent. “In other words, energy productivity continues to improve as less and less energy is needed to fuel growth,” the authors wrote...”

Americans Oppose President Trump’s Environmental Deregulation, Poll Says. Here’s an excerpt from TIME: “The majority of Americans oppose President Donald Trump‘s plan to eliminate environmental regulations that combat climate change, according to a new poll, underscoring skepticism about an oft-repeated promise the campaign trail.The Quinnipiac University poll shows that 61% of Americans oppose removing regulations that combat climate change, with remaining 29% supporting the rollback. Trump has aggressively pursued deregulation in the environmental area during his first weeks in office, working with Congress to undo a slew of rules recently implemented under former President Barack Obama. The Clean Power Plan, Obama’s most significant domestic measure to fight climate change, remains on the books, though Trump promised during the campaign to undo it…”
Minnesota Report Suggests Efficiency Push Could Generate 15,000 Jobs. Midwest Energy News has the story: “Minnesota could create 15,000 jobs and save more than $3.1 billion by reducing energy use in municipal buildings, universities, schools and hospitals, according to a new report. The report, “20 for MN: A Proposal To Reduce Minnesota’s Energy Use In The M.U.S.H. Sector By 20 Percent,” was released earlier this week by the BlueGreen Alliance, which coordinates labor unions with environmental groups. “We’re hoping the report brings more attention to the fact that this is one of the areas of the economy that can improve the environment and creates jobs,” said Minnesota regional program manager Bree Halverson. Energy efficiency initiatives naturally create local jobs, she said. The report suggests 50 percent of energy efficient equipment is locally sourced…” (Imagery: Department of Energy).

Midwest EVOLVE Wants More EVs in Flyover Country. Here’s an excerpt from insideevs.com: “…Midwest EVOLVE is going to try and get car shoppers in this relatively EV-free region of the country to test drive, learn about, and finally buy plug-in vehicles. There’s a logical reason for this, said Lew Bartfield, CEO and president, American Lung Association of the Upper Midwest, during a presentation in Chicago. Aside from the logical health benefits of cleaner air that EVs bring, this part of the country hasn’t gotten the attention it deserves, he said. “The Midwest has been overlooked as a market for electric vehicles,” he said. The solution is to let people test drive these plug-in cars and see for themselves how they work. “Butts on seats, that’s our phrase,” he said.”Butts on seats.” Over the next three years, Midwest EVOLVE will do over 25 “large scale” ride and drive events and over 50 smaller ones...”

State-Sponsored Hackers Targeting Prominent Journalists, Google Warns. Here’s an excerpt from POLITICO: “…Some journalists getting the warnings say they suspect the hackers could be Russians looking to find incriminating emails they could leak to embarrass journalists, either by revealing alleged liberal bias or to expose the sausage-making of D.C. journalism. “The fact that all this started right after the election suggests to me that journalists are the next wave to be targeted by state-sponsored hackers in the way that Democrats were during it,” said one journalist who got the warning. “I worry that the outcome is going to be the same: Someone, somewhere, is going to get hacked, and then the contents of their gmail will be weaponized against them — and by extension all media….”


SUNDAY: Partly sunny, windy, turning slightly cooler. Winds: NW 15-25. High: 38
MONDAY: Mild sunshine, less wind. Winds: SW 10-15. Wake-up: 25. High: 46
TUESDAY: Clouds and winds increase. Winds: NW 10-15. Wake-up: 29. High: 43
WEDNESDAY: Mix of clouds and sun, cooler. Winds: N 10-15. Wake-up: 20. High: 32
THURSDAY: More sun, warming up again. Winds: S 8-13. Wake-up: 18. High: 41
FRIDAY: Hello April! Spring Fever Epidemic. Winds: S 8-13. Wake-up: 28. High: 51
Climate Stories…
As Antarctic Ice Shelves Shrink, “Shelf-Watchers” Await Major Break-Off. The Christian Science Monitor reports: “Sometime in the 1960s, a tiny crack emerged in Antarctica’s Larsen C ice shelf. Today, it’s more than 100 miles long, two miles wide in places, and growing at a rate of five football fields per day. Only 12 miles now connect the soon-to-be iceberg to Larsen C. Several media outlets, including The Christian Science Monitor, have been on “shelfwatch” for months, as scientists expect an iceberg the size of Delaware to break off from Larsen C in the near future. That would mark one of the largest such events on record, joining similar break-offs from Larsen A and B. Almost 600 square miles of ice separated from Larsen A in 1995, and in 2002 more than 1,200 square miles broke from Larsen B, whose shrinkage is captured in a new satellite image. The breakup itself likely won’t contribute to sea level rise, however, “as the Larsen C shelf already floats in the ocean,” as the Monitor’s reported last month…”
Photo credit: John Sonntag, NASA via AP.
NASA Earth Observatory has more perspective on what’s happening in Antarctica here.
How the New Climate Denial is Like the Old Climate Denial. The Atlantic reports: “…This rhetorical stance—yes, climate change is real, and yes, human activity is implicated, but we don’t know how much human activity is to blame—is fast becoming the go-to position for conservatives. In confirmation hearings last week, Senator Ed Markey asked Scott Pruitt, Trump’s pick to head the Environmental Protection Agency, if he agrees with Trump that global warming is a “hoax.” Pruitt replied that he does not. But later, under questioning by Senator Bernie Sanders, Pruitt refused to say how much change is caused by human activity. He would say only that the “climate is changing, and human activity contributes to that in some manner.” When pressed by Sanders on whether he agreed with 97 percent of scientists who have published in peer-reviewed journals that human activity is “the fundamental reason we are seeing climate change,” Pruitt equivocated. “I believe the ability to measure with precision the degree of human activity’s impact on the climate is subject to more debate...”
Photo credit: “An Adelie penguin stands atop a block of melting ice.” Reuters.
Guest Post: Why NOAA Updates Its Sea Surface Temperature Record. Here’s the intro to a long explanation at CarbonBrief: “The National Oceanic and Atmospheric Administration (NOAA) is one of a number of climate agencies that pieces together global temperature from thousands of measurements taken each year across the world’s land and oceans. Last weekend, an article in the Mail on Sunday sparked interest in the way NOAA constructs its temperature record. The claims in the article, widely rebutted shortly after its publication, focused on the most recent version of NOAA’s sea surface temperature (SST) record. I have been involved in the development of this dataset since 2011 and it is due to be updated again shortly. However, an early draft of the journal paper about this update appears to have been circulated amongst media without the permission of the authors (including myself). I have, therefore, decided to make some observations here in a personal capacity that may help make better sense of how the dataset is produced and what it shows…”
Photo credit: “Holley Kelly helps retrieve the CTD/Rosette ensemble, an instrument used to measure the ocean’s conductivity, temperature and depth, from the Bering Strait, June 2011.” Credit: NASA Goddard Space Flight Center.
Here’s What Climate Scientists Told Us About the Louisiana Tornadoes. Here’s an excerpt of an interview at ATTN: “…Whether global warming is having an impact, it’s certainly possible. It’s plausible,” said Keim. “It’s hard to give attribution directly to global warming, but certainly it’s possible and it makes sense, but right now it’s just kind of speculation.” Keim said that high humidity levels do affect the development of tornadoes and that is tied to warmer sea temperatures. “Global warming would lead to warmer temperatures and that would lead to warmer sea temperatures, so you could maybe say that the high humidity levels were party due to global warming, but it’s just too hard to say,” he said…”
How Climate Change May Lead to Bigger Blizzards. Here’s an excerpt from PBS Frontline: “…You have to remember that there are two factors that result in heavy snow: It has to be cold enough to snow, and the atmosphere has to be moist,” said Michael Oppenheimer, a professor of Geosciences and International Affairs at Princeton University. Winters will likely get shorter as a result of climate change, Oppenheimer said. “On the other hand,” he said, “during the period when it is cold enough to snow, if you’ve got enough moisture in the air, you can get some wicked big snowstorms.” Why does climate change lead to more moisture? “The maximum amount of water vapor that can be present increases with increasing temperatures. That’s just a consequence of the laws of physics,” Broccoli said…”

The Republican Carbon Tax is Republican, Say Republicans. You don’t say. Here’s an excerpt from The Atlantic: “…You create a Pigovian tax—a simple tax on an economic externality—that you impose at the places where potential carbon emissions enter the economy: the ports, the refineries, the coal mines. For every ton of carbon dioxide emitted, you charge the emitter $40 to account for the warming caused by the gas. Then, to keep from depressing the economy, you rebate the money from that tax back to Americans in the form of a quarterly check. The tax makes emitting carbon dioxide costly, but it also does not expand the size of the government. And because Americans love getting their quarterly rebate check, they approve as the government increases the tax over time. A higher tax means more money in their pocket (at least at first)...”
Photo credit: Reuters. “James Baker III, the former secretary of state under George H.W. Bush, tours parts of Florida affected by Hurricane Ike in October 2008.”
Not All Republicans Are Against Global Warming Action. Here’s an excerpt from Mother Jones and Newsweek: “…They see the tax as a replacement for the EPA’s regulations on greenhouse gasses, including the Obama administration’s Clean Power Plan. The proposal would also include a border adjustment designed to tax products from countries that do not have a similar carbon price. For these conservatives, a carbon tax would be like insuring against the worst risks of climate change—and they see it as a more efficient solution than EPA regulations. They describe their plan as “win-win”—even if some of them still claim to quibble with the science…”
Photo credit: “
The Big Melt: Global Sea Ice at Record Low. USA TODAY has the latest stats: “There is now less sea ice on Earth than at any time on record. Ice in the Arctic and Antarctic melted to record low levels in January, scientists reported this week. Sea ice is frozen ocean water that melts during the summer and refreezes in winter. It floats on top of the ocean. Arctic sea ice this January averaged 5.17 million square miles, the lowest for the month in the 38-year sea ice record, the National Snow and Ice Data Center said. That is 100,000 square miles less than the previous January record low set just last year…”
Something is Very, Very Wrong with the Arctic Climate. Are we at a tipping point at the top of the Earth? Andrew Freedman provides perspective at Mashable.
Massive Ice Shelf Break Forces Antarctic Researchers to Evacuate. The PBS NEWSHOUR has details and video: “Now to our NewsHour Shares, something that caught our eye that might be of interest to you, too. For more than 60 years, British researchers have monitored changes in the world’s atmosphere from a remote lab in Antarctica. Now, for the first time ever, this facility will close, at least temporarily, to protect the safety of its residents. The NewsHour’s Julia Griffin explains...”

NOAA Scientists Falsely Accused of Manipulating Climate Change Data. Snopes.com takes the latest conspiracy theory apart: “…While Karl et al might reasonably be criticized for having been less than rigorous in their data documentation, their findings have been independently verified, contrary to allegations that the authors manipulated data to reach a desired conclusion:
What David Rose fails to mention is that the new NOAA results have been validated by independent data from satellites, buoys and Argo floats and that many other independent groups, including Berkeley Earth and the UK’s Met Office Hadley Centre, get effectively the same results.
Rose’s claim that NOAA’s results “can never be verified” is patently incorrect, as we just published a paper independently verifying the most important part of NOAA’s results.”
How a Culture Clash at NOAA Led to a Flap Over a High Profile Warming Pause Study. Science AAAS takes a look at the latest scuffle over data and trends: “…If there’s a dirty secret to the 2015 paper, it’s that “there wasn’t a lot of new science in it,” says Karl, who retired in August 2016. It simply assembled the updated, already published NOAA ocean temperature record that their center had been assembling since 2011, and paired it with a published, nonoperational data set of land surface temperatures that included much more coverage around the world. “We said, let’s just put it together, and that’s what made it newsworthy and important.” At its heart, Bates’s concerns amount to a desire for Karl and his team to have more clearly stated that one data set used for their study was not defined by NOAA to have been in a final, “operational” form. One focus is the handling of a new approach to estimating temperatures on land around the globe. The agency’s monthly temperature estimates—which it uses to track climate trends—are drawn from 7000 stations scattered around the world…”
Photo credit: NOAA. “Data collected by satellites, land-based sensors, and NOAA ocean buoys like this are at the heart of the dispute.“
