.png)

.png)
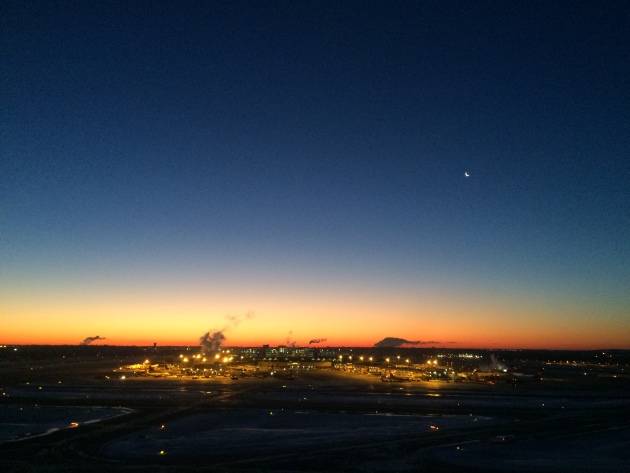
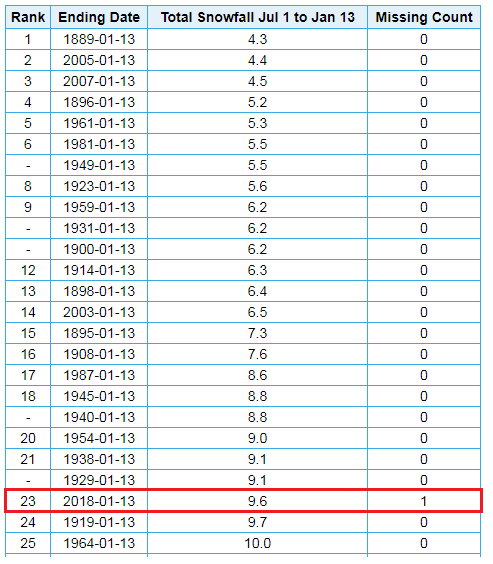
Minnesota Snow Drought
_____________________________________________________________________________
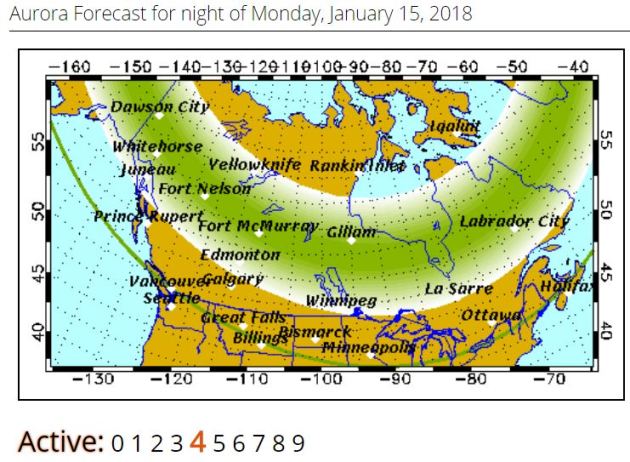
Northern Lights Potential
NOAA has predicted a 45% chance of a G1-class geomagnetic storm as we head through the weekend and early next week. What does that mean? Well, it bascially means that we may be lucky enough to see northern lights! We may be fighting clouds and cold temperatures, but there’s still a chance!
Here’s an excerpt from the University of Alaska Fairbanks Geophysical Institute: “Forecast: Auroral activity will be active. Weather permitting, active auroral displays will be visible overhead from Inuvik, Yellowknife, Rankin and Iqaluit to Juneau, Edmonton, Winnipeg and Sept-Iles, and visible low on the horizon from Vancouver, Great Falls, Pierre, Madison, Lansing, Ottawa, Portland and St. Johns”
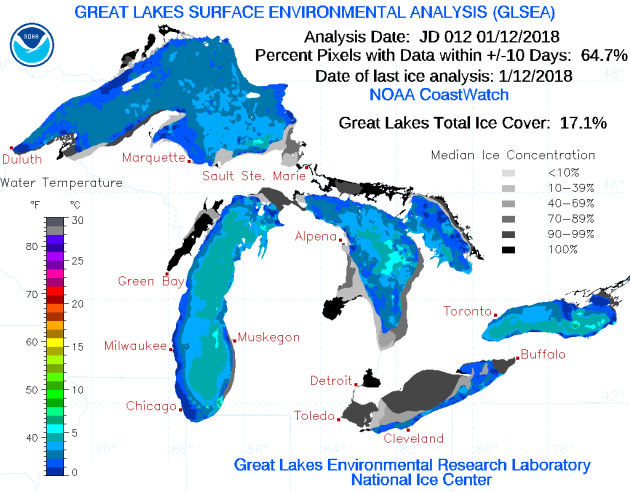
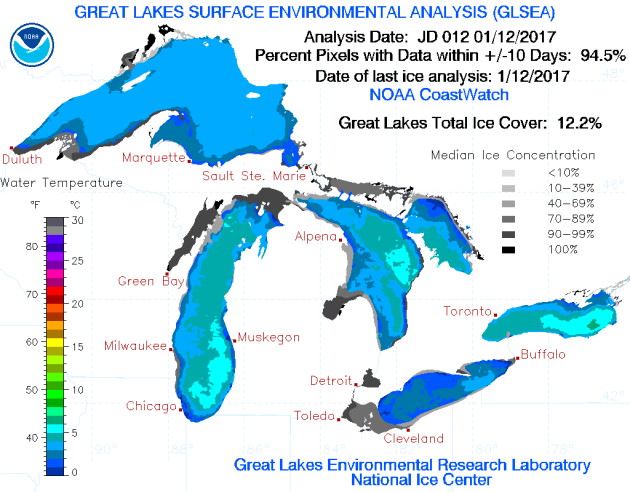
____________________________________________________________________________Lake Superior Ice Coverage
Great Lakes Ice Coverage
_________________________________________________________________________
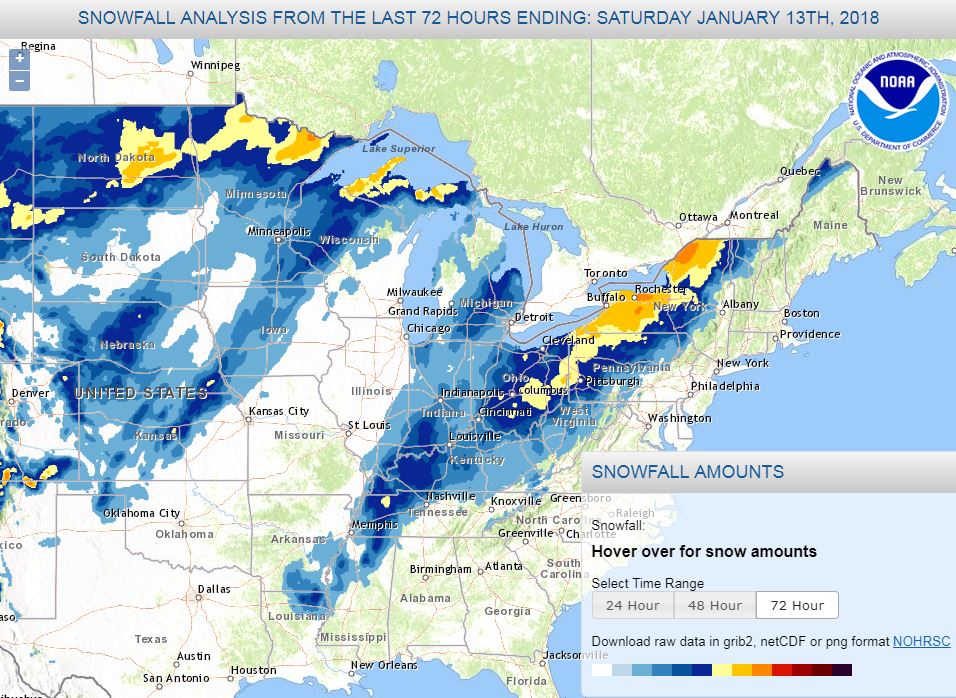
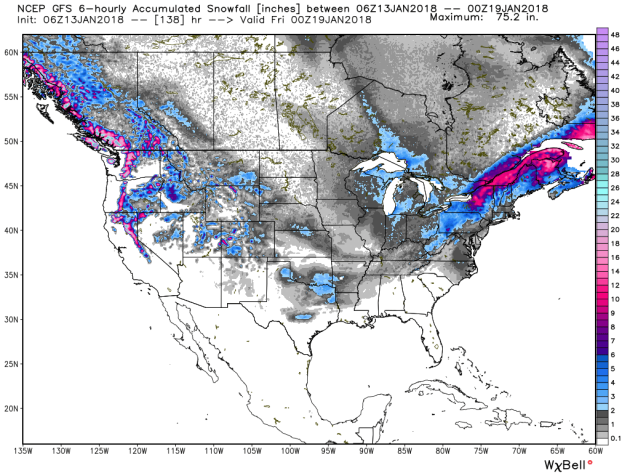
Snowfall Analysis
The same storm system that was responsible for heavy rain, flooding and mudslides across parts of California was also responsible for areas of wintry weather east of the Rockies. Take a look at the snowfall analysis from last week. The first surge of snow brought heavy amounts across parts of North Dakota, northern Minnesota, Wisconsin and the U.P. of Michigan. The second surge of snow brought light accumulations to parts of the Lower Mississippi Valley and then heavier amounts to the Ohio Valley and into the Eastern Great Lakes.
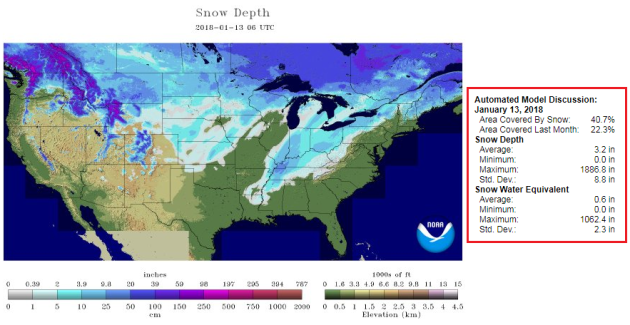
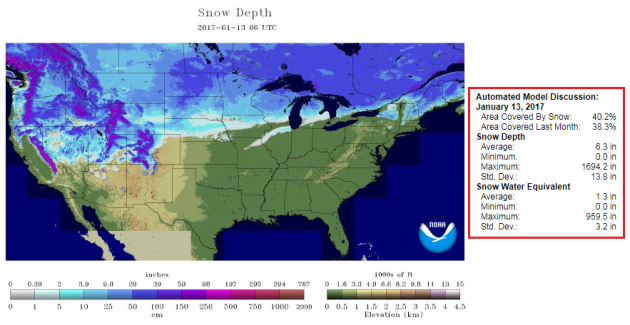
Snow Depth 2018
____________________________________________________________________________
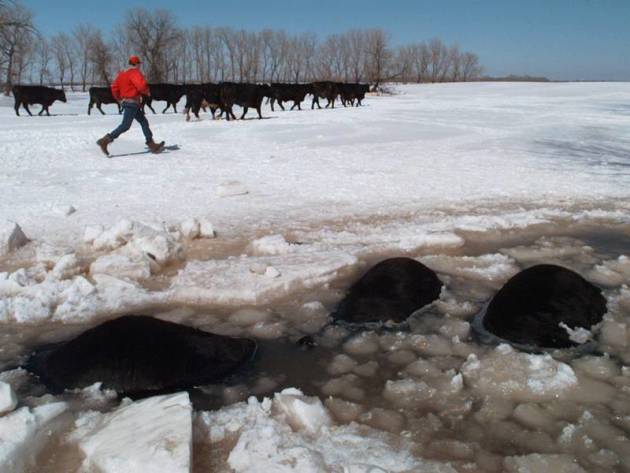
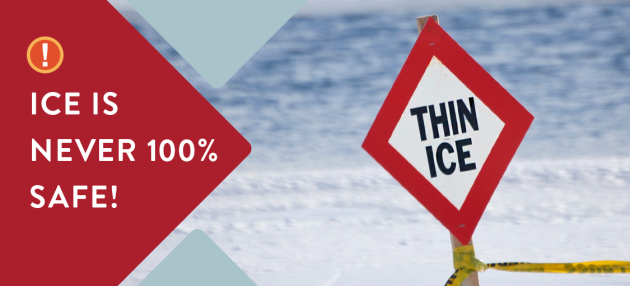
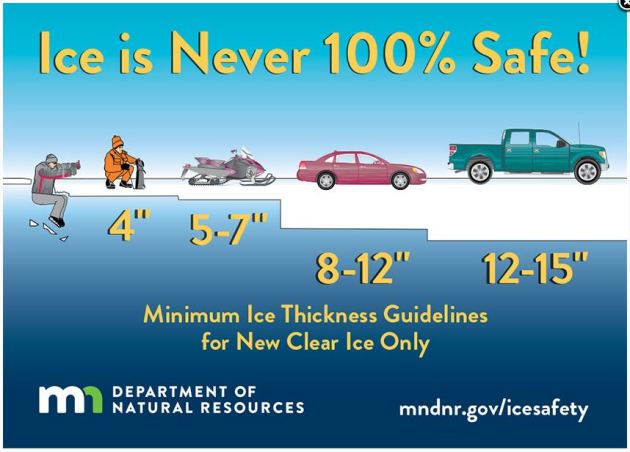
General Ice Thickness Guidelines
Under 4″ – STAY OFF
4″ – Ice fishing or other activities on foot
5″ – 7″ – Snowmobile or ATV
8″ – 12″ – Car or small pickup
12″ – 15″ – Medium truck
Many factors other than thickness can cause ice to be unsafe.
White ice or “snow ice” is only about half as strong as new clear ice. Double the above thickness guidelines when traveling on white ice.
___________________________________________________________________
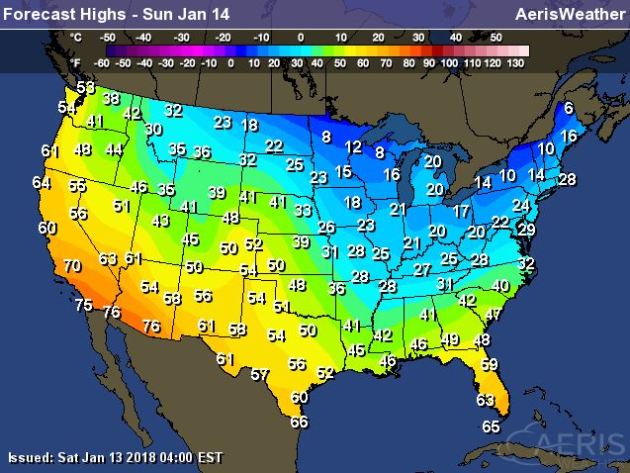
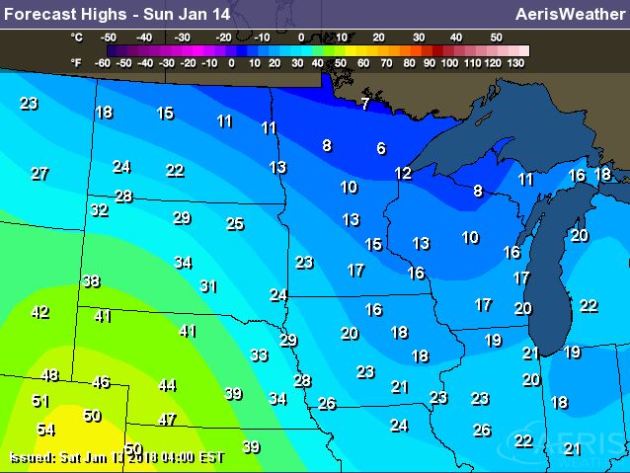
High Temps Sunday
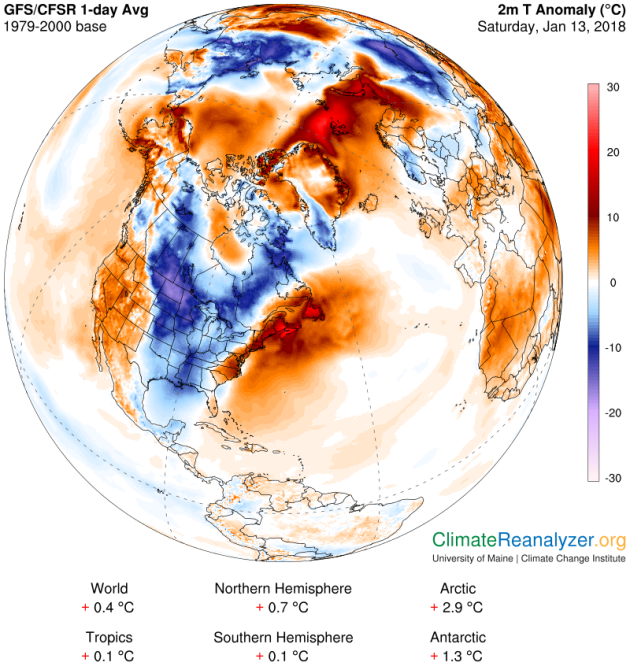
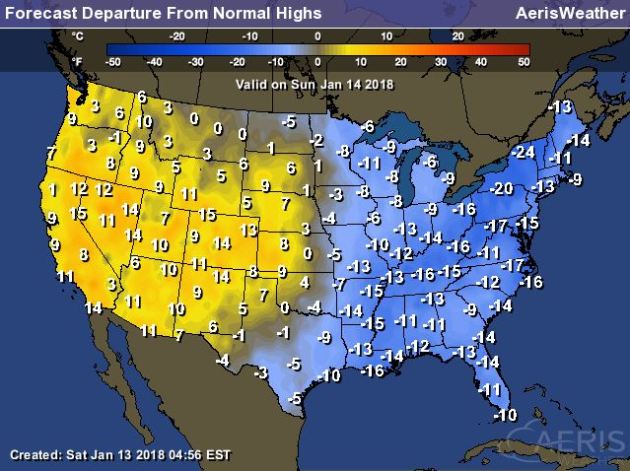
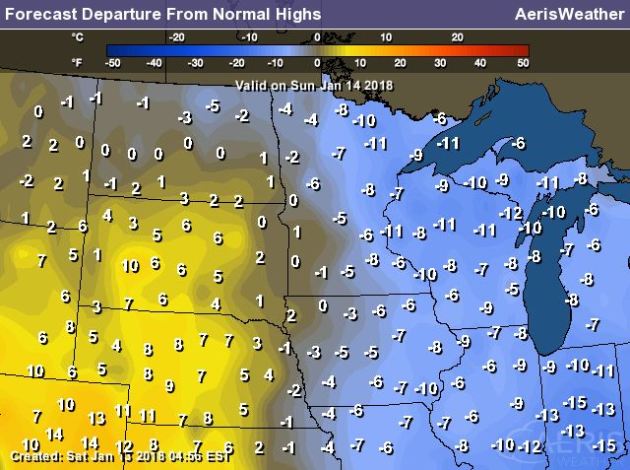
Another surge of Arctic air has splashed in across much of the eastern US with temperatures running -10F to nearly -20F below average! Folks in Florida will be freezing their butts off as well with highs only in the 40s, 50s, and 60s! Note the warmer temps in the western US. These milder temps will actually start moving in at some point next week, which will end the deep freeze for most.
.gif)
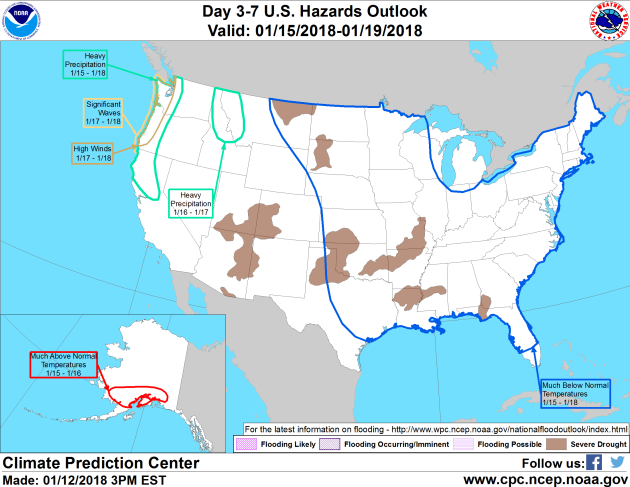
According to NOAA’s WPC, the 5-day precipitation outlook suggests areas of heavy precipitation in the Northern New England States and also in the Northwest. The next surge of Pacific moisture will bring several inches of liquid there with heavy rain in the lower elevations that could lead to flooding, while the mountains will have heavy snow.
.gif)
1.) Periods of much below normal temperatures for most of the central and eastern CONUS, Mon-Thu, Jan 15-18.
2.) Much above normal temperatures for parts of southern mainland Alaska, Mon-Tue, Jan 15-16.
3.) Periods of heavy precipitation for the Pacific Northwest and northern California, Mon-Thu, Jan 15-18.
4.) High winds for the Pacific Northwest coastal region, Wed-Thu, Jan 17-18.
5.) High significant wave heights along the Pacific Northwest coast, Wed-Thu, Jan 17-18.
6.) Heavy precipitation for the northern Rockies, Tue-Wed, Jan 16-17.
7.) Slight risk of much below normal temperatures for eastern Montana, Wed-Thu, Jan 24-25.
8.) Slight risk of heavy precipitation from most of California eastward across approximately the southern halves of both the Intermountain Region and Rockies, portions of the Plains, and from the Mississippi Valley to the Appalachians, Sat-Wed, Jan 20-24.
9.) Moderate risk of heavy precipitation from the Lower Mississippi Valley to the Lower Ohio Valley, Mon-Tue, Jan 22-23.
10.) Severe drought for parts of the Great Plains, the Southwest, the central and southern Mississippi Valley, the Southeast, and Hawaii.
_____________________________________________________________________
By Paul Douglas
________________________________________________________________________
Extended Forecast
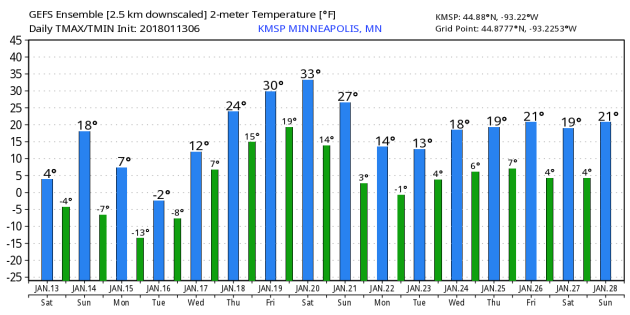
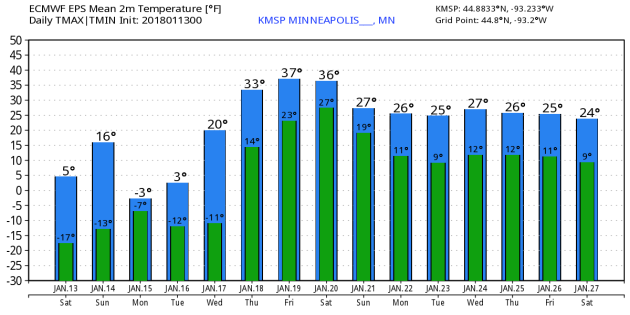
SUNDAY: 2″ to 3″ snow. Icy PM. Winds: S 10-15. Wake-up: -9. High: 16.
SUNDAY NIGHT: Snow tapers, then mostly cloudy and cold! Winds: NW 10-15. Low: -6 (Feels like: -20)
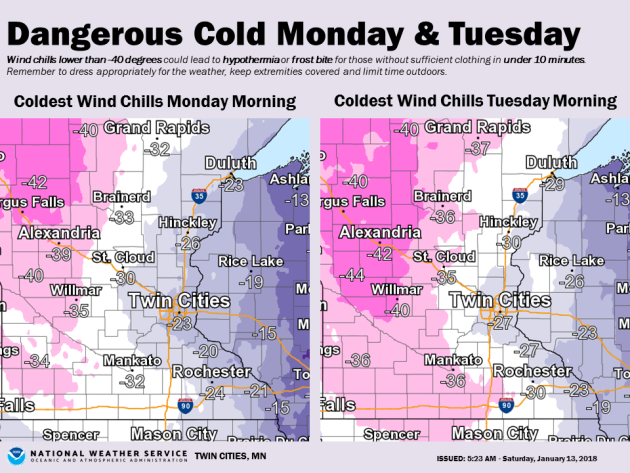
MONDAY: Coldest day. Feels like -25F. Winds: NW 10-20. High: -1.
TUESDAY: Bright sun, less wind. Winds: NW 7-12. Wake-up: -13. High: 3.
WEDNESDAY: Patchy clouds. Close to average. Winds: SW 7-12. High: 21.
THURSDAY: Lots of clouds. Another welcome thaw. Winds: SW 7-12. High: 34.
FRIDAY: Mostly cloudy. Feels pretty good. Winds: S 5-10. Wake-up: 24. High: 37.
SATURDAY: Overcast. Light mix late? Winds: E 7-12. Wake-up: 27. High: 36.
_______________________________________________________
This Day in Weather History
January 14th
1981: Over 24,000 Canada Geese are present at Silver Lake in Rochester.
1952: A sleet and freezing rain storm develops across Minnesota from St Cloud south into Iowa. 1,100 Northwestern Bell telephone wires are knocked down. The Buffalo Ridge in the Pipestone area is the hardest hit with ¾ inches of solid ice on Northern State Power wires with icicles to 3 inches. Northwestern Bell reported ice up to 1 ½ inches on their wires in the same area. Thunder and a shower of ice pellets accompanied the storm in New Ulm and Mankato. Minneapolis General Hospital treated 81 people, victims of falls on icy streets.
_______________________________________________________
Average High/Low for Minneapolis
January 14th
Average High: 23F (Record: 49F set in 1944)
Average Low: 7F (Record: -26F set in 1972)
Record Rainfall: 0.34″ set in 2001
Record Snowfall: 4.4″ set in 1999
_________________________________________________________
Sunrise/Sunset Times for Minneapolis
January 14th
Sunrise: 7:48am
Sunset: 4:57pm
Hours of Daylight: ~9 hours & 9 minutes
Daylight GAINED since yesterday: ~ 1 minute & 43 seconds
Daylight GAINED since winter solstice (December 21st): 23 minutes
__________________________________________________________
Moon Phase for January 14th at Midnight
1.8 Days Before New Moon
.gif)
_________________________
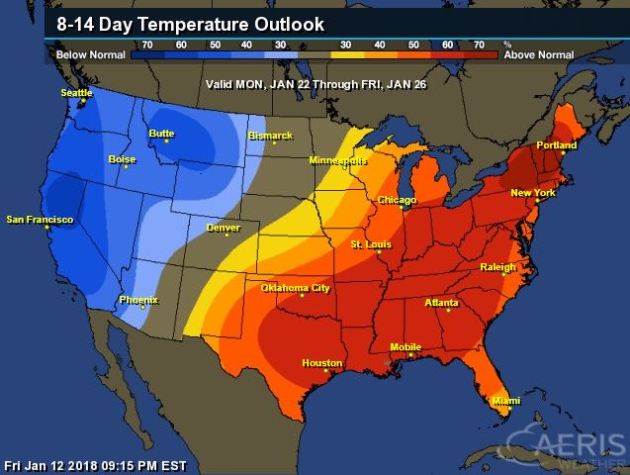
Here’s the temperature outlook as we head into the 4th week of January, which suggests that warmer than average temperatures will be in place again across much of the Great Lakes, Ohio Valley and into the Central US! However, note the colder air lurking just to the west. At this point, there is no reason to believe that another surge of Arctic air will move in later this month, but stay tuned!
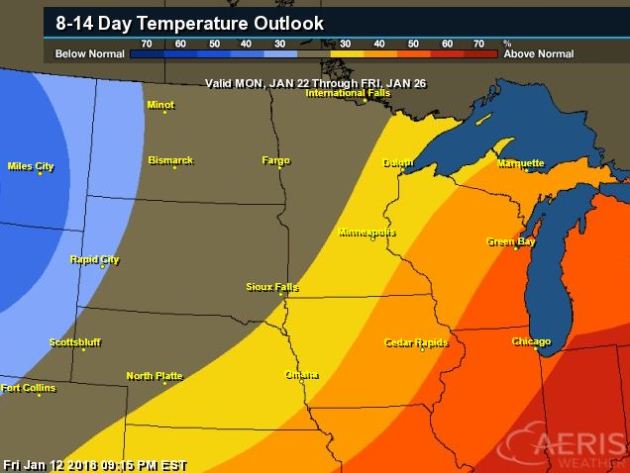
8 to 14 Day Temperature Outlook
The Arctic air mass that is currently impacting the eastern half of the country will fade at some point next week. After that, it appears that warmer than average temperatures will return to much of the eastern half of the country during the 4th full week of January. However, colder than average temperatures will be found in the western half of the country.
________________________________________________________________________________
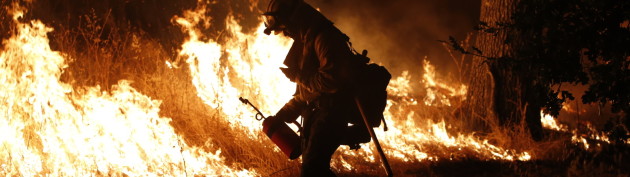
“Winter storm brings destructive mudslides to California in January 2018”
“Heavy rains led to tragedy in California this week, after a winter storm passing over Southern California led to mudslides and debris flows that killed at least 17 people according to the New York Times. This infrared satellite image shows the storm draped around Los Angeles on January 9, 2018. The coldest cloud tops (an indication of vigorous convection and rainfall) are in shades of light blue and white, while the relatively warm waters of the Pacific are pink. Very hot land surfaces in the desert basins of southernmost California and Baja, Mexico, are yellow. Given the state’s hilly terrain and development patterns—homes perched on the edge of the cliffs and slopes to take advantage of stunning views—mudslides during the area’s wet winters are not uncommon. However, the devastating fires that scorched this same region in December likely increased the risk of erosion and may have made debris flows more dangerous. Following a severe fire, the soil can be coated with a waxy, water-repellent residue that prevents rain from penetrating the soil, and the increased runoff sweeps up soil, rocks, and dead timber.”

_________________________________________________________________________
______________________________________________________________________________
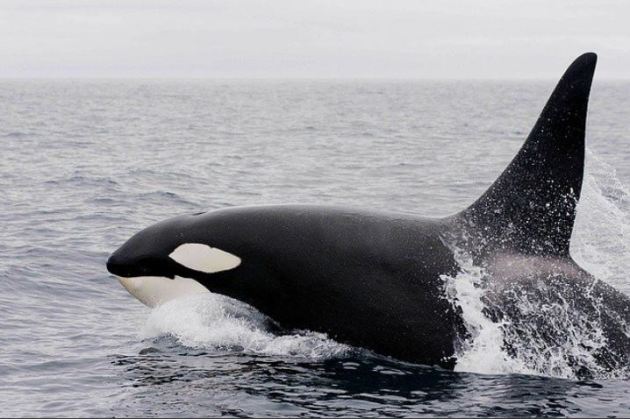
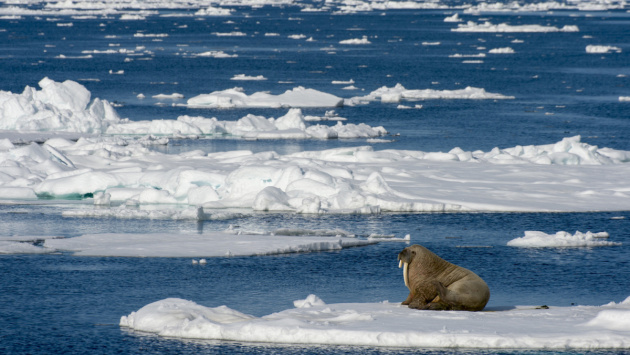
“Last week, at a New Orleans conference center that once doubled as a storm shelter for thousands during Hurricane Katrina, a group of polar scientists made a startling declaration: The Arctic as we once knew it is no more. The region is now definitively trending toward an ice-free state, the scientists said, with wide-ranging ramifications for ecosystems, national security, and the stability of the global climate system. It was a fitting venue for an eye-opening reminder that, on its current path, civilization is engaged in an existential gamble with the planet’s life-support system. In an accompanying annual report on the Arctic’s health — titled “the Arctic shows no sign of returning to reliably frozen region of recent past decades” — the National Oceanic and Atmospheric Administration, which oversees all official U.S. research in the region, coined a term: “New Arctic.””
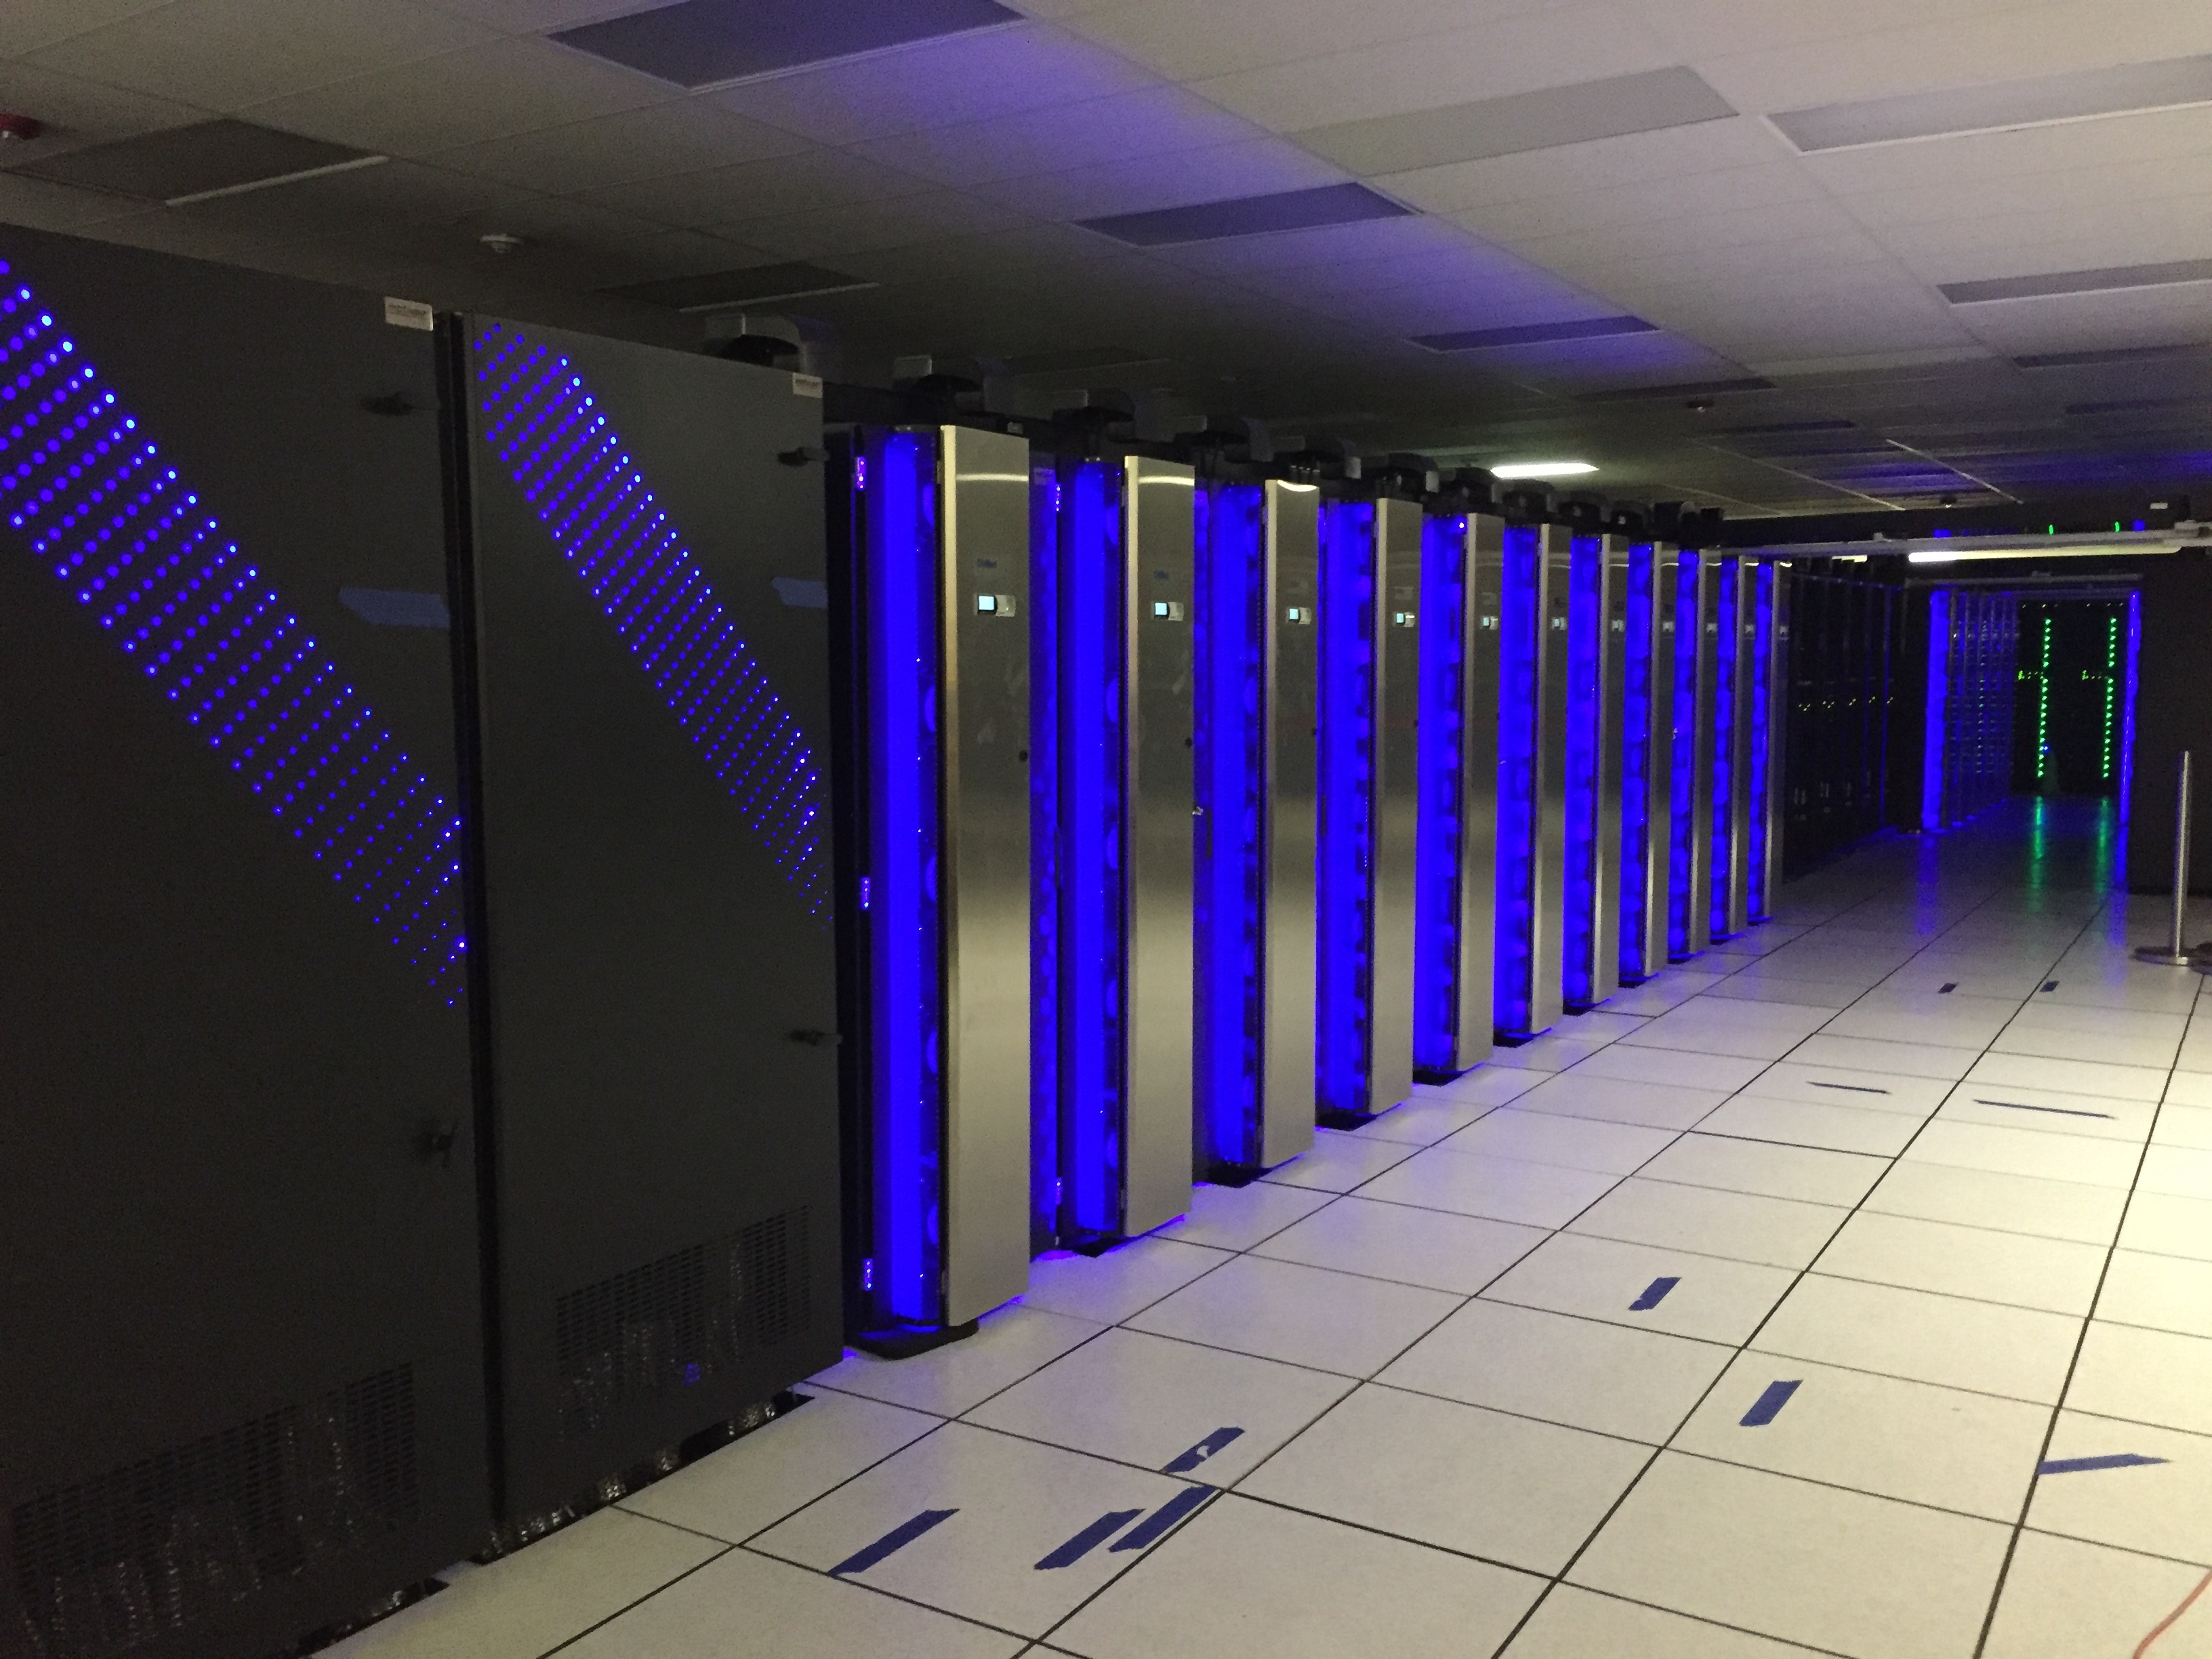
____________________________________________________________________________“NOAA kicks off 2018 with massive supercomputer upgrade”
“Faster computers with more storage will boost accuracy, efficiency of U.S. weather models. NOAA’s combined weather and climate supercomputing system will be among the 30 fastest in the world, with the ability to process 8 quadrillion calculations per second, when two Dell systems are added to the IBMs and Crays at data centers in Reston, Virginia, and Orlando, Florida, later this month. “NOAA’s supercomputers play a vital role in monitoring numerous weather events from blizzards to hurricanes,” said Secretary of Commerce Wilbur Ross. “These latest updates will further enhance NOAA’s abilities to predict and warn American communities of destructive weather.” This upgrade completes phase three of a multiyear effort to build more powerful supercomputers that make complex calculations faster to improve weather, water and climate forecast models. It adds 2.8 petaflops of speed at both data centers combined, increasing NOAA’s total operational computing speed to 8.4 petaflops — or 4.2 petaflops per site.”
______________________________________________________________________
Thanks for checking in and don’t forget to follow me on Twitter @TNelsonWX