83 F. high in the Twin Cities Monday.
81 F. average high on June 23.
84 F. high on June 23, 2013.
+.8 F. June temperatures are running nearly 1 degree F. warmer than average, to date.
June 23 in Minnesota Weather History. Source: NOAA.
2002: Heavy rains fell on already saturated ground on 24. 5.50 inches fell at Delano. Half of a mobile home park at Howard Lake was evacuated due to rising water.
1972: Frost across eastern Minnesota. Duluth had a low of 35 and Tower bottomed out at 32.
Lightning Aware
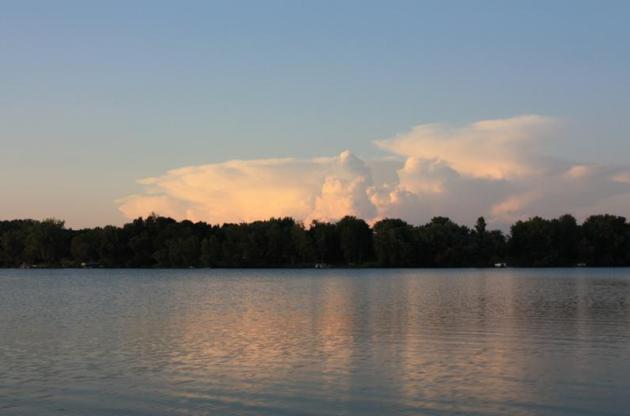
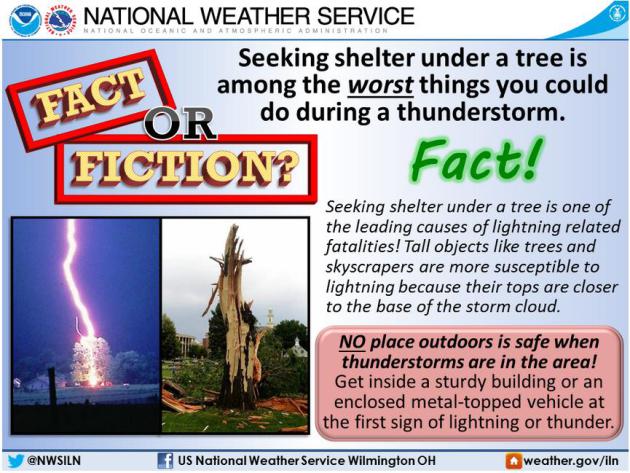
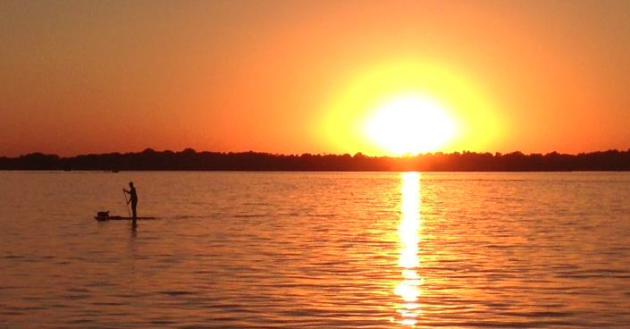
This is Lightning Safety Awareness Week across the USA. Odds are you’ve had an unpleasant close encounter with a lightning strike or two – it can be a religious experience.
It turns out the most dangerous time is at the beginning and end of a storm, when rain isn’t falling. This is when people are often out on a lake or golf course, “pushing the weather”, and their luck in the process.
Just because it’s not raining doesn’t mean there isn’t a high threat of lightning, which can travel up to 10 miles from the parent thunderhead.
Lightning is lazy, often striking the tallest object in the area. NOAA data shows 37 percent of lightning fatalities since 2006 were water-related. Stay off the lake or beach when storm clouds threaten. That first growl of thunder? Head indoors.
Since 2006 81 percent of lightning victims have been men. Because men, as a rule, are more stubborn? My wife thinks so. Possibly, but more men work outside, more vulnerable to the elements.
We cool off a bit the next couple of days; a few instability showers pop up this afternoon, but dry weather should be the rule into Friday as Minnesota sees a much-needed break. Heavier T-storms fire this weekend as dew points rise; highs surging into the 80s. We may finally hit 90F next week. Yes we’re due for a hot front.
A dry front would be nice too.
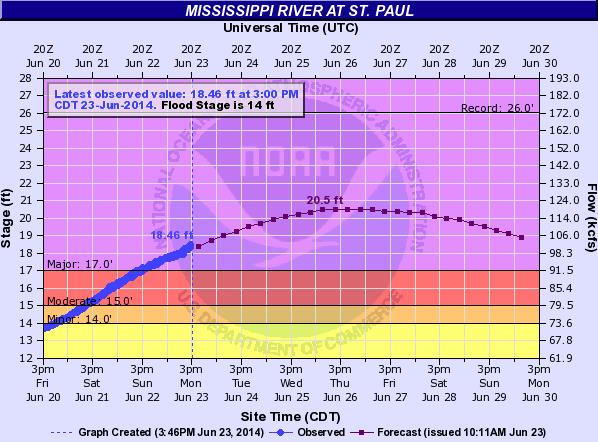
Latest Mississippi Crest Forecast for St. Paul. The City of St. Paul has the latest forecast from NOAA’s North Central River Forecast Office, along with expected impacts. A crest between 20 and 21 feet is expected late Wednesday into Friday, still 5 1/2 feet below the record 1965 crest of 26 feet.
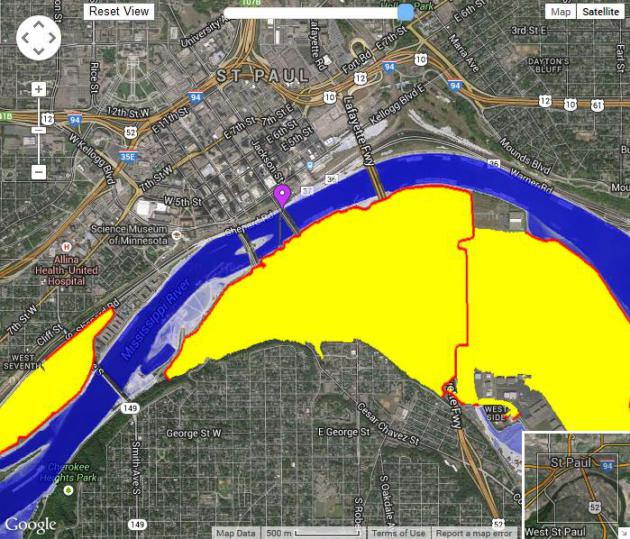
Impact on St. Paul. NOAA has an interactive tool that allows you to see which areas may be impacted by a forecast crest of 20.5 feet at St. Paul; Shepard and Warner Roads, St. Paul Downtown Airport (Holman Field) and even some high water approaching Kellogg Blvd East near Lafayette Freeway.
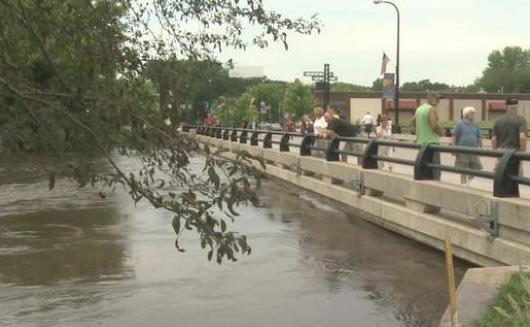
River Flooding Will Continue In Upper Midwest. USA TODAY has an overview; here’s an excerpt: “River flooding in the upper Midwest continues due to extremely heavy rain earlier in the month. Nearly 100 gauges were at some level of flood stage in the upper Midwest on Monday, with 14 listed at “major” flood stage, the National Weather Service reports. Many are along the Mississippi River in Minnesota, Iowa, Illinois and Missouri…”
Photo credit above: “The Crow River rises above the base of a bridge in Delano, Minn., as the river nears its crest on June 22.” (Photo: KARE-TV).
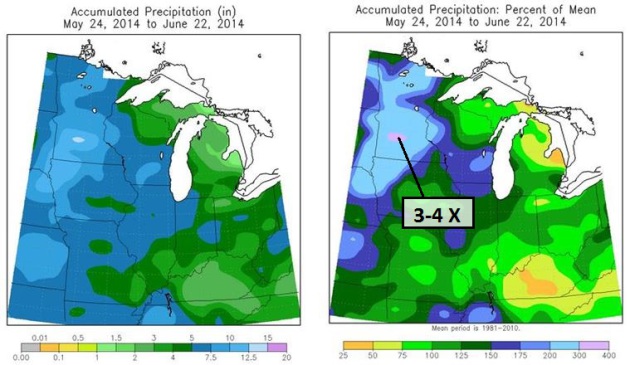
30-Day Rainfall and Percentage of Mean. Over 12″ of rain has doused portions of central Minnesota in the last 30 days; a huge portion of central and southwest Minnesota has been inundated with 10″ or more. June is the wettest month of the year, on average, but some of the amounts west of Willmar are 3 to 4 times the normal amount. Maps: Midwest Regional Climate Center.
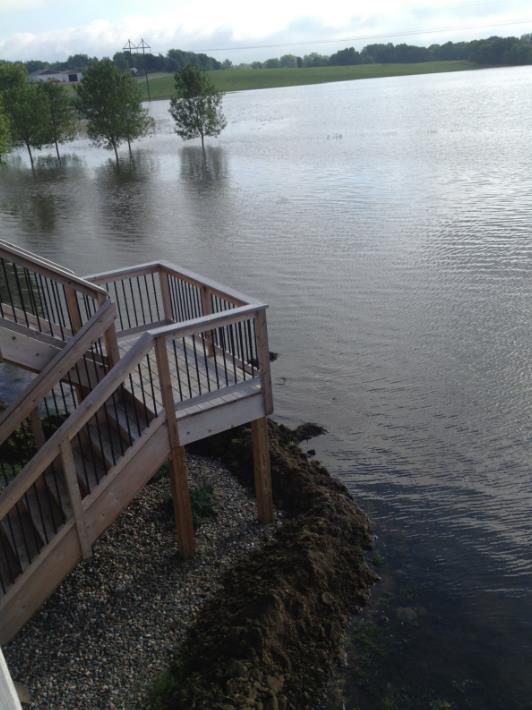
A Harrowing View. LaRae Rogers works for us at Media Logic. She has a beautiful, newly constructed home about 1/2 mile from the Crow River near Delano. Until this week, when the Crow River crept right up to the foot of her deck. Thousands of Minnesotans are facing similar challenges, ranging from outright river flooding to wet basements to submerged docks as 2014 turns into a wet weather year for the record books.
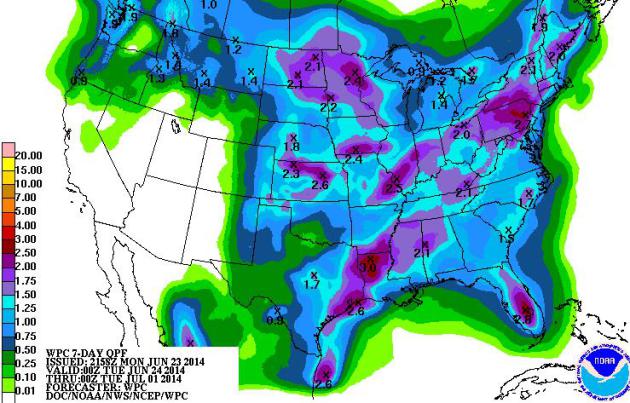
7-Day Rainfall Outlook. NOAA guidance shows some 1.5 to 2″ amounts between now and next Tuesday, July 1, across Minnesota, western Wisconsin, the eastern Dakotas and a wide swatch from Houston and St. Louis to Indianapolis, Cleveland and Wilkes-Barre, PA.
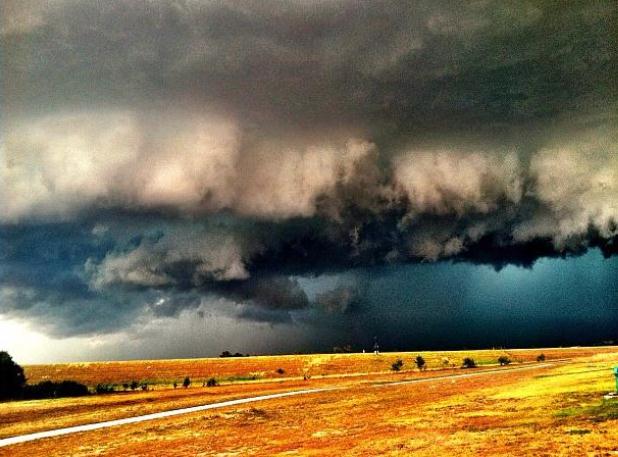
A Dirty High. As opposed to a fresh, invigorating January bubble of Canadian high pressure. A cold storm aloft ignites a few afternoon showers and possible T-showers today; generally dry weather much of Wednesday and Thursday, but an isolated shower can’t be ruled out. No torrential rains though. The chance of T-storms increases by Friday and Saturday as sticky southerly winds pump 70-degree dew point air back into Minnesota. 84 hour NAM guidance: NOAA.
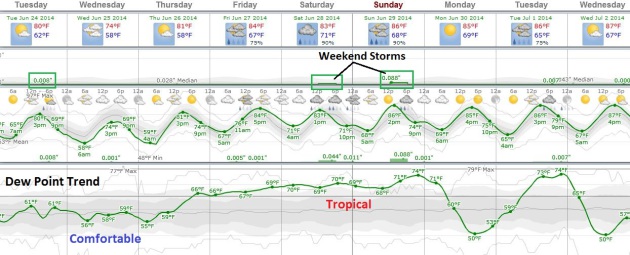
A Quieter, More Comfortable Week. In spite of showers this afternoon, much of the next 72 hours will be dry, giving fields a chance to drain, rivers will be cresting across most of Minnesota by Thursday. Dew points drop into the 50s Wednesday, fairly comfortable for late June. By the weekend dew points top 70F as muggy air surges north, sparking a few T-storms Saturday and Sunday. Graph: Weatherspark.
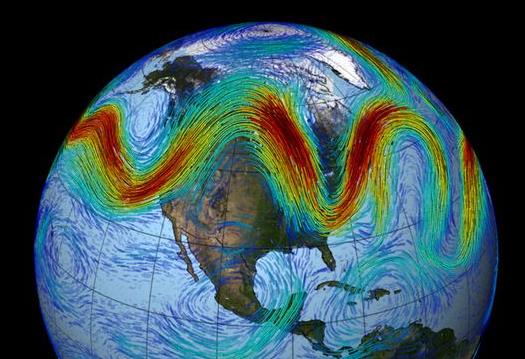
What’s Up With The Wild Extremes of Weather? The data is preliminary and the science still in motion, but there’s growing evidence that differential heating of the Northern Hemisphere (Arctic and far northern latitudes warming faster than mid latitudes) may be impacting jet stream wind speeds and configurations, leading to more meandering high amplitude patterns that can increase the potential for flooding rains or sudden drought and heat. Here’s a clip from a good explanation at USA TODAY: “…The methodology and findings are very sound,” agreed research scientist Jennifer Francis at Rutgers University, also not part of the study. She said its main contribution is a findingthat large north/south waves in the jet stream’s path cause slow-moving weather patterns that frequently lead to extreme weather. The weather extremes the authors analyzed in the study were month-long heat waves, cold spells, droughts and prolonged wet periods, which occurred over large areas of the world from 1979-2012…”
Graphic credit above: “The polar jet stream is a band of fast winds high in the atmosphere that marks the boundary between cold polar air and warmer air to the south. When large waves develop in the flow, cold Arctic air moves south (as seen here over eastern US) and warmer temperate air moves north (as seen here are central US). Such “wavy” conditions increase the chance of temperature and precipitation extremes.” (Photo: NASA)
* the paper referenced in the USA TODAY article can be found at nature.com.
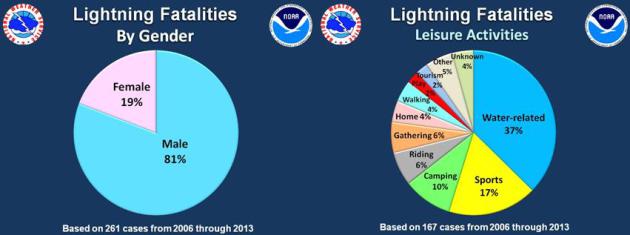
Lightning Safety Awareness Week: June 22-28. Here are some good resources from NOAA regarding lightning safety – as you can see water-related lightning deaths and injuries are at the top of the list for leisure activities, and men are far more likely to be struck than women. Why? More men work outside than woman, and my wife would point out that men tend to be more stubborn. “I paid my $50. I’m going to play all 18 holes even if it kills me!” Here’s an excerpt: “Summer is the peak season for one of the nation’s deadliest weather phenomena–lightning. Though lightning strikes peak in summer, people are struck year round. In the United States, an average of 51 people are killed each year by lightning, and hundreds more are severely injured.”
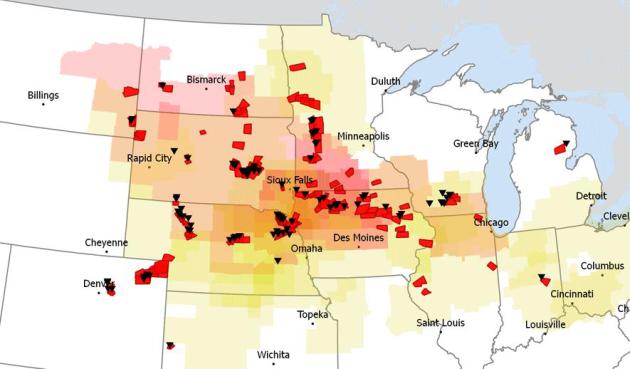
Tornado Digest: 3 Big Days in June; A Strong Finish To Thhe Month? Here’s an excerpt of a good recap of last week’s tornado outbreaks from United States Tornadoes: “Unlike the first two weeks of June, this one did not include tornado reports every day. But three days went big, with one going huge. June 16 was the largest regional outbreak of June 16-18 outbreaks, with multiple cells dropping a handful or more tornadoes into the night from the Plains into the Midwest. Four of those tornadoes were rated violent, with the now famed Nebraska twins creating Hollywoodesque visuals. June 17 and June 18 were no slouches either...”
Map credit above: “Tornado activity across the United States from June 15-21, 2014. Note: Several reports and warnings outside this map are also included in number counts on the map.” For a full picture, see here.
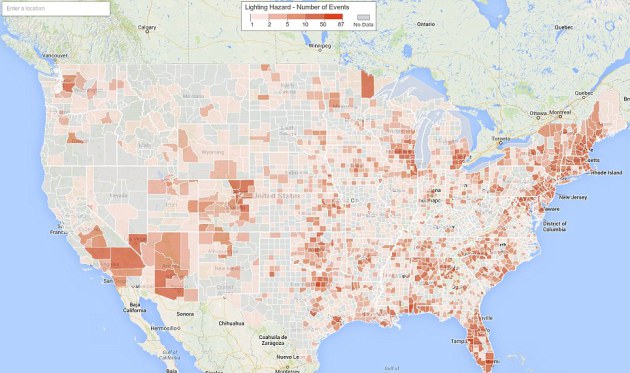
Where In The U.S. You’re Most Likely To Be Struck By Lightning. I found this interesting, an excerpt from a story, courtesy of Google Maps Gallery and earthsky.org: “Lightningophobes, take note. Here’s a new map, arranged by county, showing – over a 15-year period – injuries, fatalities, and instances of property and crop destruction, caused by lightning. Darker-red areas show where the lightning events have tended to happen more regularly. The most populated areas suffer the most lightning fatalities, of course. The map is part of Google Maps Gallery. It is called “Lightning Spatial Hazard Events and Losses for the United States, 1995-2009…”
Map credit: Google Maps Gallery. “Where in the U.S. you’re most likely to be struck by lightning, by county.”

10 Useful and Innovative Google Services You May Not Know About. I consider myself fairly Google-proficient, but there were a few services here I wasn’t aware of, either. Here’s a clip from a good summary at Gizmag: “…Google Person Finder was created as a means of enabling people to reconnect with friends and family after natural and humanitarian crises. It was developed following the the attack on the World Trade Center buildings in 2001 and is part of Google’s wider Crisis Response arm. Person Finder has been deployed for use a number of times, including in response to Typhoon Yolanda, the Boston Marathon Explosions, the 2013 Uttarakhand floods and Tropical Cyclone Phailin…”

TODAY: AM sun, a few PM showers and T-showers, most numerous north of MSP. Winds: NW 10-15. High: 77
TUESDAY NIGHT: Evening shower, then clearing and cooler. Low: 58
WEDNESDAY: Partly sunny, comfortable. Dew point: 57. High: 75
THURSDAY: Mix of clouds and sun, still dry. Wake-up: 59. High: 79
FRIDAY: Intervals of sticky sun. Dew point: 67. Wake-up: 65. High: 83
SATURDAY: Tropical with more clouds than sun. T-storms likely. Dew point: 70. Wake-up: 69. High: 85
SUNDAY: More sunshine, heavy T-storms later. Wake-up: 71. High: 86
MONDAY: Clearing and very warm, drop in humidity. DP: 57. Wake-up: 62. High: 87
Climate Stories…

How Climate Change Will Affect South Dakota: More Weed Growth; 100-Degree Days. Here’s an excerpt from The Rapid City Journal: “…It’s a forecast that, unlike most of the country, will have some perks for South Dakota. Warmer temperatures will mean a longer growing season and the potential to cultivate corn and soybeans in areas that were previously unsuitable. But the changes will also bear costs. Climate change may mean that certain weeds, like leafy spurge and knapweed, will become more common. Hotter temperatures may mean that insects, like spider mites and grasshopers, will explode in number. And heavy downpours may increase the chance of freak floods — like the one that killed 238 people in the Black Hills in 1972…” (File photo: Granger Smith).

Physicist Offers $10,000 To Anyone Who Can Disprove Climate Change. ThinkProgress has the story; here’s the introduction: “When not refuting the 97 percent of scientists who believe in human-caused global warming, climate change deniers often draw upon the conspiracy that it’s is a fabricated theory invented by those in a position to gain financially or otherwise from efforts to reduce greenhouse gas emissions. A Texas-based physicist is turning that notion on its head by offering $10,000 of his own money to anyone who can disprove mainstream, accepted climate science. Dr. Christopher Keating, a physicist who has taught at the University of South Dakota and the U.S. Naval Academy, says in his blog post that the rules are easy: there is no entry fee, participants must be over 18, and the scientific method must be employed…” (File photo credit above: Shutterstock).
