92 F. high in the Twin Cities Monday.
76 F. peak dew point yesterday at 5:53 PM
84 F. average high on July 21.
81 F. high on July 21, 2013.
July 21, 1972: A significant downpour occurs over a portion of Minnesota, with 10.84 inches of rain in 24 hours at Ft Ripley. 14 inches of rain fell at a farm in Morrison County.
Pool-worthy
I stare at maps, data and statistics until I’m blue in the face, but sometimes a simple, off the cuff anecdote is best at summing up a very strange state of affairs.
Lou works down the hall and yesterday he was shaking his head. “I just took my first dip in my pool on Sunday” he sighed. “My grandkids have already been in, but this is the latest I’ve ever used the pool.” Yes, it’s been a bit cool to use the pool.
By the way that’s the definition of an optimist: a Minnesotan with a pool (or a convertible).
We’ve seen glimpses, flashes of summer, but no prolonged heat waves to speak of. During a typical summer (ha!) MSP picks up 14 days at or above 90F. Yesterday was only our second day above 90F so far in 2014.
The strongest storms rumbled north of MSP; there’s a slight chance of thunder early today, before a northerly breeze pumps more tolerable air into Minnesota. Dew points reach the 50s by Wednesday, when we’ll all be breathing easier.
More T-storms bubble up Thursday night into Friday, and although I can’t promise a thunder-free weekend, there should be enough sun for low 80s.
Another vortex of unusually cool air sets up over the Great Lakes next week, when highs dip into the 70s.
Hunch: maybe we’ll have half a summer?
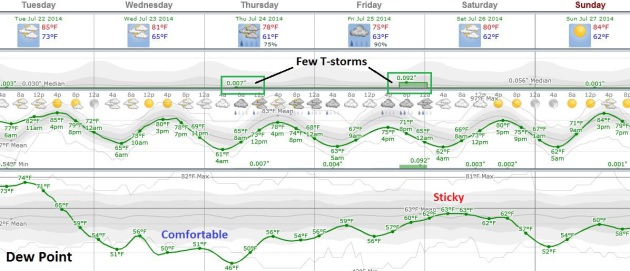
Cooling Down by Midweek. After Monday’s sauna-like dew points in the mid 70s a north to northwest breeze blows drier, cooler, more comfortable air into town later today and tomorrow. In fact a 20 degree drop in dew point by tomorrow means half as much water vapor in the air than yesterday. Another warm frontal passage sparks scattered showers and T-showers Thursday and Friday; low 80s by the weekend. Meteogram: Weatherspark.
60-Hour Rainfall Amounts. NOAA’s 4 km WRF model shows the severe storms that roared across central and nothern Minnesota overnight, along with 2-3″ rainfall amounts. A tropical disturbance enhances rainfall amounts for the Carolinas; potential flooding from the Texas Panhandle into the Mississippi Valley. Loop: HAMweather.
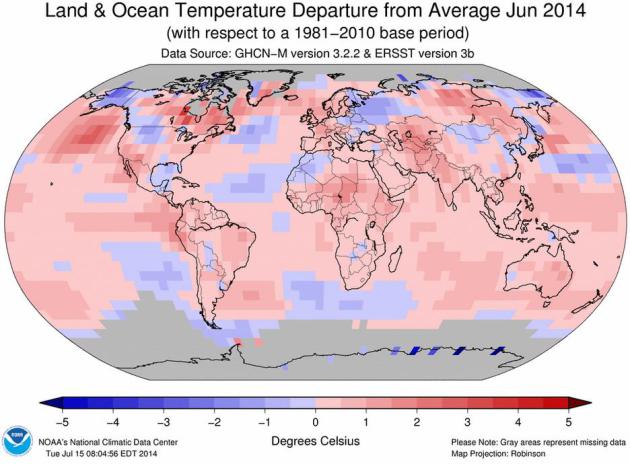
June 2014: Warmest On Record, Worldwide. This follows a record warm May (with little or no influence from a predicted El Nino, at least not yet). Here’s an excerpt from NOAA NCDC: “The combined average temperature across global land and ocean surfaces for June 2014 was record high for the month, at 0.72°C (1.30°F) above the 20th century average. This surpasses the previous record, set in June 1998, by 0.03°C (0.05°F). Nine of the ten warmest Junes on record have occurred during the 21st century, including each of the past five years. June 2014 also marks the second consecutive month with record high global temperatures. With the exception of February (21st warmest), every month to date in 2014 has ranked among the four warmest for its respective month. Additionally, June 2014 marked the 38th consecutive June and 352nd consecutive month with a global temperature above the 20th century average. The last below-average global temperature for June was June 1976 and the last below-average global temperature for any month was February 1985…”
* more on record June warmth worldwide and unusually warm ocean water temperatures from Climate Central.
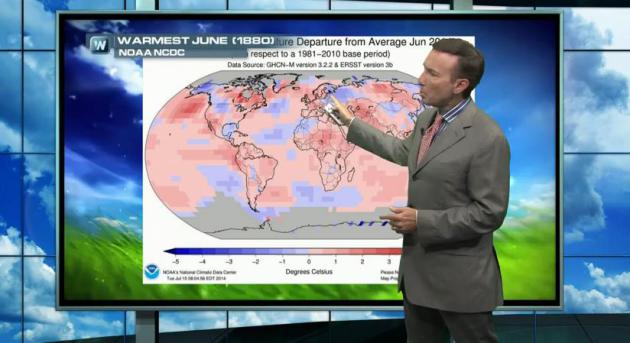
Warmest June, Worldwide, Since Records Started in 1880. This, in spite of La Nada, an absence of El Nino warming in the Pacific. Coming after the warmest May on record, worldwide. That’s the subject of today’s Climate Matters: “NOAA’s National Climactic Data Center stats have come in for the month of June. For the 352nd month in a row, temperatures were above the 20th century average. 9 of the 10 warmest Junes have taken place since 2000 and the oceans are at their warmest since the 1880s. With the warming oceans, what does this mean for the El Niño forecast for this winter?”
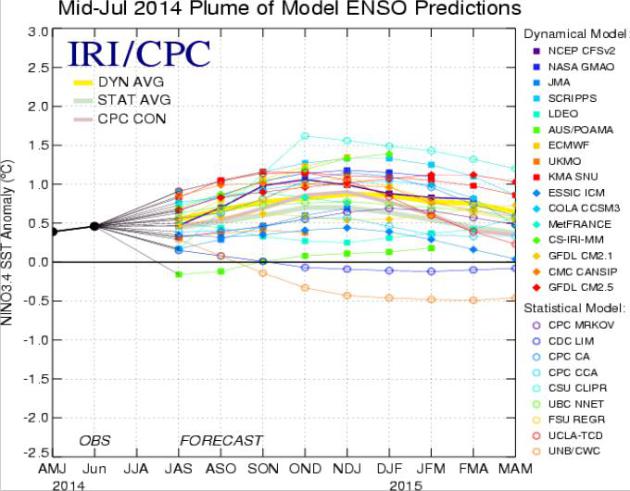
El Nino 2014: Coming Later and Weaker? Although warming of the equatorial Pacific is still underway, the strong westerly push of wind that would bring all that warm water to the surface is lacking, and the prospect of a (major) El Nino seems to be diminishing later this year – which may reduce the probability of soaking rains for California and the western USA. Here’s a summary of ENSO trends from NOAA NCEP.
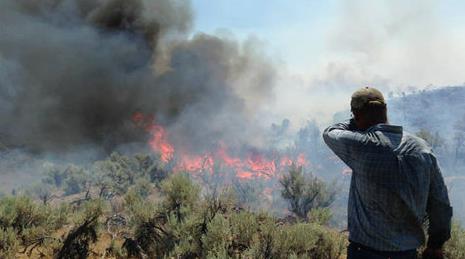
Largest Oregon Wildfire is 4 Times The Size of Portland. KGW.com has an update; here’s an excerpt: “…But the Northwest Interagency Coordination Center said Monday that more lightning with the potential to start more wildfires is in the forecast for northern central Oregon. The largest wildfire burning in Oregon, the Buzzard Complex 45 miles northeast of Burns, reached almost 396,000 acres early Monday morning, roughly four times the area of the Portland city limits…” (AP photo above).

Massive Washington Wildfire Only 2% Contained. Mynorthwest.com has an update and video on the massive fire underway in central Washington State; here’s an excerpt: “The largest wildfire burning in central Washington is over four times larger than the size of Seattle and it’s only two percent contained. The Carlton Complex Fire in the Okanogan-Wenatchee National Forest is 237,890 acres or 371 square miles. It has destroyed at least 100 homes and one person has died while trying to protect his home from the flames. Chelan County Emergency Management says Highway 20 is closed between Twisp and Okanogan…”
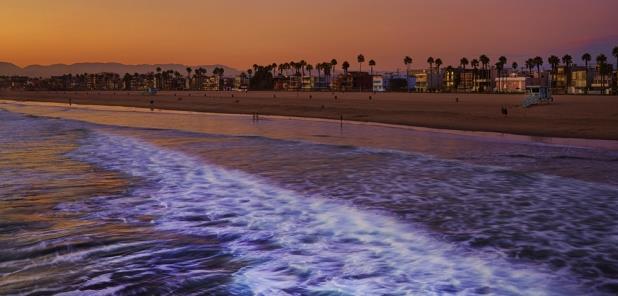
Science Brings Clarity to Shifting Shores. How vulnerable is your favorite beach? Barrier islands aren’t static constructs; they are constantly shifting and evolving over time, in our spite of our best efforts to pave them over. Here’s an excerpt of a story highlighting a new tool from EPA: “…To help ensure safe and resilient coasts, the U.S. Geological Survey (USGS) has created an online tool that allows anyone to interactively “see” past, present and future hazards. This tool — the USGS Coastal Change Hazards Portal — can aid in decisions that involve emergency preparedness, ecosystem restoration, and where and how to develop coastal areas. The tool runs on web browsers, tablets, and smartphones, and is designed for a wide-range of audiences, from federal and state agencies to non-governmental organizations, public entities, and private citizens…”
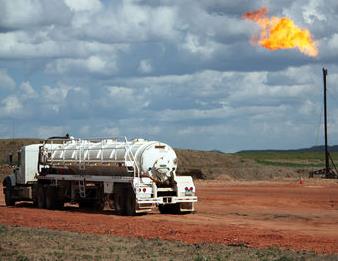
How A Sudden Flood of Oil Money Has Transformed North Dakota. InsideClimate News has the long and fascinating story of what’s happening just to our west. A gusher of cash, but is it sustainable, and ultimately good for the state? here’s a clip: “…Oil development has transformed this state to the point where it’s hard to find a place or person that hasn’t been touched by the boom. Energy companies have drilled more than 8,000 wells into western North Dakota’s rugged prairie since the beginning of 2010, quadrupling the state’s oil production. From July 2011 through June 2013, the state collected $4 billion in oil taxes, and is expecting a $1 billion surplus for the current biennium, not including an oil-funded sovereign wealth fund that will approach a balance of $3 billion. North Dakota is in the uncommon position of facing a labor shortage, spurring a state-run campaign to attract workers, paid for in part by Hess Corp…”
Photo credit above: “In what was once a quiet agricultural region of North Dakota, trucks now clog the roads and hundreds of flares burn off nearly a third of the gas produced by the wells.” Credit: Nicholas Kusnetz/Center for Public Integrity.
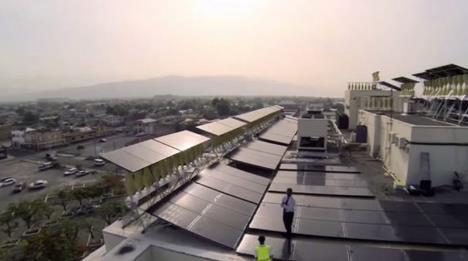
“World’s Largest” Hybrid Renewable Energy Project Unveiled in Jamaica. A combination of solar and wind, in a place that has plenty of both. Makes sense, and soon, dollars and cents. Here’s an excerpt from Gizmag: “Generating renewable electricity at home or in commercial buildings is becoming increasingly viable. WindStream Technologies has installed what it says is the world’s largest wind-solar hybrid array on an office roof in Kingston, Jamaica. The array is expected to generate over 106,000kWh annually...

America’s Airlines Are The World’s Most Profitable And Least Comfortable. Well this comes as a complete shock. Yes, I will pay/fly extra if you promise not to torture me in the air for 2-4 hours. If trends continue we’ll all be hanging upside down (like bats) and fed peanuts with a slingshot within 5 years. Here’s an excerpt from Quartz: “…The poor American performance should be no surprise to the airlines themselves. There’s been a deliberate effort in recent years, especially by American carriers, to make life on an airplane as miserable as possible. The strategy of cultivating loyalty by offering free upgrades has been replaced by one that charges customers for the privilege of comfort. The passenger who gets stuck sitting between a screaming baby and a sick person is more likely to pay extra to take refuge in an aisle, an exit row or a new seating category such as “economy plus” or “comfort economy…”
Photo credit above: “Don’t even think about it.” Reuters/Tobias Schwarz.
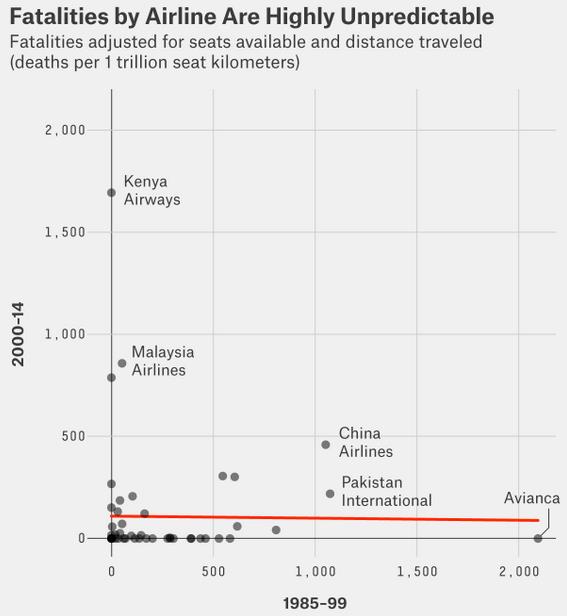
Should Travelers Avoid Flying Airlines That Have Had Crashes In The Past? What is perception vs. reality looking at the statistics? Nate Silver has an interesting analysis at FiveThirtyEight; here’s a clip: “…Our preliminary answer, then, is that an airline’s track record tells you something about its probability of future crashes — although not a lot, and only if looked at in the right way. In particular, you should look toward an airline’s rate of dangerous incidents of any kind rather than its number of fatalities or fatal accidents. These near-misses are more consistent from period to period — and could result in a deadly crash the next time around. But there’s a better rule to follow. If you’re insistent on minimizing your crash risk, you should avoid airlines from developing countries…”
Graphic Credit: Flight Safety Foundation, FiveThirtyEight.

Best Apps To Prevent Travel Disasters. In light of the recent Malaysian Airlines tragedy in the Ukraine and rising instability around the world Huffington Post takes a deep dive with international situational awareness, including an app called “Smart Traveler”. Here’s an excerpt: “…Be the savviest world traveler with this mobile app from the U.S. Department of State, which rounds up official country information, travel alerts, travel warnings, maps, U.S. embassy locations, and more. Check your destination for updated safety and security alerts or access a list of embassies should you need help recovering a lost or stolen passport. You can access the Smart Traveler Enrollment Program, which can help your family and friends reach you in the event of an emergency, such as civil unrest in a foreign country. Best of all, the app features a great airport time-waster: Simply shake your device and get official information about a random country…”
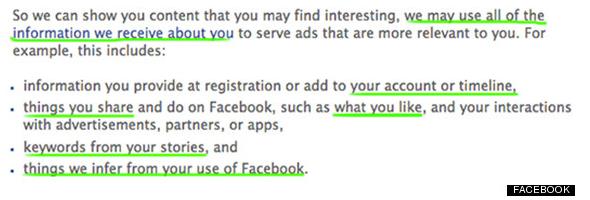
Didn’t Read Facebook’s Fine Print? Here’s Exactly What It Says. Like the part about no (zero) privacy? It’s all about snooping around, trying to target ads. Here’s a clip from Huffington Post that made me take 3 steps away from my laptop: “…While some users may not mind being shown targeted ads to help them pick out a new TV, this example brushes over the full scope of items being marketed to you based on your data. For instance, according to a report from the Center for Digital Democracy, financial service companies have taken to Facebook for “data mining, targeting, and influencing consumers and their networks of friends,” and some companies are developing “new leads for their loan and refinance offers” based on users’ Facebook behavior…”
Meet The Online Tracking Device That Is Virtually Impossible to Block. Well here’s a spot of good news. Careful with those Google searches. Mashable and ProPublica have the story; here’s the intro: “A new, extremely persistent type of online tracking is shadowing visitors to thousands of top websites, from WhiteHouse.gov to YouPorn.com. First documented in a forthcoming paper by researchers at Princeton University and KU Leuven University in Belgium, this type of tracking, called canvas fingerprinting, works by instructing the visitor’s Web browser to draw a hidden image. Because each computer draws the image slightly differently, the images can be used to assign each user’s device a number that uniquely identifies it...”
Image credit above: David Sleight, ProPublica.

The Most Terrifying Thought Experiment of All Time. Worried about AI and the coming “Singularity”? I’m just trying to get through the week, but a lot of uber-intelligent techno-geeks are worried about the coming super (SUPER!) computers, and whether they will be a force for good or evil. Does just thinking about them increase their inevitability? Limitless computer power in the hands of a few billionaires and global conglomerates – what can possibly go wrong? Here’s an excerpt of a brain-teaser from Slate: “…If you believe the singularity is coming and that very powerful AIs are in our future, one obvious question is whether those AIs will be benevolent or malicious. Yudkowsky’s foundation, the Machine Intelligence Research Institute, has the explicit goal of steering the future toward “friendly AI.” For him, and for many LessWrong posters, this issue is of paramount importance, easily trumping the environment and politics. To them, the singularity brings about the machine equivalent of God itself…” (Image credit: Forbes).
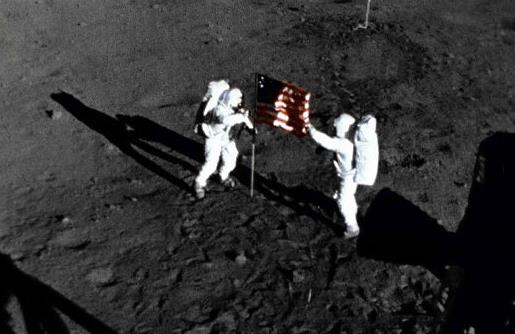
In Event of Moon Disaster. This is chilling, the speech that President Nixon would have read had Apollo 11 astronauts become stranded on the moon. Here’s an excerpt from Letters of Note: “On July 18 of 1969, as the world waited anxiously for Apollo 11 to land safely on the surface of the Moon, speechwriter William Safire imagined the worst case scenario as he expertly wrote the following sombre memo to President Nixon‘s Chief of Staff, H. R. Haldeman. Its contents: a contingency plan, in the form of a speech to be read out by Nixon should astronauts Neil Armstrong and Buzz Aldrin become stranded on the Moon, never to return, followed by some brief instructions relating to its broadcast. Luckily for all those involved, the memo was never needed…” (Image: NASA).

Forget Speed, What’s the “Most Beautiful/Relaxing” Way to Get Across Town? I thought this nugget at gizmag.com was interesting. We’re all in a mad rush, but what if you could plot out the most aesthetically pleasing way to get from Point A to Point B? Here’s a clip: “Sometimes it’s preferable to take the scenic route to a destination rather than the shortest. It’s not an option available on online maps, but a new concept has shown that it could be. Yahoo researchers, in collaboration with the University of Turin, have found a way to quantify the beauty of different places and use the data to give directions. The research, headed up by Daniele Quercia at Yahoo Labs, sought to find a way to suggest routes that are emotionally pleasing. In addition to providing routes that are beautiful, it can provide routes that are quiet or that evoke happiness…”

Finally, Cake From a Spray Can! Here’s another remarkable example of American ingenuity; courtesy of The Boston Globe: “…McCallum wondered if he could borrow the technology from the whipped cream can and create a similar delivery mechanism for cake batter, in which an accelerant releases air bubbles inside the batter, allowing the cake to rise without the need for baking soda and baking powder. To his surprise, it worked…”

TODAY: Slight chance of early thunder, then clearing – still sticky. Dew point: 71. Winds: NW 15+ High: 86
TUESDAY NIGHT: Partly cloudy, a bit less humid. Low: 63
WEDNESDAY: Comfortable sunshine. Dew point: 57. High: 80
THURSDAY: Sun fades, clouds increase, late night storms? Wake-up: 61. High: 79
FRIDAY: More numerous T-storms. Dew point: 60. Wake-up: 63. High: 78
SATURDAY: Partly sunny, isolated T-storm possible. Wake-up: 62. High: near 80
SUNDAY: More sun, lake-worthy. Dew point: 61. Wake-up: 63. High: 83
MONDAY: Sunny start, PM clouds, T-shower. Wake-up: 64. High: 82
Climate Stories….
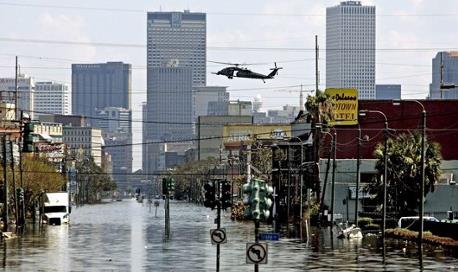
Climate Change Is Far From The Only Cause Of A Rapid Rise in Disasters. It’s a big component, but land use, population and demographic trends are also increasing our vulnerability to disasters around the world. Here’s an excerpt of a story at The Guardian: “…Since 1970, the global population has nearly doubled. Cities have expanded fast, and populations have aged, leaving more people vulnerable to heatwaves. Many of those fastest developing cities are coastal, meaning that more people, infrastructure, and buildings are vulnerable to the flooding caused by storm surges or hurricanes, and enhanced by sea level rise. Even if not on the coast, cities have sprawled onto floodplains, where the poorest find shelter in flimsy buildings. There is simply more stuff, more people and more money in harm’s way than there was 40 years ago. Looked at globally, our exposure and vulnerability have increased markedly…”
Photo credit above: “The aftermath of Hurricane Katrina in New Orleans in 2005, the most expensive disaster in recent history according to the UN.” Photograph: Larry W Smith/EPA.
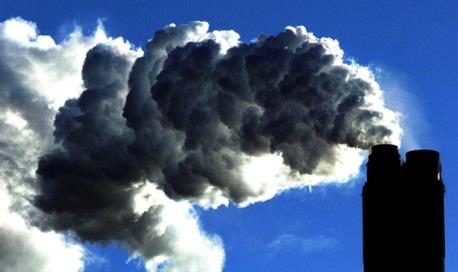
Conservative Groups Spend Up To $1 Billion a Year To Fight Action on Climate Change. Well there’s a nice, big round number. Details and the original study courtesy of The Guardian; here’s a clip: “Conservative groups may have spent up to $1bn a year on the effort to deny science and oppose action on climate change, according to the first extensive study into the anatomy of the anti-climate effort. The anti-climate effort has been largely underwritten by conservative billionaires, often working through secretive funding networks. They have displaced corporations as the prime supporters of 91 think tanks, advocacy groups and industry associations which have worked to block action on climate change. Such financial support has hardened conservative opposition to climate policy, ultimately dooming any chances of action from Congress to cut greenhouse gas emissions that are warming the planet, the study found…”
Photo credit above: “A coal fired plant.” Photograph: John Giles/PA.

Explaining Global Warming in Less Than a Minute. It’s amazing how some grad students aren’t even aware of the basic physics of why increased greenhouse gases are trapping more warmth in the lower atmosphere. The Graduate School of Education at UC Berkeley has a very good explanation that you might want to borrow; here’s a clip: “Earth transforms sunlight’s visible light energy into infrared light energy, which leaves Earth slowly because it is absorbed by greenhouse gases. When people produce greenhouse gases, energy leaves Earth even more slowly – raising Earth’s temperature. And that, in an ultra-brief nutshell, is how global warming works. This 35-word description can be a powerful tool in helping people understand the science behind global warming and climate change, said GSE Professor Michael Ranney, a cognitive psychologist. Global climate change seems urgent, given that it was just announced that November was the 345th straight month with temperatures above the 20th-century average…”
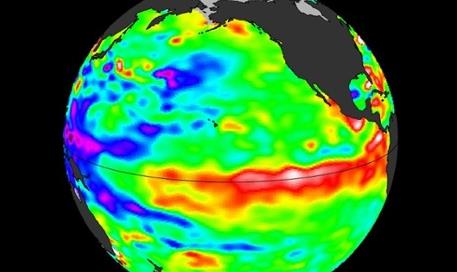
Climate Models Accurately Predicted Global Warming When Reflecting Natural Ocean Cycles. Has a perpetual La Nina cooling event in recent years and unusually strong trade winds masked some of the warming? When a complete look at atmospheric and oceanic trends are examined the much-hyped “pause” in warming doesn’t hold water. The Guardian reports; here’s a clip: “…The results of these studies give us two important pieces of information:
- When they reflect the actual changes in ocean cycles, climate models are quite accurate even in their short-term temperature predictions.
- The short-term slowdown in the warming of global surface temperatures is likely predominantly due to these ocean cycles.
The second point is supported by many recent studies finding that unprecedentedly strong Pacific trade winds have been churning the ocean and funneling more heat to the deeper layers, leaving less to warm the surface. All signs point to this being a temporary change, and once the oceans begin to switch back to more frequent El Niño conditions, we expect to see less efficient ocean heat absorption leading to accelerated warming of global surface temperatures…”
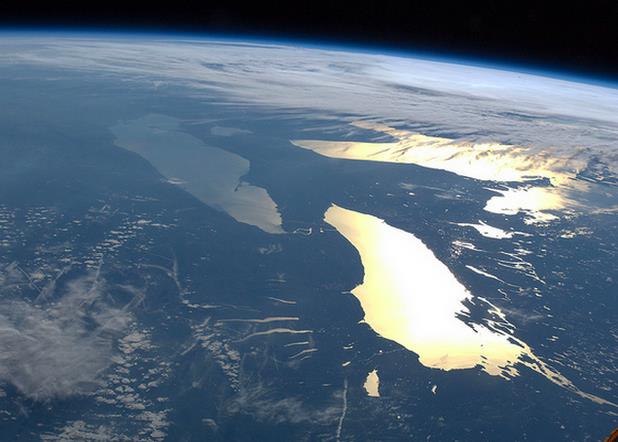
Image credit above: “Data from ocean-observing satellite Jason 2. Shades of red and orange indicate where the water is warmer and above normal sea level.” Credits: JPL/NASA.
“After Water”: How Do You Sleep At Night? How do climate scientists cope? Can you stay scientifically detached, yet optimistic about your kid’s future in an uncertain future? Here’s an excerpt of a story and audio clip from Chicago Public Media’s WBEZ: “…There’s research that backs up Derby’s worry. It shows that if you tell people about a possibly terrible future and you do not give them any sense of hope, they shut down. Scientists worry about that because they want people to act on the research. Morano said almost everyone she spoke to was optimistic technologically and pessimistic politically. “Over and over again people said, we can fix this. But we’re not doing it. And there’s no indication we will.” said Morano. One of the reasons for that political pessimism is because of how we think about time…” (Image credit: NASA).
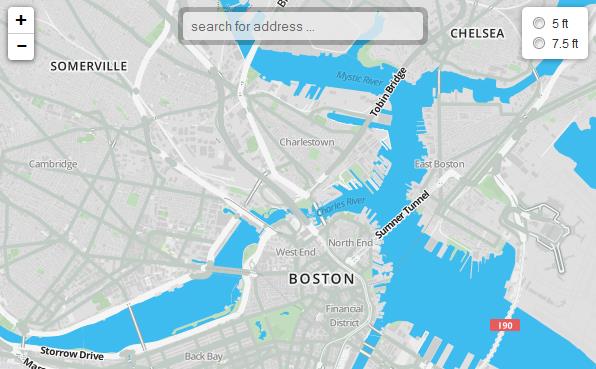
Boston May Need Canals to Combat Climate Change. Will coastal cities have to rob Peter to pay Paul, allowing some neighborhoods to drown while protecting others? WGBH-TV in Boston takes a look at how the city is preparing for rising seas, and more frequent storm surge flooding; here’s a clip: “…The association is preparing to release a report suggesting the city should consider making room for the encroaching water with canals or lagoons. “There’s two big gnarly questions: One is – ‘What parts of the city are going to be allowed to flood, and what parts are we going to invest in to prevent flooding?’” Wormser said. “The other question is, ‘How do we pay for it?’” Boston may not be able to protect everything it wants, she said…”
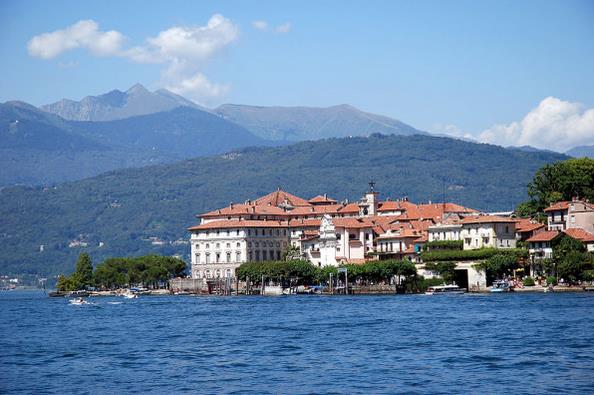
Climate Change Already Having Profound Impact on Lakes In Europe. National Geographic’s News Watch has the story; here’s an excerpt: “…Not only are extreme weather events such as droughts and intense rainstorms becoming more common, climate warming is leading to increased algal growth and more frequent toxic algal blooms. It also affects the entire aquatic food web, including the number, size and distribution of freshwater fish species, according to the latest research. New evidence from studies in Europe shows that a warming climate, in particular, is already having a profound impact on lakes, according to Dr. Erik Jeppesen at Aarhus University in Denmark. As I have noted in earlier posts, this is an important issue because other studies show that lake temperatures are on the rise throughout the world…”
Photo credit above: “Lake Maggiore in Italy is an example of a lake already feeling the effects of climate change. In the 1990s, the population of coldwater fish species such as trout and whitefish declined dramatically.” Photo Credit: mbdortmund, Wikimedia Commons.
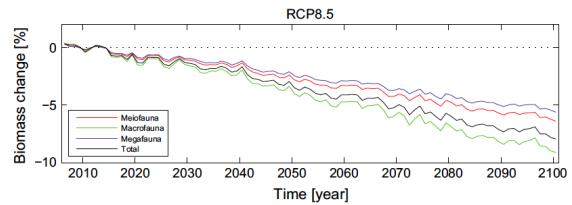
The Predictions of This Model Kills My Love of Models. The author of the paper looking at the impacts of climate change and warming (more acidic) oceans on marine life posted this article at Deep Sea News; here’s an excerpt: “…The premise of model is simple. What happens to the total amount of deep-sea life under climate change? If you took all the critters in the deep oceans and weighed them (we call this total biomass) the weight would be 110,000,000,000 kg (242,508,488,403 pounds). This is the equivalent of 8,661,017 big yellow school buses, 18 times the number of them in the U.S. right now. The model of Jones and colleagues predicts that by 2100 that amount will reduced by 5.2% under continued climate change. That is a loss of life greater than the weight of 45,000 of those big school buses…”
