
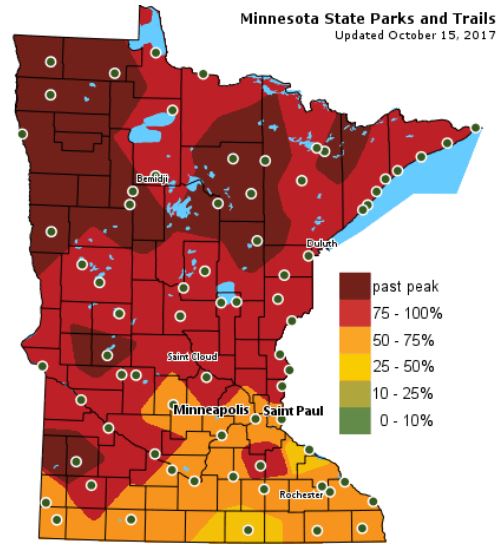
According the MN DNR, much of the state is seeing peak color right now with some spots across western and northern Minnesota already past peak!
Follow along as the fall colors change with the MN DNR map HERE:
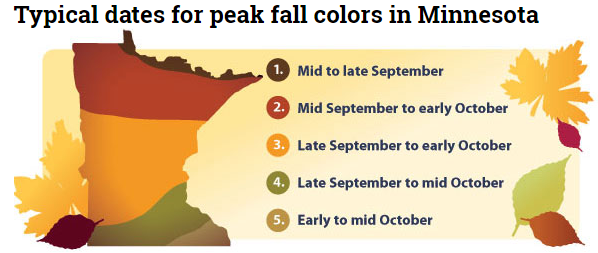
Typical Fall Color Peak in Minnesota
Here are the typical fall color peak times across the state of Minnesota and note that areas along the northern tier of the state usually see their peak toward the 2nd half of September. However, peak color usually doesn’t arrive in central Minnesota until October, but we’re getting close.
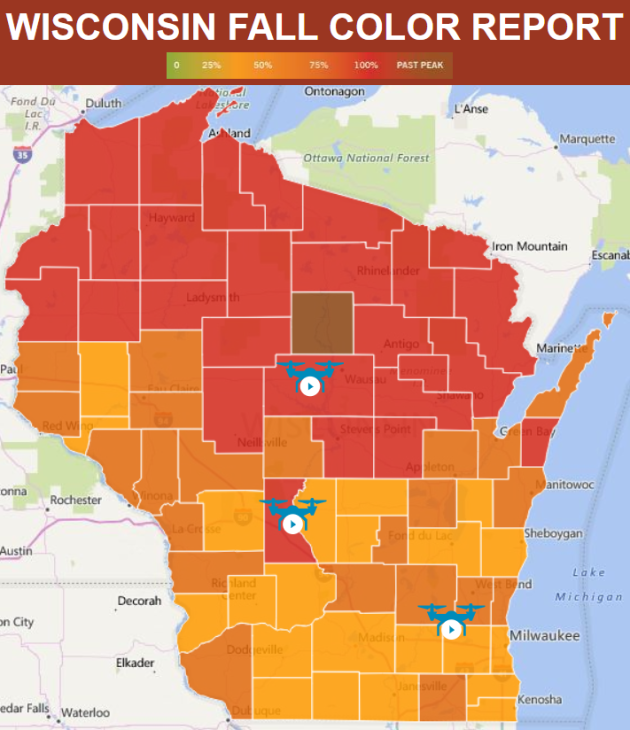
Wisconsin Fall Color Update
Colors are popping in Wisconsin too! In fact, much of the state is seeing peak color right now!
See more from Travel Wisconsin HERE:
_________________________________________________________________
Praedictix Briefing: Sunday morning, October 15th, 2017
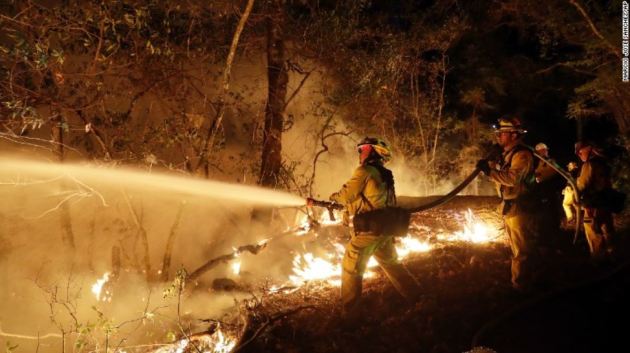
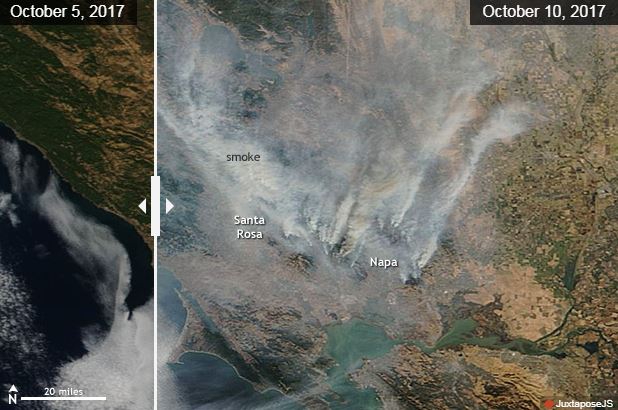
*More than 10,000 firefighters are battling 16 large wildfires that in total have burned over 214,000 acres according to Cal Fire’s statewide fire summary. The death toll from the wildfires has risen to at least 40, with over 20 of those fatalities in Santa Rosa, with hundreds still missing.
*We are monitoring new wildfires in Northern California, which remain small, though not completely contained. These new blazes triggered new evacuations in the Santa Rosa area as well as Mendocino county.
*A state of emergency remains for Solano, Napa, Sonoma, Yuba, Butte, Lake, Mendocino and Orange counties.
*Weather conditions to gradually improve over the next few days, though Sunday remains warm and dry. Off shore winds persist, though are not going to be as strong as Saturday’s gusts.
*According to Cal Fire, since Monday, aircraft across CA have dropped over 2 million gallons of retardant to help aid firefighters on the ground (see graphic below). The amount used on Saturday has not been factored in yet.
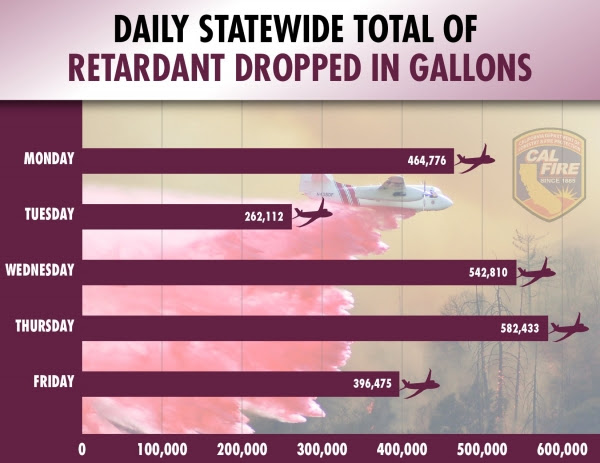
Credit: Cal Fire. Interactive map available here.
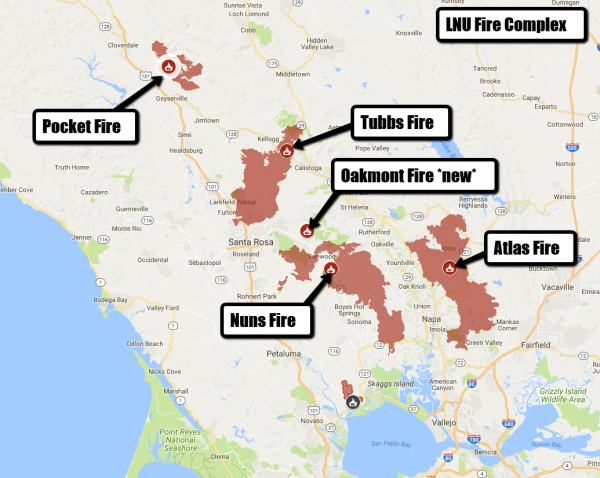
LNU Complex Fires. Firefights have made some progress with containment on Saturday, despite the difficult conditions. Winds reportedly gusted up 40 mph at the ridgetops with extremely low humidity. Some tough news is the development of a new wildfire: the Oakmont Fire. The new blaze is located on the east side of Highway 12 near the Oakmont community. The fire slowed Saturday afternoon, however. For an interactive map of the wildfire parameters, click here.
Central LNU Complex
- Tubbs Fire: 35,470 acres – 50% contained
- Pocket Fire: 11,246 acres – 15% contained
- Nuns Fire: 46,104 acres – 10% contained
- Oakmont Fire: 550 acres – 10% contained
Southern LNU Complex
- Atlas Fire: 50,403 acres – 48% contained
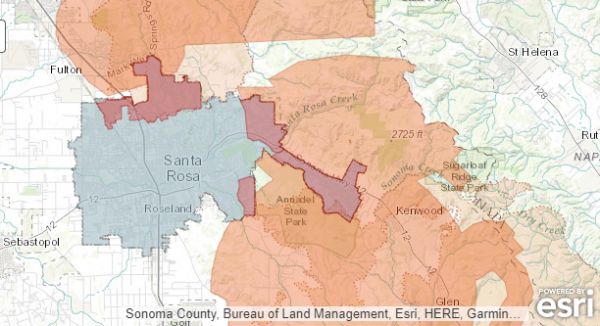
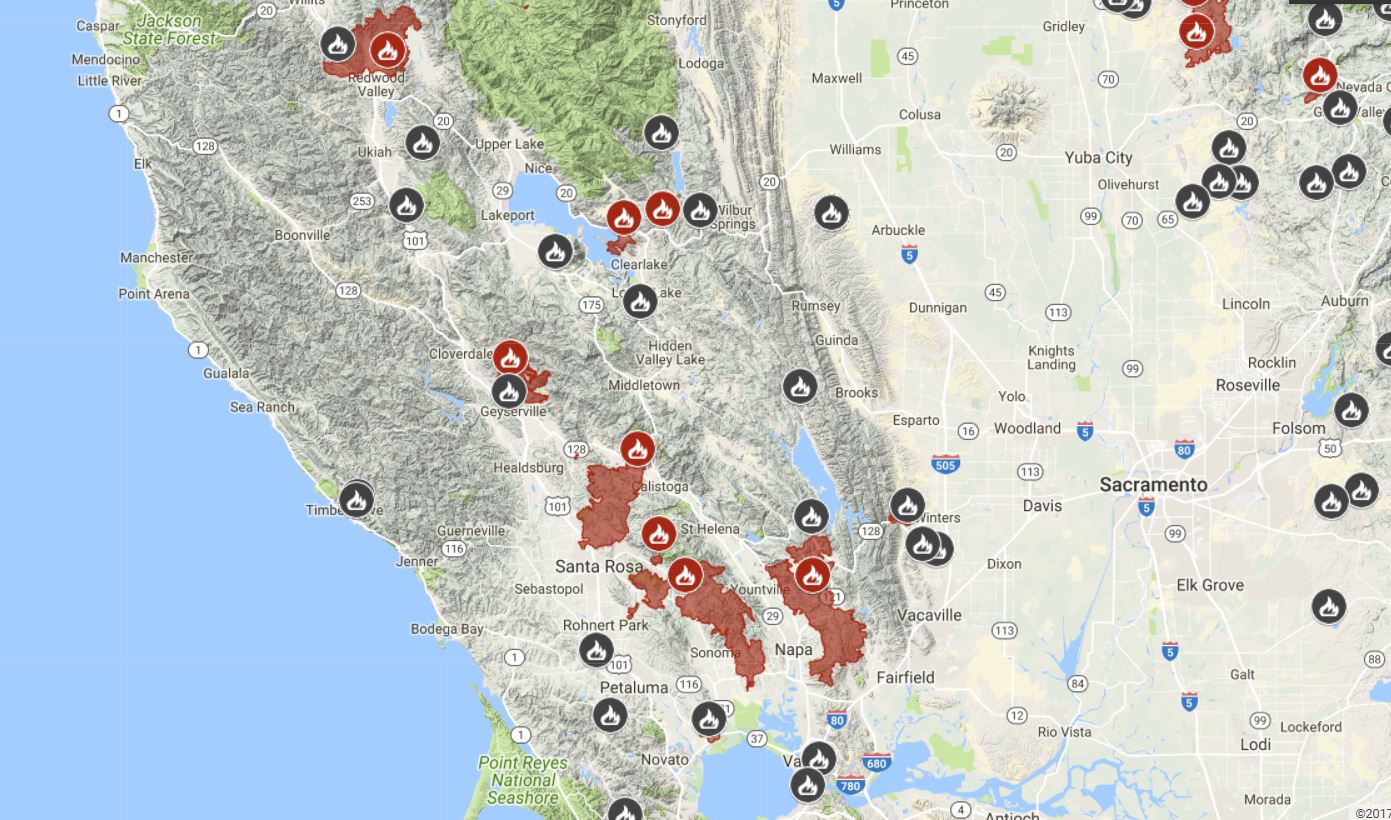
Santa Rosa area mandatory evacuations shown in red and orange. Full interactive map can be found here. Credit: Santa Rosa Fire Department.
Medocino-Lake Complex. A new wildfire developed in Medocino county where deadly wildfires continue to blaze, which prompted mandatory evacuations Saturday in the Spring Valley community on Saturday. Spring Valley remains under an evacuation advisory. Regardless, significant progress towards containment has been achieved with the Redwood Valley blaze and the Sulphur Fire.
Redwood/Potter Fires: 35,000 acres – 30% contained
Sulphur Fire: 2,207 – 70% contained
Long Fire: 100 acres – 25% contained
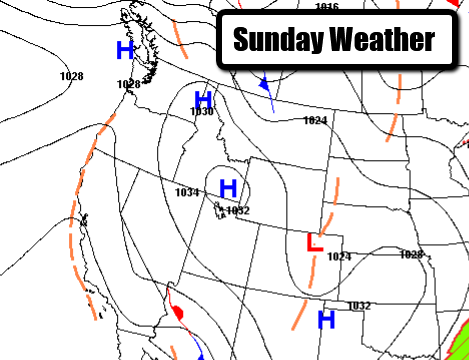
Weather Pattern Gradually Improves. There is some improvement with the wind expected on Sunday. Though off-shore flow continues, winds are not projected to be as strong after Sunday morning. However, very low humidity will continue, which will result in an ongoing fire weather concern. Temperatures will be a bit warmer today than on Saturday as a ridge of high pressure strengthens. It’s not until the middle of next week that a change in the weather pattern is noted. Tuesday and Wednesday a cooling trend will emerge as the high pressure shifts east, this will help drive back some on-shore flow. Humidity levels will rise and the marine layer will slowly replace the immensely dry air mass that has been dominating the Bay Area and Wine Country. This is welcome news for firefights, but again, this will be a gradual improvement. Note that Sunday will still be a difficult weather day for firefighters.
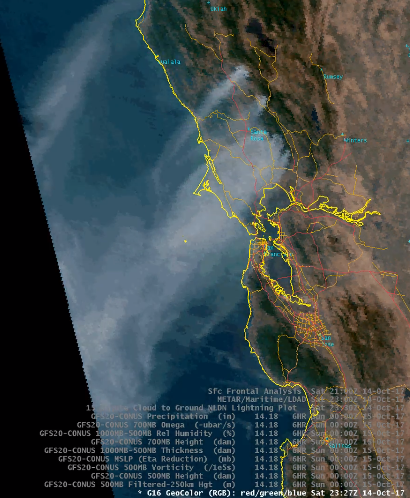
GOES-16 Satellite Saturday.

Poor Air Quality in the Bay Area. Despite a very slight improvement in air quality Saturday in the Bay Area, Sunday calls for more “unhealthy” air. The Air Quality Index is forecast to exceed 150, which is unhealthy for everyone, not just sensitive groups. Everyone’s health is impacted by the wildfire smoke draping the region.
-Meteorologist Susie Martin-
____________________________________________________________________
California Wildfire Update
A number of wildfires continue to burn in California, which have consumed more than 214,000 acres since Sunday, October 8th. Unfortunately, the death toll is up to 40, making it the deadliest week of wildfires in the states history. The fires have reportedly consumed nearly 6,000 structures and there are still hundreds of people still missing.
Cal Fire has updates on all of the fires HERE:
“Days after escaping the flames, Janice Mathis returned to her Northern California neighborhood for a bittersweet homecoming. Her three-bedroom, three-bath house sat in a heap of mangled metal, rocks and blackened trees. But as she wonders what next, she said she considered herself lucky to be alive.“I’m realizing you don’t put your boots on and your gloves on and go sift through stuff. There’s nothing to sift through,” Mathis told CNN affiliate KOVR.”The first thing we think of is we’re fortunate. “Mathis’ home in Napa is one of thousands reduced to smoldering ruins since the wildfires began October 8.”
(Image Credit: CNN)
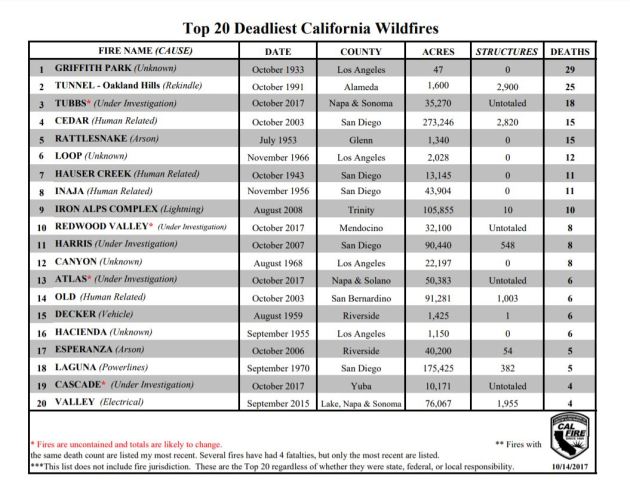
According to CAL Fire, some of the ongoing wildfires have sadly become some of the deadliest wildfires in the states history. Note the TUBBS Fire has reportedly killed 18, which is considered to the be 3rd most deadly fire in the states history.
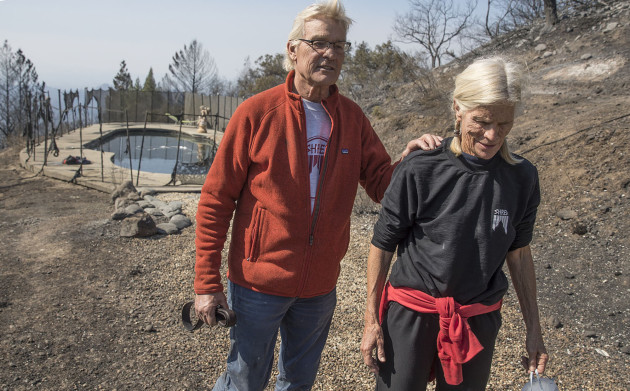
“They survived six hours in a pool as a wildfire burned their neighborhood to the ground”
“Jan Pascoe and her husband, John, were trapped. The world was on fire, and Jan was hyperventilating from fear. Then they remembered their neighbors’ pool. “You’ve got to calm down, Jan,” she told herself. “You can’t go underwater and hyperventilate.” At 12:40 a.m. Monday, Jan called 911. She reached a dispatcher. “We are going to get into the neighbors’ pool, should we do this?’ The dispatcher said, “Get anywhere safe.” “Please. We will be in the pool,” Jan replied. “This is where we are.” “In my naivete, all night long,” she would tell me later, “I thought someone would come to get us.” Jan, 65, and her husband, John, 70, debated when to get in. She wanted to right away, but John said, “Hold off. The water’s cold. Let’s see what happens.” As they stood at the edge of the pool, the neighbors’ house caught fire. A big tree next to the pool went up in flames. The railroad ties framing the concrete steps leading to the pool ignited. “The heat was ‘whoa,’” John said. He stripped off his pants and jacket, and wearing only a T-shirt, turned to Jan and said, “Jump in now.””
(John and Jan Pascoe survived the firestorm Monday morning by running out of their home and into their neighbors swimming pool in Santa Rosa. Brian van der Brug / Los Angeles Times)
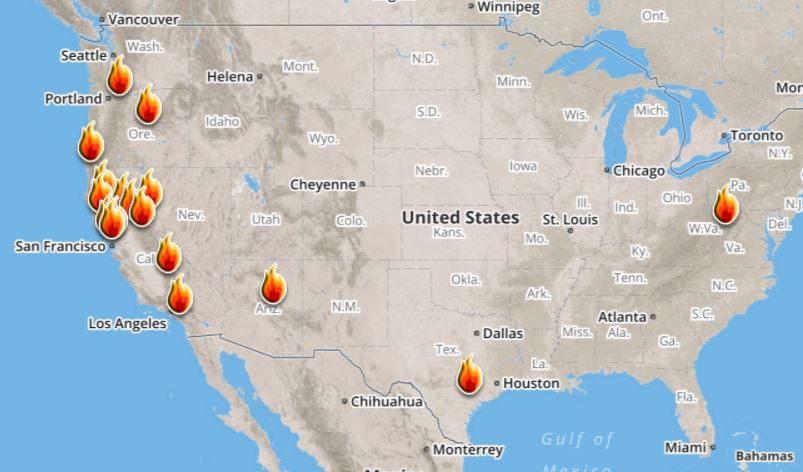
Ongoing Large Wildfires
Here’s a look at the current wildfire map across the country. While several fires are still ongoing, recent cool and somewhat wet weather has been helping curb the wildfire threat, especially in the Western US.
Here’s a list of all the current large wildfires from Inciweb:
Tracking OPHELIA
OPHELIA has been a pretty impressive storm way out in the northeastern part of the Atlantic. According to NOAA’s NHC, OPHELIA was a category 3 hurricane with sustained winds of 115mph on Saturday morning. By Sunday afternoon it was down to a category 1 hurricane with 90mph sustained winds.
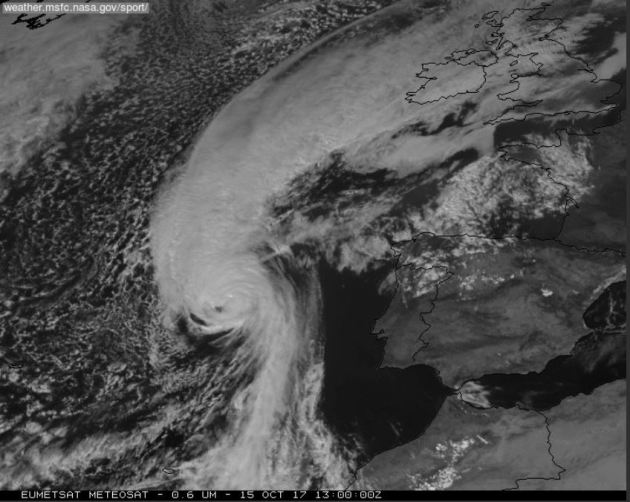
Impressive OPHELIA
According to Brenden Moses @Cyclonebiskit – who is a hurricane researcher & undergrad at NOAA’s NHC – “OPHELIA has shattered the record for the northeastern-most forming Cat 3 in the Atlantic and is the easternmost overall.” WOW! Pretty impressive, huh?
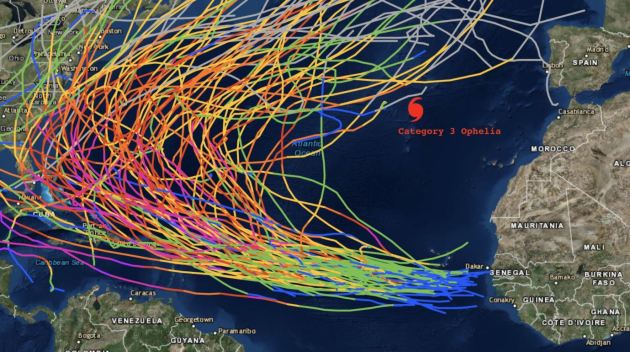
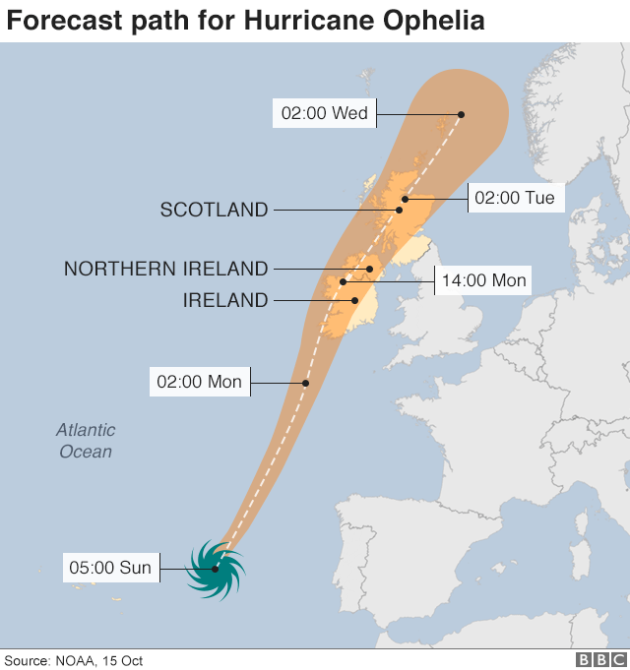
Tracking OPHELIA
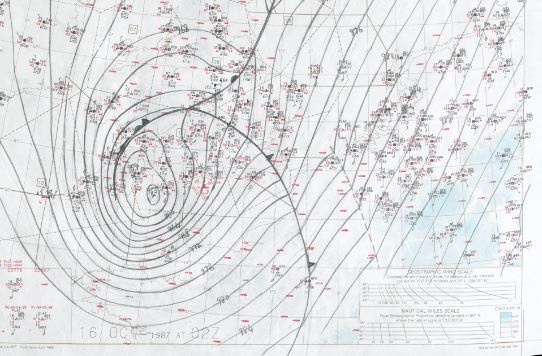
Here’s the official track for OPHELIA, which looks like it could continue hurricane status into early next week. Note that this storm will likely impact a direct hit with Ireland and eventually move over Scotland with very strong winds early next week as well!

“Fresh warnings as powerful storm heads to UK”
“The Met Office has issued Northern Ireland with an amber weather warning as Hurricane Ophelia continues across the Atlantic towards the British Isles. The warning of “potential danger to life” came as the Republic of Ireland called a national emergency meeting. Ophelia, on its way from the Azores in the Atlantic Ocean, is currently blowing winds of 90mph (145km/h). The hurricane will be a storm when it hits the UK, exactly 30 years after the Great Storm of 1987 killed 18 people. It has been downgraded to a category one hurricane by the US National Hurricane Center and is forecast to continue gradually weakening. The weather system is expected to bring severe winds and stormy conditions to parts of Ireland and the UK, with winds of up to 70mph (113km/h).”
Atlantic Outlook Next 5 Days
.png)
___________________________________________________________
It certainly has been a fairly active first half of 2017 with 1,433 preliminary tornado reports through October 6th. Note that this is the most tornadoes through that date since 2011, when there were 1,815 reports. The map below shows the distribution of the tornadoes so far this year.
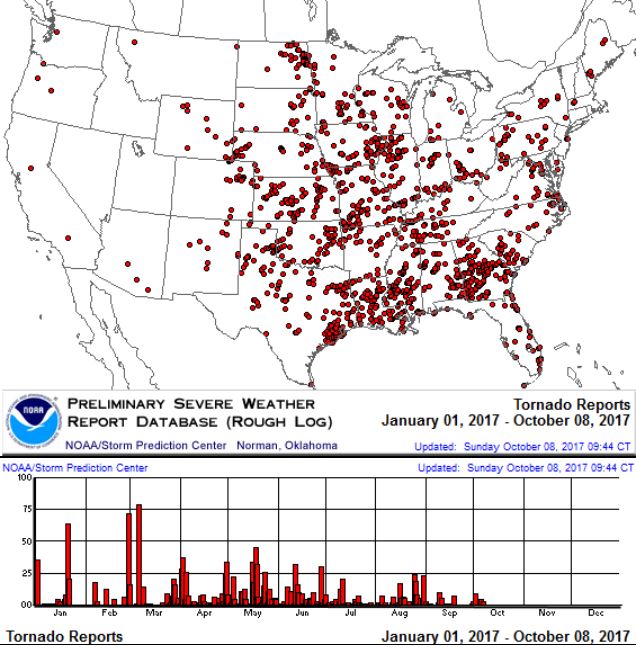
PRELIMINARY 2017 Tornado Count
According to NOAA’s SPC, the PRELIMINARY 2017 tornado count is 1,433 (through October 14th). Note that is the most active year for tornadoes since 2011, when there were 1,815 tornadoes. Keep in mind there was a major tornado outbreak in the Gulf Coast region from April 25-28, 2011 that spawned nearly 500 tornadoes, some of which were deadly. That outbreak is known as the Super Outbreak of 2011 and has gone down in history as one of the biggest, costliest and one of the deadliest tornado outbreaks in history.
.png)
_____________________________________________________________________
National Weather Hazards Ahead…
1.) High winds for coastal sections of Washington and Oregon, Wed-Thu, Oct 18-19.
2.) Heavy rain for the coastal Pacific Northwest and northern California, Tue-Fri, Oct 17-20.
3.) Heavy snow for the higher elevations of the Cascades, Wed-Fri, Oct 18-20.
4.) Heavy snow for parts of the Northern Rockies, Bitterroots, and Columbia Plateau Thu-Fri, Oct 19-20.
5.) Heavy rain for parts of western Washington and western Oregon, Sat-Sun, Oct 21-22.
6.) Heavy snow for parts of the Cascades, Bitterroots, Columbia Plateau, and Northern Rockies, Sat-Sun, Oct 21-22.
7.) Flooding occurring along the St. Johns and Withlacoochee Rivers across central Florida.
Flooding possible for part of southern Texas.
8.) Severe drought across parts of the northern Rockies, northern and central Great Plains, Midwest, and Hawaii.
.png)
_________________________________________________________
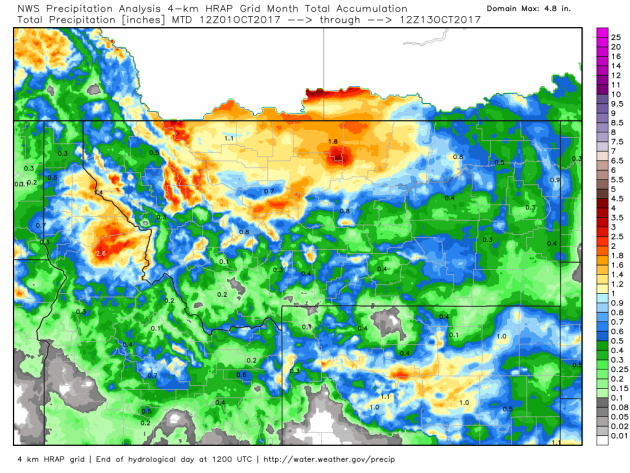
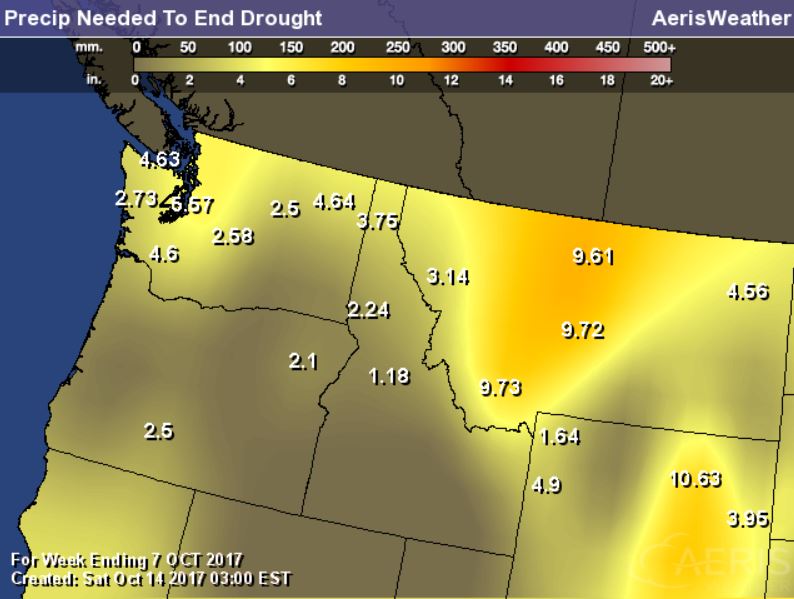
October Moisture in Montana
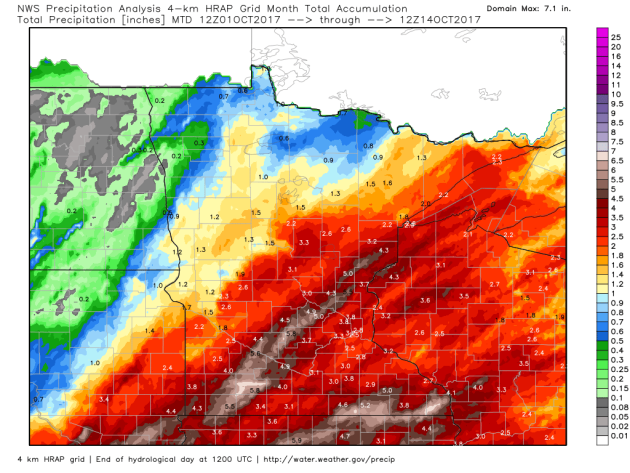
Thanks to a number of storm system, parts of Montana continue to pick up much needed moisture. Here’s a look at the estimated precipitation since the beginning of October, which suggests some 1″ to near 2″ tallies for some! While it’s not drought busting rain, it is drought denting… keep it coming!
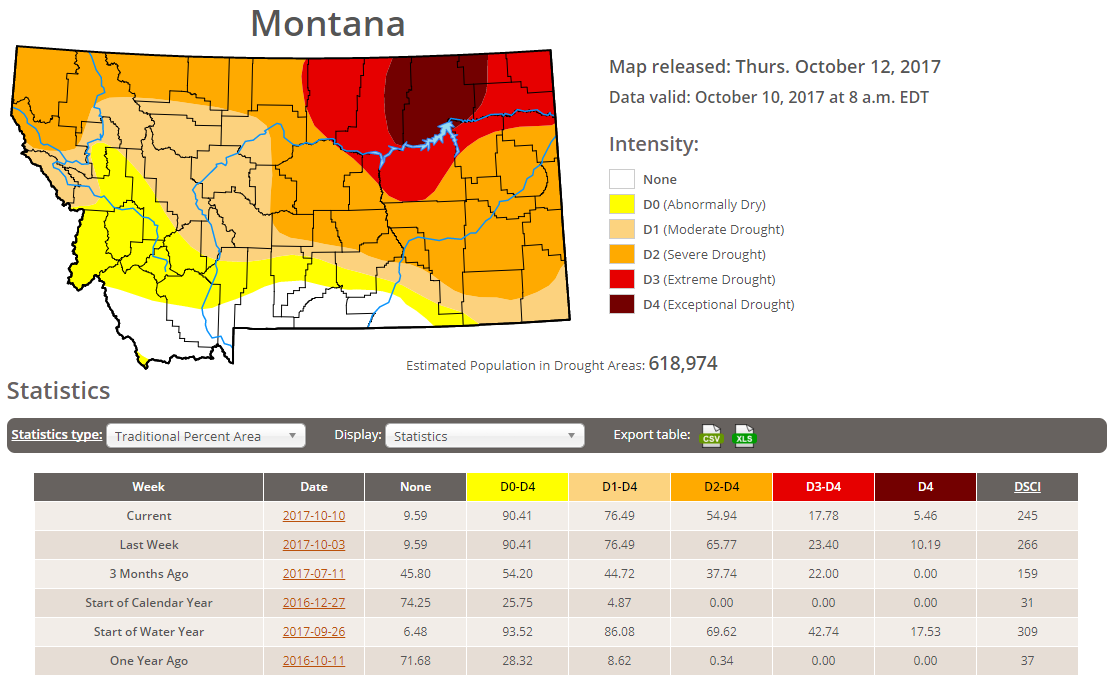
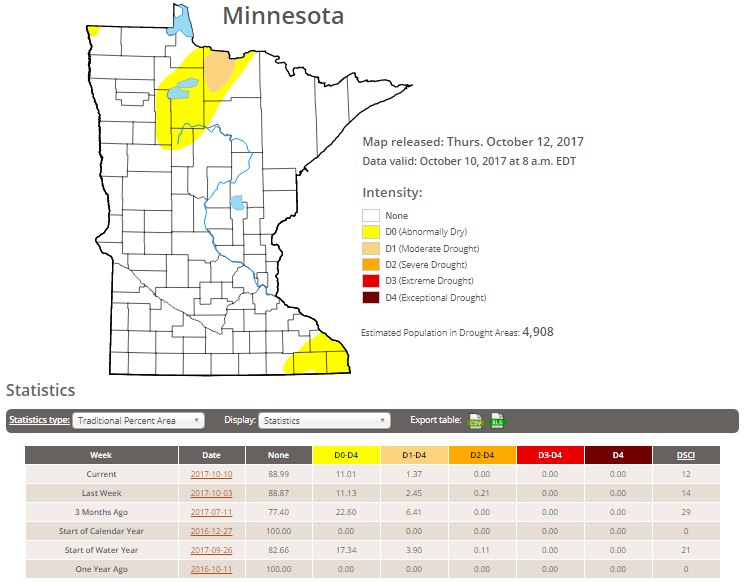
Latest Drought Monitor
Here’s the latest drought update from the US Drought Monitor, which shows EXCEPTIONAL drought conditions continuing across parts of Montana. Note that nearly 90% of the state is considered to be abnormally dry, but the EXCEPTIONAL drought covers nearly 5% of the state, which is down from nearly 10% from last week. We’re also seeing some improvement in the EXTREME drought, which is nearly 18% this week, down from near 23% last week.
 ____________________________________________________________________
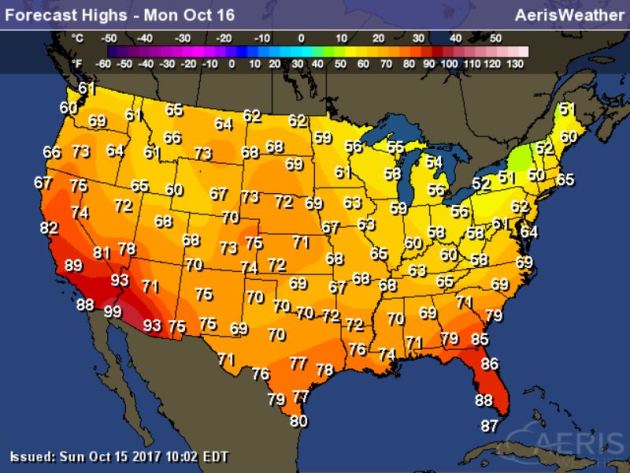
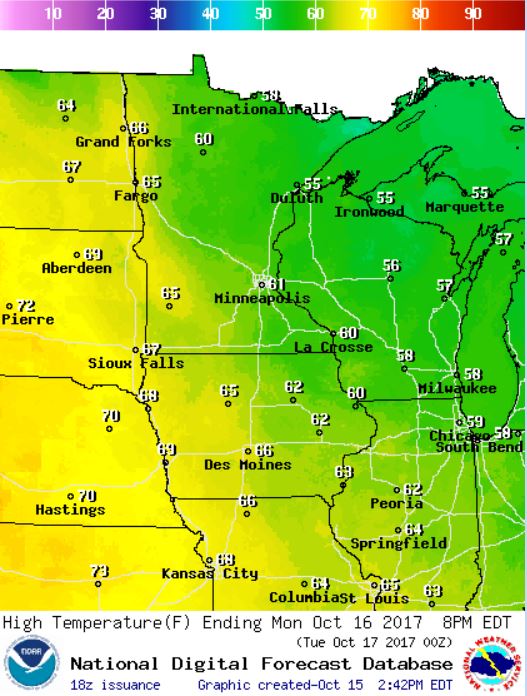
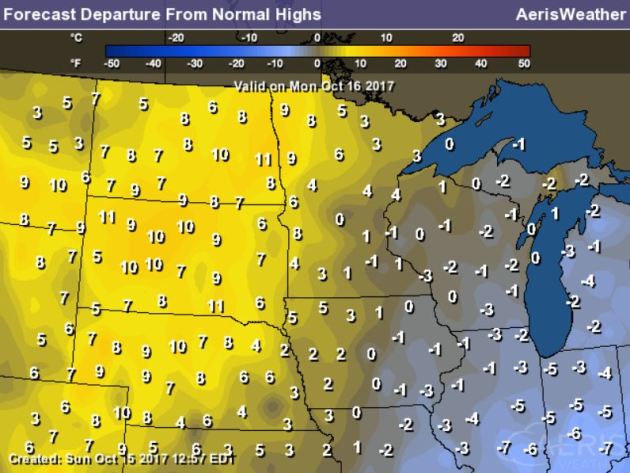
High Temps Monday
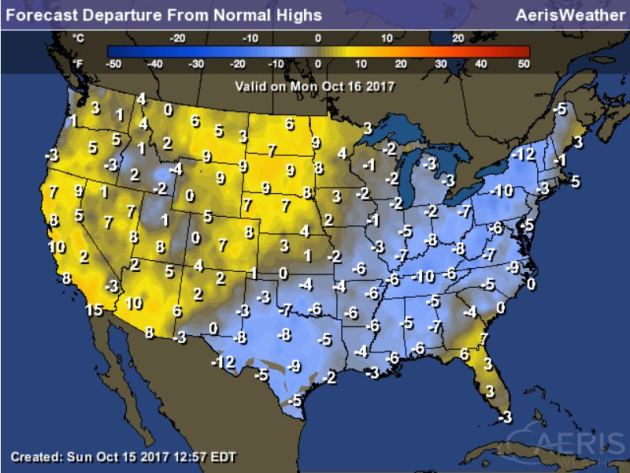
Here’s a look at high temperatures across the nation on Monday, which suggests that temperatures from the Northeast to Southern Plains will be nearly 5F to 15F below average in the wake of a cold front. Temperatures from the Midwest to the Western US will be anywhere from 5F to 15F above average.
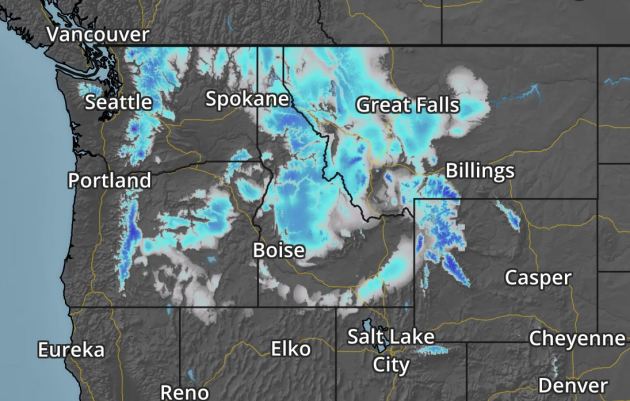
Here’s the weather outlook through the early part of next week, which shows a cold front moving across the East Coast with areas of heavy rain and perhaps a few isolated strong storms across the Southeast. Note that after that front blows through, much of the nation looks to remain quite dry and quiet with the exception of the Pacific Northwest as another storm system looks to move in early next week.
.gif)
According to NOAA’s WPC, areas of heavy rain will continue across parts of the Eastern US on Monday with some near 1″ tallies. Also note that some locations across Florida could see 1″ to near 2″ tallies as well. The heaviest precipitation over the next 5 day look to be found in the Pacific Northwest, where several inches of liquid could fall across the high elevations there. The good news is that there appears to be some much needed precipitation across northern California, where wildfires continue.
.gif)
.gif)
.png)
By Paul Douglas
WEDNESDAY: Partly sunny. Turning breezy. Winds: NW 10-20. Wake-up: 52. High: 70
THURSDAY: Sunny and Pleasant. Winds: S 7-12. Wake-up: 43. High: 67.
FRIDAY: Sunny with a lukewarm breeze. Winds: S 10-20. Wake-up: 54. High: 72.
_______________________________________________________
This Day in Weather History
October 16th
1996: Early evening storms produce 3/4 to 1 3/4 inch hail in Nicollet, Dakota, Brown, Watonwan, and Martin Counties. In Scott County near St. Patrick, hail fell intermittently for an hour and the area received 3 1/2 inches of rainfall. In Watonwan County, wind gusts up to 63 mph moved several garages off their foundations, destroyed a cattle shed and a corn crib, and uprooted and toppled trees. Southwest of Lake Crystal in Blue Earth County, a garage was blown over onto a vehicle. A 250 gallon fuel tank was also blown over.
1937: A snowstorm dumps 10 inches at Bird Island.
1880: An early blizzard occurs in Minnesota. The blizzard struck western Minnesota and the eastern Dakotas especially hard. Over a foot of snow fell in western counties. Railroads were blocked, and damage was done to Great Lakes shipping.
________________________________________________________
Average High/Low for Minneapolis
October 16th
Average High: 58F (Record: 86F set in 1938)
Average Low: 40F (Record: 23F set in 1952)
Record Rainfall: 2.10″ set in 1984
Record Snowfall: 0.5″ set in 1992
_________________________________________________________
Sunrise/Sunset Times for Minneapolis
October 16th
Sunrise: 7:30am
Sunset: 6:26pm
Hours of Daylight: ~10 hours 55 mins
Daylight LOST since yesterday: ~3 minutes and 1 seconds
Daylight LOST since summer solstice (June 20th): 4 hours & 42 minutes
__________________________________________________________
Moon Phase for October 16th at Midnight
2.5 Days Before New Moon

_________________________
Highs on Monday will be a little closer to average across much of the state. Some spots in the Arrowhead will be stuck in the upper 40s and lower 50s, but some across western MN will warm into the mid 60s, which will be a good 5F to near 10F above average.
Here’s the temperature outlook through October 30th, which shows very mild temps moving in through the 3rd full week of October. Temps could warm into the 60s and 70s, which 10F to almost 15F above average! Enjoy it because the extended forecast suggests MUCH cooler temperatures potential moving in by the end of the month. Stay tuned.
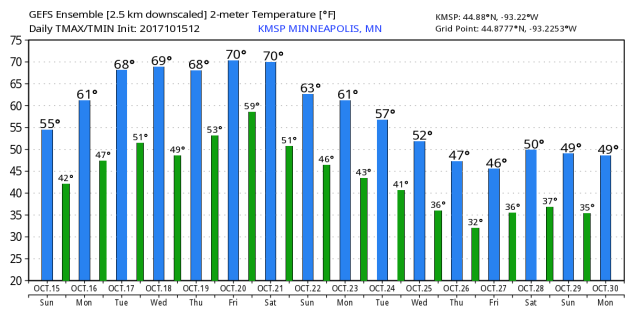
Minnesota Drought
According to the US Drought Monitor, much of the state is drought free, but nearly 11% of the state is considered to be abnormally dry with 1.3% in a Moderate drought, which is down from nearly 2.5% last week.
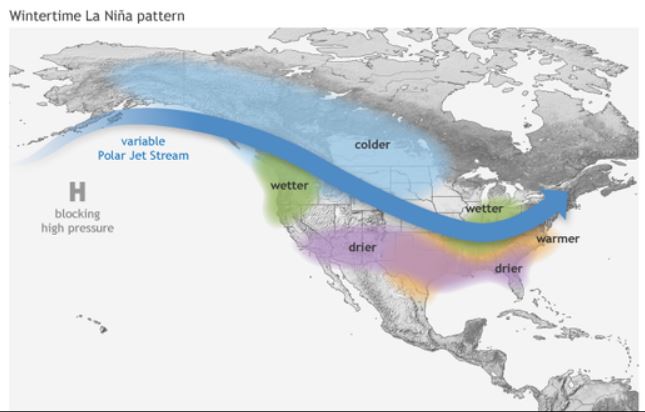
“La Niña, the cooler sibling of El Niño, is likely to form over the next few months, federal government forecasters said Thursday. Specifically, there’s a 55 to 65% chance that a La Niña will develop during the fall and winter of 2017-18, the Climate Prediction Center said. The La Niña climate pattern — a natural cycle marked by cooler-than-average ocean water in the central Pacific Ocean — is one of the main drivers of weather in the U.S. and around the world, especially during the late fall, winter and early spring. A typical La Niña winter in the U.S. brings cold and snow to the Northwest and unusually dry conditions to most of the southern tier of the U.S., according to the prediction center. The Southeast and Mid-Atlantic also tend to see warmer-than-average temperatures during a La Niña winter. However, the Upper Midwest into New York and New England tend to see colder-than-average temperatures, the Weather Channel said. Globally, La Niña often brings heavy rainfall to Indonesia, the Philippines, northern Australia and southern Africa.”
_____________________________________________________________________
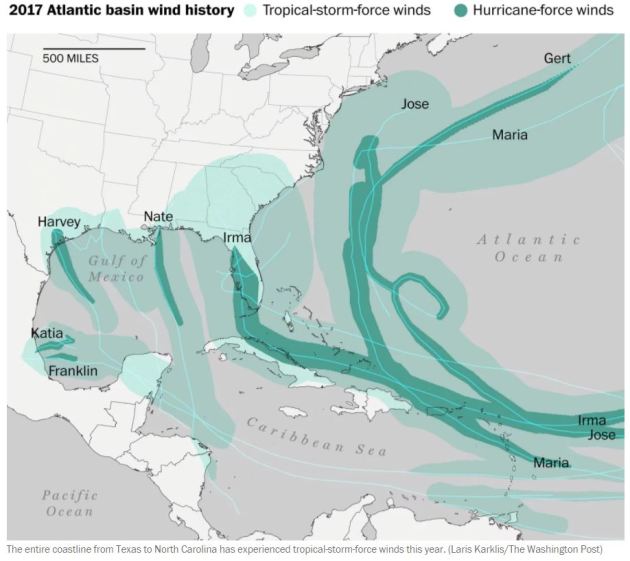
“The extreme 2017 hurricane season adds another remarkable record to its long list”
“Hurricane season still has 48 days left but it’s already one of the most terrible on record, which will be remembered for generations. Like other famous seasons — 1995, 2004 and 2005 to name a few — 2017 has had many storms and many significant landfalls. Impressive records keeping falling this year, the latest occurring this week when Ophelia became a hurricane in the eastern Atlantic. From Franklin to Ophelia, ten hurricanes have developed in the last 10 weeks, consecutively, tying a record for most hurricanes in a row. The last time this happened was way back in 1893. In an average season, we would typically have seen only five hurricanes by Oct. 13, along with five additional named storms of lesser intensity. This year — far from average — there have been 15 named storms from Arlene in April to Ophelia in early October.”
See more from WashingtonPost HERE:
__________________________________________________________________
______________________________________________________________________
________________________________________________________________
“While the ‘Great Storm’ of 15 and 16 October 1987 is still one of the most talked about weather events in living memory it was also a wake-up call for the Met Office and other organisations. It helped identify gaps in severe weather forecasting capability and highlighted the need for better communication with partner organisations such as emergency services and the public in general. Bringing wind gusts in excess of 100 mph the storm resulted in the loss of 22 lives, around £1 billion worth of damage and there was widespread disruption across southern England. It has gone down in history as one of the worst UK storms since 1703 and will obviously be remembered for Michael Fish’s now famous television broadcast. Over the last 30 years there have been many major developments and changes in the way weather forecasts are produced. There have also been changes in how they are communicated and therefore in how people respond.”
See more from MetOffice.gov HERE:
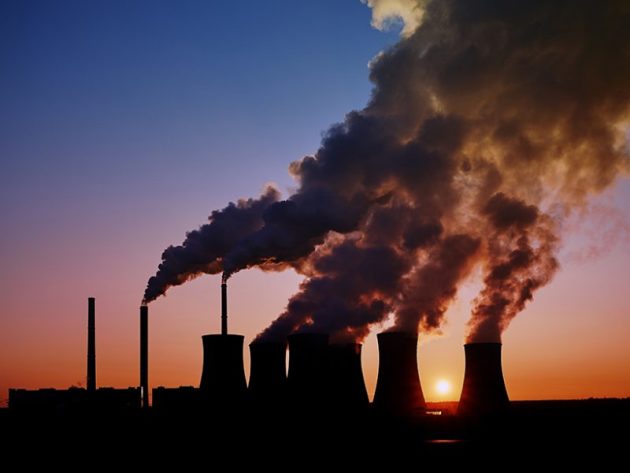
___________________________________________________________________“Satellite Quantifies Carbon Dioxide from Coal-Fired Power Plants”
“Using data from NASA’s Orbiting Carbon Observatory 2 satellite, researchers measured emissions of the greenhouse gas from individual coal plants in the United States, India, and South Africa. Despite the increasing popularity of renewable energies like wind and solar power, countries around the world continue to build power plants fueled by coal. Now, researchers have analyzed satellite observations of plants in three countries to test whether the space-based measurements can accurately reveal how much carbon dioxide (CO2) such plants emit. The scientists found that their measurements were consistent to within 17% of reported values, although the satellite they used was not designed for this sort of reconnaissance. NASA built the satellite, called the Orbiting Carbon Observatory 2 (OCO-2), to quantify naturally occurring CO2over large spatial scales, said Ray Nassar, an atmospheric scientist at Environment and Climate Change Canada in Toronto and leader of the team that analyzed the data.”
See more from Earth & Space Science News HERE:
(Credit: kamilpetran/iStock/Getty Images Plus Via Earth & Space Science News)
______________________________________________________________________“This Surprising Sea Creature Is Causing Climate Change”
“Clams and worms at the bottom of the ocean may be releasing “ridiculous amounts of greenhouse gases” that contribute to climate change, according to a new study. Researchers behind the study, published in the journal Scientific Reports, found that 10% of the methane emissions from the Baltic Sea come from clams and worms. That’s roughly equivalent to 20,000 cows. Methane is one of the most potent greenhouse gases, roughly 30 times more effective at trapping heat in the atmosphere than carbon dioxide. The study evaluated the Baltic Sea specifically, but if that effect also occurs the globe the impact of ocean clams and worms to global warming would be significant. Study co-author Stefano Bonaglia of Stockholm University said the “small animals in the seafloor may act like cows in a stable.””
(Image Credit: NOAA)

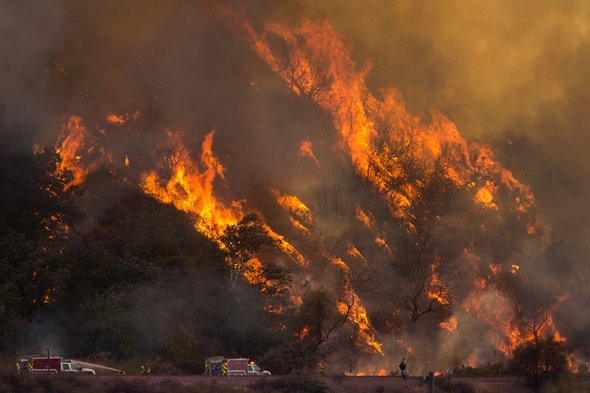
_____________________________________________________________________“Here’s What We Know about Wildfires and Climate Change”
“Scientists think that global warming may already be influencing fire seasons. As deadly wildfires rage across California’s wine country, leaving at least 29 dead and a trail of destruction in their wake, the influence of climate change is again being questioned. Just Monday, Hillary Clinton delivered a speech at the University of California, Davis, in which she noted that “it’s been a tough couple of weeks with hurricanes and earthquakes and now these terrible fires” (Climatewire, Oct. 12). “So in addition to expressing our sympathy, we need to really come together to try to work to prevent and mitigate, and that starts with acknowledging climate change and the role that it plays in exacerbating such events,” she added.”
See more from Scientific American HERE:
(Credit: David McNew Getty Images Via Scientific American)
______________________________________________________________________
Thanks for checking in and don’t forget to follow me on Twitter @TNelsonWX