40 F. high in the Twin Cities on Thanksgiving.
35 F. average high on November 26.
26 F. high on November 26, 2014.
1.3″ snow fell at MSP International Airport yesterday.
November 27, 2005: In the early morning a home in Mower County is hit by lightning and burned to the ground, but no one is injured.
November 27, 1994: A low pressure system produces the first winter storm of the season for Minnesota. By the early morning hours of the 28th, a swath of snow in excess of 6 inches had blanketed much of southwest through central into northeast Minnesota. Snowfall of 6 inches or more occurred south of a line from Gunflint Lake in Cook County to near Ortonville in Big Stone County, and along and north of a line from near Blue Earth in Faribault County to Red Wing in Goodhue County. The snow closed the Minneapolis-St. Paul International Airport for a short time on the 27th, and contributed to hundreds of accidents and at least three fatalities. In addition, the build-up of ice and snow in combination with strong winds resulted in numerous downed power lines in southeast Minnesota.
November 27, 1985: Extreme cold hits northern Minnesota. A low of 30 below zero is reported at Crookston.
November 27, 1971: Heavy snow falls in southwest Minnesota, with Redwood Falls receiving a foot.
“Pacific Vortex”: A Year Without a (real) Winter?
Yesterday’s candy-coating of snow may have been an omen of the winter to come. It would be premature to write off big snowstorms or polar blasts, but I’m seeing cues in the weather that lead me to believe this may be a typical winter – for Topeka, Kansas.
November in the Twin Cities is 9.1 F warmer than average, to date. Dr. Mark Seeley predicts this may be one of the 3 warmest Novembers ever recorded.
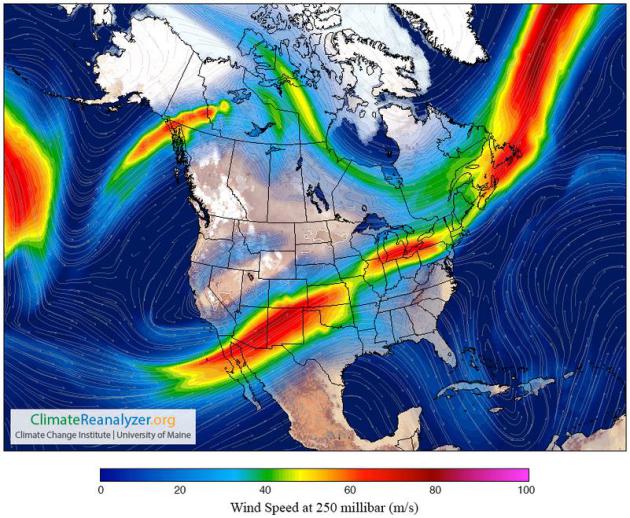
Thank (or blame) El Nino. Record warmth bubbling out of the Pacific Ocean spawned a Category 4 hurricane off the west coast of Mexico on Thanksgiving Day; the latest ever recorded. A balmy westerly wind howling from the Pacific is overwhelming cold fronts oozing across Siberia into Canada. The coldest air is bottled up to our north, while the main storm track whisks sloppy storms south of Minnesota.
Expect chilled sunshine today and Saturday; temperatures a few degrees below average for a change. An inch or two of slush is possible Tuesday before the next warming trend. No 60s or 70s – but models hint at a few 40s by mid-December.
A pioneer winter this year? I don’t think so.
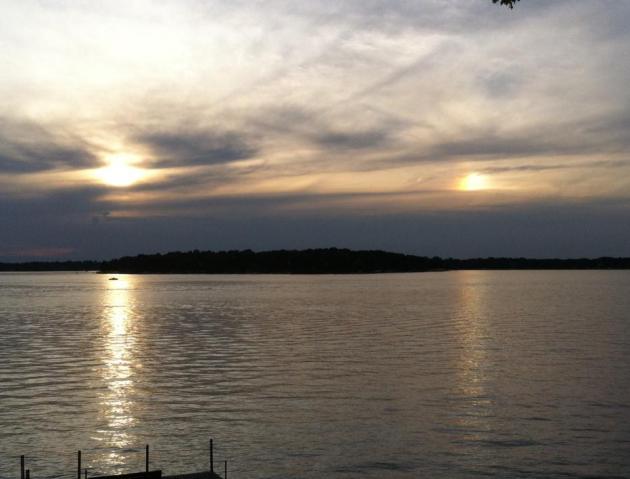
* Image credit above: Climate Reanalyzer.
Accumulating Snow Monday-Tuesday? It’s still early, but NOAA’s GFS model brings a smear of accumulating snow back into Minnesota by Tuesday of next week, hinting at a potentially plowable accumulation, especially for far southern Minnesota. Stating the obvious: we’re due. Source: AerisWeather.
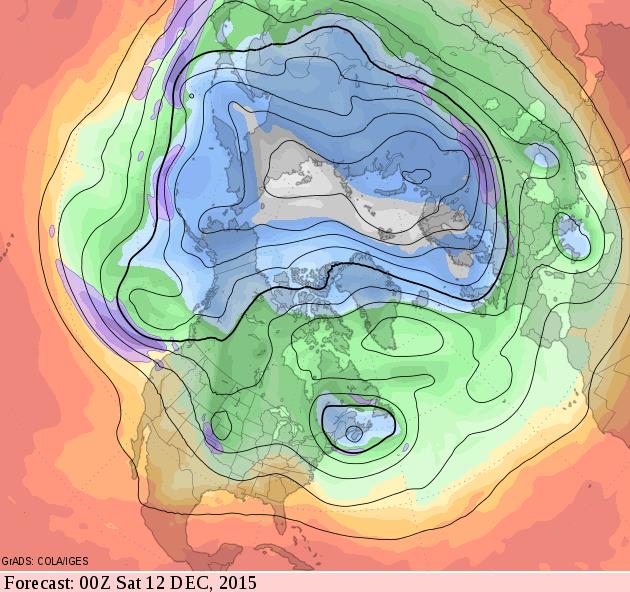
Mild Bias Spills into mid-December. Check out predicted (GFS) 500 mb winds the evening of December 11, still primarily zonal across the USA, no frigid air showing up across most of North America. This looks like something out of mid-October.
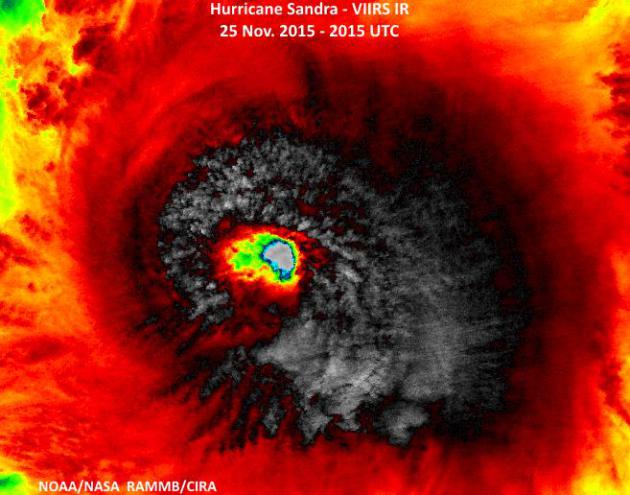
An Unprecedented Thanksgiving Visitor: A Category 4 Hurricane. Check out another “first” (at least in recorded history) – another symptom of an abnormally warm Pacific Ocean, courtesy of Weather Underground: “Remarkable Hurricane Sandra exploded into a Category 4 storm with 145 mph winds overnight, making it the latest major hurricane ever observed in the Western Hemisphere (November 26.) The previous record was held by an unnamed Atlantic hurricane in 1934 that held on to Category 3 status until 00 UTC November 24. Sandra is also now the latest Category 4 storm ever observed in either the Eastern Pacific (previous record: Hurricane Kenneth on November 22, 2011) or the Atlantic (previous record: “Wrong Way” Lenny on November 18, 1999.) Prior to Sandra, the strongest East Pacific hurricane so late in the year was 1983’s Winnie, which topped out on December 6 at 90 mph winds. Sandra is the first major hurricane in the Western Hemisphere that has ever been observed on Thanksgiving Day…”
Image credit above: “VIIRS infrared satellite image of Hurricane Sandra taken at 3:15 pm EST November 25, 2015. At the time, Sandra was a Category 3 storm with 115 mph winds.” Image credit: Dan Lindsey, NOAA/CIRA.
One of the 3 Warmest Novembers in Recorded Minnesota History? That’s according to climate guru Mark Seeley; here’s an excerpt from this week’s edition of Minnesota WeatherTalk: “Through the first 25 days of November temperatures have been averaging well above normal. It is likely that this month will conclude in a manner that will rank it among the top three warmest Novembers in Minnesota history, likely falling short of the warmest ever which occurred in 2001. Over 40 communities reported at least one day this month with an afternoon temperature of 70°F or higher. In all 33 new daily maximum temperature records were set within the National Weather Service Cooperative Observer Network in Minnesota, and 145 daily warm minimum temperature records were set, a remarkably large number. No low temperature records were set anywhere in the state this month...”
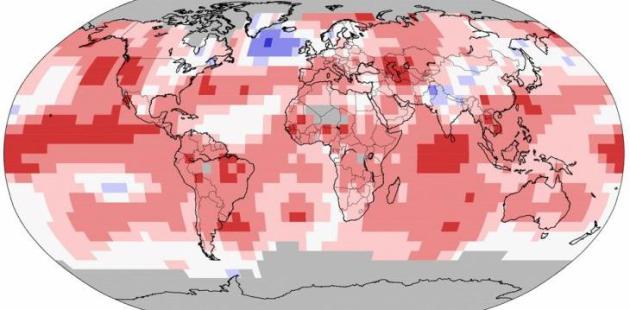
2015: Hottest Year Worldwide Since Records Started in 1880. Unless another “polar vortex” sets up in the coming weeks (unlikely) 2015 will be even warmer than the previous record: 2014. 14 of the 15 warmest years, worldwide, have occurred since 2000. Here’s an excerpt from US News: “…Scientists at the U.S. National Oceanic and Atmospheric Administration and elsewhere already were saying that 2015 likely would be the hottest. The U.N. agency, NOAA, NASA and Japan’s weather agency all say 2014 is the current record hot year with a global temperature of 14.57 degrees Celsius, 58.23 degrees F. “I would call it certain,” NOAA’s chief climate monitor, Deke Arndt, said on Tuesday. “Something game-changing massive would have to happen for it not to be a record.” Records go back to 1880. Jarraud also said it is likely that the world has now warmed by 1 degree Celsius, or 1.8 degrees Fahrenheit, over pre-industrial times. That’s a symbolic milestone: International leaders have set a goal of keeping global warming within 2 degrees C, 3.6 F, of pre-industrial times...”
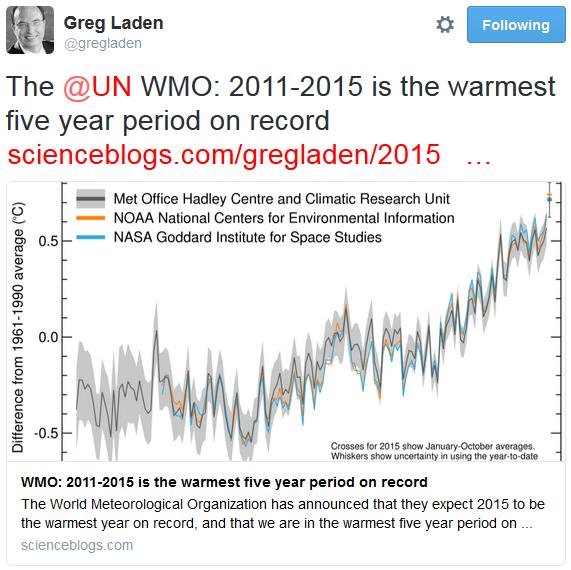
World Meteorological Organization: 2015 Like to be Warmest on Record; 2011-2015 Warmest Five-Year Period. Here’s an excerpt from a WMO press release: “The global average surface temperature in 2015 is likely to be the warmest on record and to reach the symbolic and significant milestone of 1° Celsius above the pre-industrial era. This is due to a combination of a strong El Niño and human-induced global warming, according to the World Meteorological Organization (WMO). The years 2011-2015 have been the warmest five-year period on record, with many extreme weather events – especially heatwaves – influenced by climate change, according to a WMO five-year analysis...”
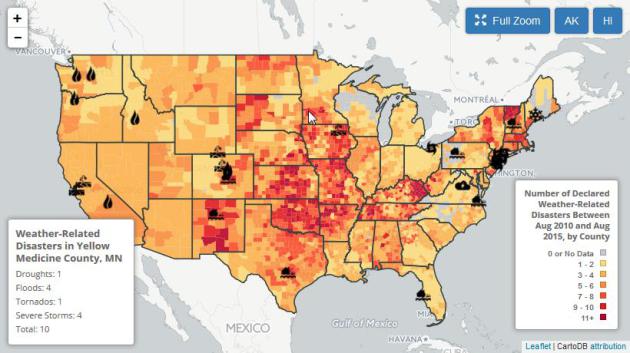
Unprecedented. 96% of American Counties Have Recently Seen a Weather Extreme. Here’s an excerpt from Environment America and Climate Denial Crock of the Week: “One reason that polls have been swinging away from climate denial and toward the need for action on climate, is that more and more Americans have witnessed first hand an event that they find far enough out of the ordinary so as to be convincing. Environment America: Ninety-six percent of Americans live in a county hit by at least one weather-related disaster in the last five years, according to a new interactive map using federal government data. Scientists say global warming is already exacerbating some extreme weather events and their impacts…”
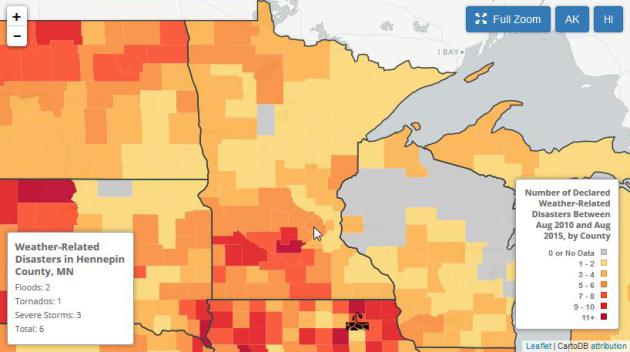
Drilling Down: Weather-Related Weather Disasters in Minnesota. Hennepin County has experienced 6 weather-related disasters since August, 2010, while Sibley County has experienced 11. Check out the interactive map from Environment America.
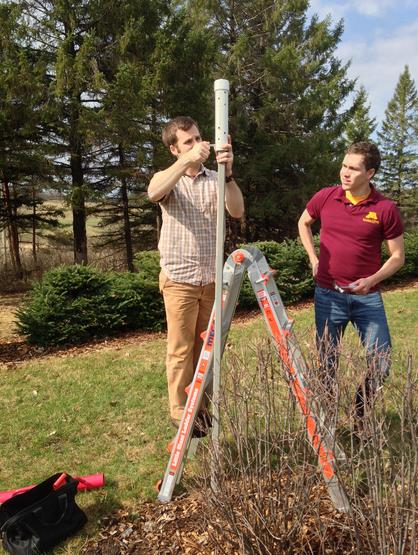
New Urban Heat Island Study Shows Surprising Variation in Air Temperatures Across Twin Cities. Which brings up a quandary: how do meteorologists factor in urban heating into their forecasts? Here’s an excerpt of a recent press release from The University of Minnesota: “Some parts of the Twin Cities can spike temperatures up to 9°F higher than surrounding communities thanks to the “urban heat island” effect, according to a new study from the University of Minnesota. The study, which was funded by the Institute on the Environment and published in the Journal of Applied Meteorology and Climatology, used a network of 180 sensors deployed throughout the Twin Cities metropolitan area in residential backyards and city parks to paint the most detailed picture anywhere in the world of how temperature varies with time and place across pavement-filled metropolitan areas and surrounding communities…”
Image credit above: “Brian Smoliak and research fellow Phil Mykleby install a temperature sensor at the Minnesota Landscape Arboretum.” Photo Credit: Angeline Pendergrass
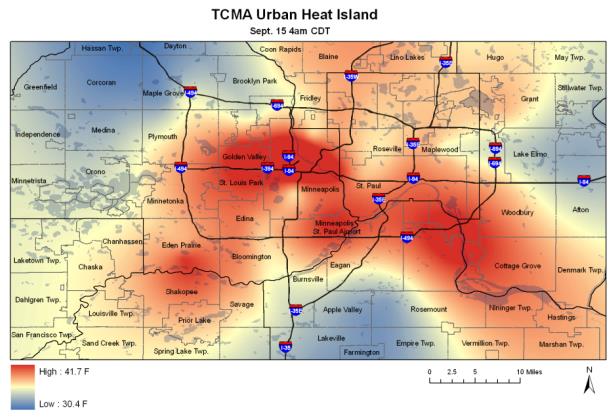
New Urban Heat Island Study Shows Surprising Variations in Air Temperatures Across the Twin Cities. Meteorologists have been tracking this effect for a long time, and in certain cases it can make the difference between rain, slush or snow. Here’s a clip from ScienceDaily: “…Recording surface air temperatures every 15 minutes from August 2011 through August 2014 across nearly 2,000 square miles and using U.S. Geological Survey data to fine-tune differences at the neighborhood level, the study uncovered several surprises. Among them: Temperatures in the urban core of Minneapolis, St. Paul and Bloomington average 2 °F higher in summer than in surrounding areas The differential spiked as much as 9 °F higher during a heat wave in July 2012 Urban heat island effect is stronger at night in summer and during the day in winter…” (Image credit: Star Tribune).
10 Things Everyone Should Know About Seasonal Affective Disorder. “SAD” is very real for many people; the dark days of winter can take a mental and physical toll. Here’s a snippet of a helpful article at Huffington Post: “…In most cases, SAD is just a seasonal component of clinical depression or bipolar disorder, according to Michelle Riba, a professor of psychiatry and the associate director of the University of Michigan Depression Center. “For people who see a regular pattern every year of getting sad, anxious or a cycling of moods, the first thing they need to do is to see someone to get an overall diagnosis,” she said. “They need to treat the underlying depression…”
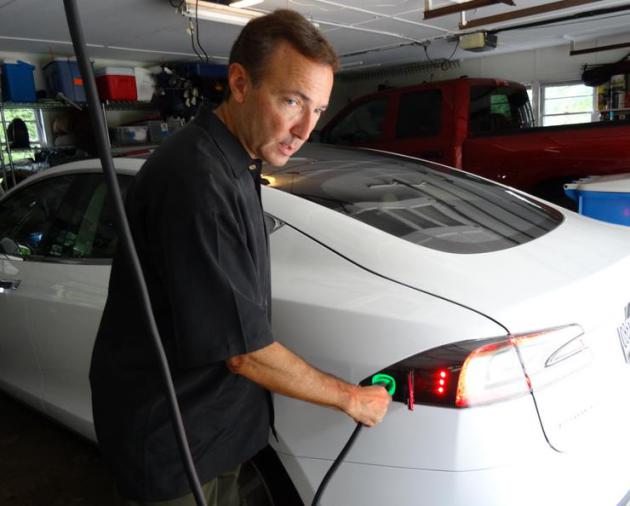
A Car Dealers Won’t Sell: It’s Electric. The reasons many car dealers aren’t more enthusiastic? Hard to say, but when in doubt follow the money. And yes, that’s a RAM 1500 truck in my garage (which I love). The day Dodge, Ford or Tesla makes an all-electric pick-up truck with a 300-500 mile range I’ll be one of the first to put down a deposit. Here’s an excerpt from an article at The New York Times: “…Industry insiders and those who follow the business closely say that dealers may also be worrying about their bottom lines. They assert that electric vehicles do not offer dealers the same profits as gas-powered cars. They take more time to sell because of the explaining required, which hurts overall sales and commissions. Electric vehicles also may require less maintenance, undermining the biggest source of dealer profits — their service departments…”
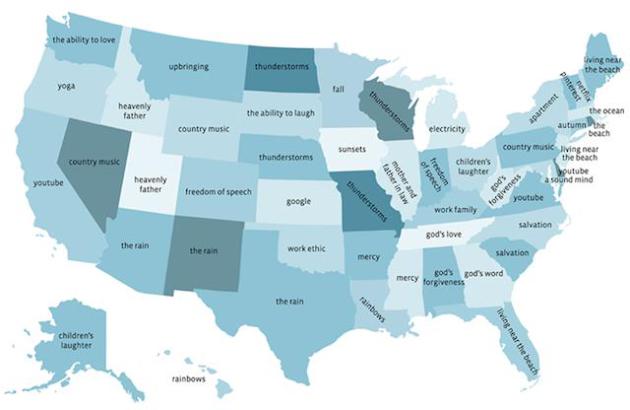
This Map Shows What People Are Most Thankful For in Each State. Minnesotans are most thankful for “fall”; Wisconsin residents most thankful for “thunderstorms”. Really? Mother Jones drills down: “Earlier this week, Facebook’s data team crunched the numbers on what users say they are most “thankful” for. The top two overall results were predictably “friends” and “family,” which is heartwarming but sort of a snooze…”

TODAY: Chilled sunshine, dry. Winds: N 10-15. High: near 30
FRIDAY NIGHT: Clear and chilly. Low: 14
SATURDAY: Blue sky, thawing out a little. Winds: SW 7-12. High: 36
SUNDAY: Partly sunny, seasonably cool. Winds: W 5-10. Wake-up: 17. High: 38
MONDAY: Clouds increase, light snow late. Wake-up: 25. High: 37
TUESDAY: Slushy mix, potential for a couple inches? Wake-up: 30. High: 34
WEDNESDAY: Slick start? Clearing skies. Wake-up: 22. High: 32
THURSDAY: Plenty of sun, turning milder. Wake-up: 24. High: near 40
Climate Stories…
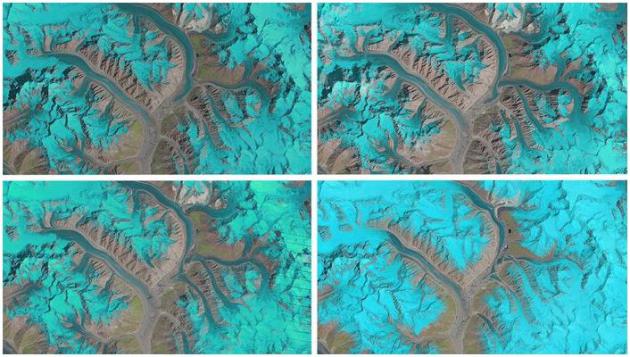
ESA Animations Show 25 Years of Glacier Movement in a Single Second. Gizmag has the story – here’s the intro: “A researcher at Switzerland’s University of Zurich has combined 25 years worth of satellite imagery to show the complex behavior of glaciers in a single second. The effort made use of data collected by NASA’s Landsat satellites, focusing on the Karakoram mountain range in Asia. The animations were created by glaciologist Dr. Frank Paul, and form part of the ESA’s Climate Change Initiative, which is combining datasets to build the best possible picture of glacier movement. The GIFs were made by combining between seven and 15 false-color images taken by three different Landsat satellites between the years 1990 and 2015. The glaciers can be seen in light blues to cyan, with water in dark blue, vegetation in green, bare ground in brown and clouds in white…”

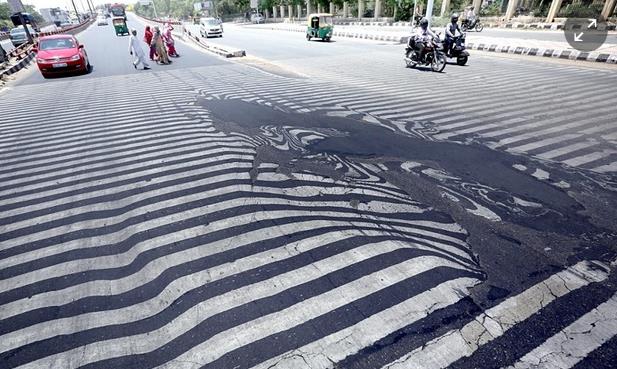
Study Drives a Nail into the Global Warming “Pause” Myth. Here’s the introduction to a recap at The Guardian: “Despite the organization and funding behind groups which try to cast doubt about the causes and implications of climate change, the facts have spoken. The world continues to warm and their favorite myths have died. We know that human-emitted heat-trapping gases warm the planet. In fact, this has been known for well over a century. With modern instruments (like ocean thermometers and satellites among others) we are now measuring the change. With advanced climate models, we can predict the changes. The measurements and the predictions are in excellent agreement, despite what cable news and second-rate skeptical scientists say…”
Photo credit above: “Road markings appear distorted during a heatwave, in New Delhi, India, 27 May 2015.” Photograph: Harish Tyagi/EPA.
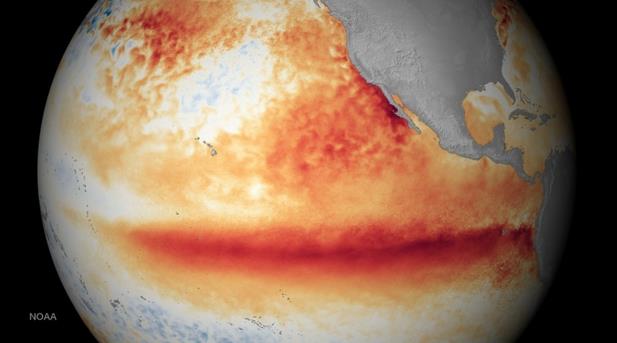
New Study Finds No “Substantive Evidence” of a Global Warming “Pause”. Chris Mooney reports on a new study that confirms there never was a warming hiatus – the warming is uneven but NASA data confirms NOAA’s recent findings; here’s an excerpt of his story at The Washington Post: “Even as Lamar Smith (R-Tx.), chairman of the House Committee on Science, Space, and Technology, continues to investigate a high profile study from federal scientists debunking the idea of a global warming slowdown or “pause,” a new study reaches the same conclusion — in a different yet complementary way. “There is no substantive evidence for a ‘pause’ or ‘hiatus’ in warming,” write Stephan Lewandowsky, a professor at the University of Bristol in the UK, and two colleagues in Tuesday’s Nature Scientific Reports. “We suggest that the use of those terms is therefore inaccurate...”
Image credit above: “This National Oceanic and Atmospheric Administration (NOAA) image shows the satellite sea surface temperature departure for the month of October 2015, where orange-red colors are above normal temperatures and are indicative of El Nino.” (AFP Photo/Handout/NOAA)
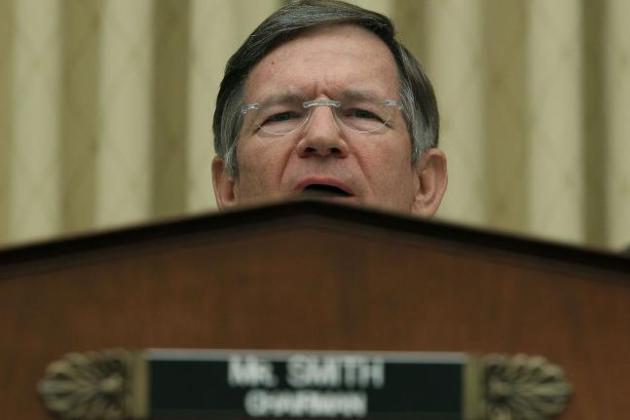
Lamar Smith is Hot and Bothered about Climate Science. US News explains the probe of NOAA data and studies on the alleged “pause” and how it’s become just the latest political football in Washington D.C. Here’s an excerpt: “…Some see a bit of a parallel between the Soviet-style intimidation and a recent campaign in the House Science, Space and Technology Committee, where Chairman Lamar Smith has pressed forward with a probe questioning the processes and findings of a federal scientific agency – one that has led critics to accuse the Texas Republican of abusing his power and to warn of a chilling effect on further scientific research. Smith has demanded via subpoena, public pronouncements and heated letters that the National Oceanic and Atmospheric Administration turn over internal emails on global warming research. The Texas Republican also has sought to bring agency staffers and NOAA Administrator Kathryn Sullivan into closed-door, deposition-like interviews...”
Photo credit above: “House Science Committee Chairman Lamar Smith, R-Texas, has put federal climate scientists in his crosshairs.”
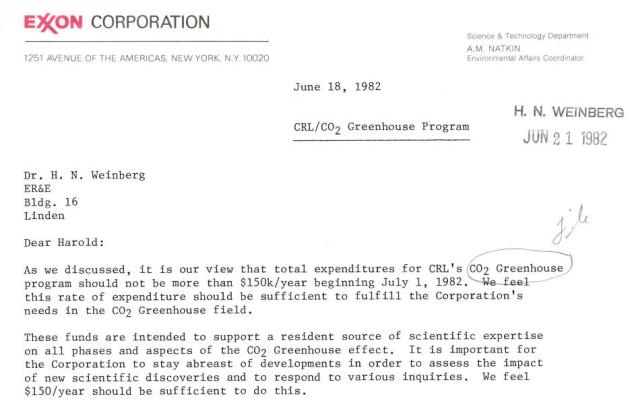
Exxon Made Deep Cuts in Climate Research Budget in the 1980s. Following up their 6-part series, InsideClimate News has the latest installment on Exxon’s climate science research and the mixed messages they were sending at the time; here’s an excerpt: “…But several documents uncovered by ICN show that the budget cuts during the 1980s were steep and sudden. The cuts reversed the course that the company followed in the late 1970s, when top company scientists warned Exxon’s management for the first time of the risks of climate change, and launched internal research programs unparalleled among its oil industry peers. ICN provided an Exxon spokesman copies of the documents being published today and requested any additional information about climate research spending during the 1980s, the period closely examined in ICN’s series, “Exxon: The Road Not Taken.” The spokesman, Alan Jeffers, declined to provide any additional budget numbers...”
