28 F. high in the Twin Cities Tuesday.
24 F. average high on January 27.
45 F. high on January 27, 2015.
January 28, 2006: A record high temperature of 50 degrees is set at the Eau Claire Regional Airport.
5-Day January Thaw
Hints of a Plowable Snow Next Week?
There is no such thing as a “weather expert”. I am reminded, daily, of the depths of my ignorance. Just keeping up with emerging science, new papers, trends and breakthroughs is daunting. So much noise – so little wisdom.
Today’s weather blog includes these nuggets: shoveling snow kills or injures an average of 11,500 Americans every winter. Good incentive to remain on the couch and wait for spring.
Hurricane Hunter aircraft probed Saturday’s mega-blizzard off the East Coast, trying to “initialize” NOAA’s models with better data. Every El Nino is different; NOAA sent a fleet of planes, ships and weather balloons into the Pacific to get a better grasp on how El Nino warm phases may evolve in a warming world.
That same El Nino should, on paper, keep us milder than average into the spring. But there will be spasms of cold and snow though.
Models hint at a sloppy southern storm brushing Minnesota with a potentially plowable snowfall next Tuesday. By late next week highs may be stuck in the teens – so enjoy our 5-day thaw.
January should wind up milder than average. Again.
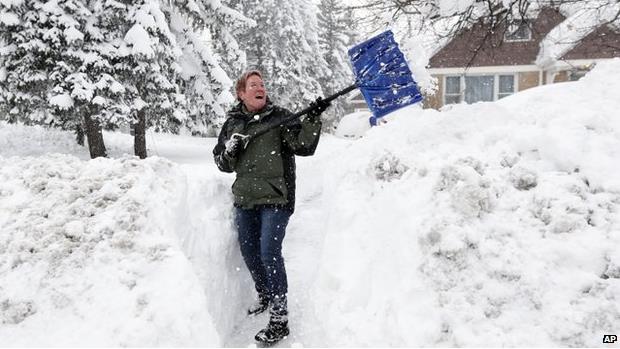
Why Snow Shoveling is an Unusually Deadly Type of Exercise. Atlas Obsura had a few fascinating nuggets in a recent article; here’s a clip: “…A few years ago, Ohio researchers clocked around 11,500 snow shoveling injuries and deaths annually in the United States, with over half being cardiac events. (Normally, cardiac problems account for around 10 percent of hospital visits, according to the Washington Post.) Another study, from 1990 to 2006, found over 1,600 fatalities. Another study, from 1990 to 2006, found over 1,600 fatalities….The connection between snow shoveling and heart attacks is fairly well-documented, but the reasons. behind the correlation go beyond the fact that shoveling snow is intense exercise—it’s a very specific kind of exercise..”

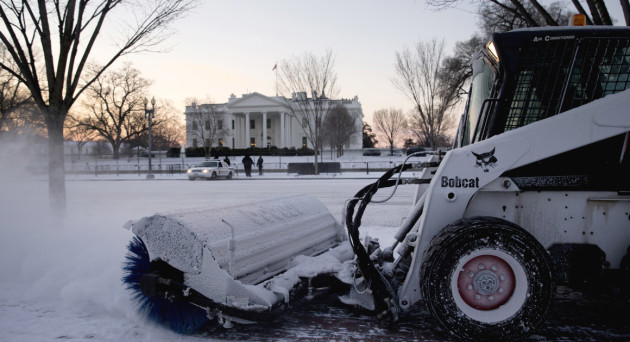
Here’s Why Cold and Snow Create Major Problems at Airports. If you’re a frequent flier this may help explain some of the pain waiting at your favorite airport gate, courtesy of Yahoo Finance: “…Ice on the ground makes things tricky, too. Last year, New York’s JFK Airport was shut down for several hours when a Delta plane skidded off the runway into the snow. (No injuries were reported.) The problem is that while planes can be de-iced (usually by spraying them with a mix of water and glycol alcohol), getting ice off a runway when the temperatures are low and there’s no sunshine is much harder. “There’s hardly anything you can do,” Jack Gartner, who worked in operations at New York airports for over 30 years, told Business Insider…”
The Most Ominous Snow Forecasts for New York Were Right. So many models, so much noise, so little wisdom. We are drowning in models – but which one to believe, and when? Here’s a clip from fivethirtyeight.com: “One of the hardest tasks in weather forecasting is projecting snow totals. We saw its perils in January 2015, when meteorologists wiped egg off their faces because New York City didn’t get anywhere near the foot and half or more that was forecast. This weekend, the exact opposite is happening: New York City is getting far more snow than the forecast of 7 to 12 inches from the National Weather Service, which was issued less than 24 hours before the storm hit the city.1 It’s the perfect example of why forecasts that vary based on probability are so important, and why outlier predictions should not be dismissed...”

Hurricane Hunters Gather Forecast Data on Record-Breaking Blizzard. They’ve been probing major winter storms for years, and last weekend’s East Coast mega-blizzard was another reminder of the critical importance of having better data available to feed the models; here’s an excerpt from The U.S. Air Force: “The Hurricane Hunters of the 53rd Weather Reconnaissance Squadron flew a different kind of mission from Keesler Air Force Base Jan. 22 to gather data on the blizzard that hit the Eastern Seaboard. The blizzard began dropping snow on the area early Jan. 22, and was a record-setter for three cities, leaving 29.2 inches in Baltimore, 31.9 inches in Allentown, Pennsylvania, and 34 inches in Harrisburg, Pennsylvania, according to the National Weather Service. The 53rd WRS crew flew along the eastern coast from Florida up to the New York City area over the Atlantic Ocean, dropping sondes ahead of the storm to gather information and to send it back to the NWS, where forecasts and predictions are made…”
Photo credit above: “A 53rd Weather Reconnaissance Squadron WC-130J Hercules, based at Keesler Air Force Base, Miss., flies above the record-setting blizzard the morning of Jan. 23, 2016. The crew gathered data on the storm for the National Weather Service.” (U.S. Air Force photo/Staff Sgt. Nicholas Monteleone)


Ocean Warming Is Making Floods Worse, Study Finds. It will become increasingly difficult to deny rising seas in the years ahead; here’s an excerpt from Climate Central: “…Water expands as it heats up, and oceans have been absorbing most of the heat trapped by greenhouse gases released by fossil fuel burning, deforestation and animal farming. A new study blames expansion of warming waters for as much sea level rise from 2002 through 2014 as the melting of all the glaciers and the Greenland and Antarctic ice sheets combined. “Satellite observations show that sea level rise over the last decade is explained, by about 50 percent, by thermal expansion,” said Roelof Rietbroek of the University of Bonn, who led the research, which was published Monday in Proceedings of the National Academy of Sciences…”
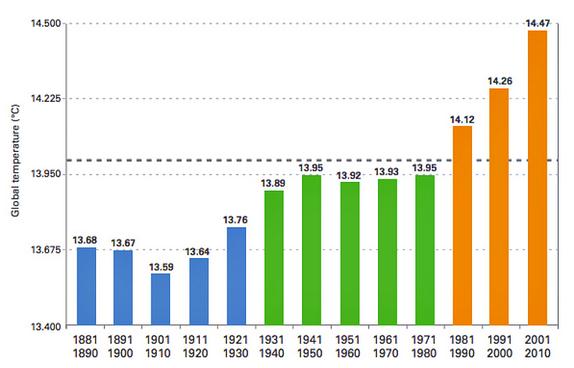
Oceanic Warming Trend. An estimated 93% of additional heat energy produced by greenhouse gases, mainly CO2, is going into the world’s oceans. This not only results in thermal expansion and rising sea levels, but higher water vapor levels, more moisture available for developing storms, especially close to the coast. Graphic above: Larry Hamilton.
Drone Captures New Jersey Storm Surge Flooding. A post at patch.com caught my eye, showing the extent of flooding along the southern New Jersey coast. Not on the scale of “Sandy” in 2012, but there was disruption: “Severe flooding overwhelmed much of Cape May County over the weekend, as documented in the attached video posted on Facebook by Seven Mile Times. The footage shot by a drone shows a town engulfed by water as of 8:30 a.m. Sunday morning. In Ocean City, much of the flood water has receded, but power outages remain in the county. Flooding delayed Atlantic City Electric’s efforts to deal with many of the outages on the coast over the weekend…” (Drone footage: Seven Mile Times).
4 Things To Know About This Weekend’s Coastal Flooding. WXshift has an interesting post; here’s a clip that caught my eye: “…The high frequency of these flood events may feel very much like climate change. However, it’s important that we step back and make sure our perspectives are scientifically sound before we slap a climate change label on what appears like a certain pattern. Sea level rise is an important component of these floods, and that is a clear signature of climate change. For most of the U.S. coastline, sea-level rise is a persistent, long-term threat, with surprisingly pernicious impacts. In coastal New Jersey the rate of relative sea level rise is around 1.0 -1.5 feet per century. The graph below shows a rate of 1.34 feet per 100 years at Atlantic City. Although this rate may not sound substantial, the impacts of sea level rise are profound…”
Graphic credit above: “The long-term sea level trend in Atlantic City depicts an average rise of 1.34 ft (0.41 m) per 100 years.” Credit: NOAA Tides and Currents.
How Much Did El Nino Boost Global Temperature in 2015? Carbon Brief takes a look at new research that tries to provide perspective; here’s an excerpt: “Almost as soon as the news broke that 2015 was the hottest year in the modern record, the conversation quickly turned to how much of the record-breaking warmth was down to climate change and how much to the Pacific weather phenomenon known as El Niño. Carbon Brief has spoken to climate scientists working on this question, who all seem to agree El Niño was responsible for somewhere in the region of 10% of the record warmth in 2015. But while the science seems pretty clear, these numbers got somewhat lost in the media coverage…”
Is Twitter a Better Source of Breaking Storm News? I’m sure this will generate howls of protests from TV meteorologists, but Twitter is a powerful tool, if used appropriately. For pinpointing and geolocating storm damage and impacts it’s an incredible resource, but will Twitter or Facebook be able to provide context, analysis and perspective? That’s where local and national meteorologists can still add considerable value. Here’s an excerpt from the UK’s Daily Mail: “The US is glued to the news as winter storm Jonas crawls up the East Coast, but a new study finds social media sites might be better sources for storm news. After examining the flood that hit Colorado in 2013 researchers were able to pinpoint distressed areas using remote sensing, Twitter and Flickr data. “By monitoring tweets and other social media posts, these agencies could identify impacted areas in need of help faster than ever before...”
Image credit above: “Screenshot of CarbonScanner during the 2013 Boulder floods showing filtered and geolocated tweets captured by scanning application in real time (a), and the alert box generated for which remote-sensing data collection was tasked.”

Companies Have Environmental “Blind Spot” in Supply Chains: Study. Here’s the intro to a Reuters story: “Many multinationals have a blind spot in judging the environmental impact of their suppliers’ operations, adding to corporate risks linked to climate change, according to a study published on Tuesday. The report, by non-profit consultancies CDP and BSR working with 75 companies such as Dell [DI.UL], Unilever and Wal-Mart Stores on environmental risks, said that only 49 percent of almost 8,000 suppliers responded last year when asked about their environmental footprint...”

The U.S. Could Switch to Mostly Renewable Energy, No Batteries Needed. Here’s an excerpt of an important story at Smithsonian: “…Our idea was if we had a national ‘interstate highway for electrons’ we could move the power around as it was needed, and we could put the wind and solar plants in the very best places,” says study co-author Alexander MacDonald, who recently retired as director of NOAA’s Earth System Research Laboratory in Boulder, Colorado. Several years ago, MacDonald was curious about claims that there was no technology available that could mitigate carbon dioxide emissions without doubling or tripling the cost of electricity. When he investigated the issue, he discovered that the studies behind the claims did not incorporate the country’s variable weather very well...”
Scaling Renewables. Yes, it can be done, and faster than many people believe, with existing technologies, and no material increase in electricity costs on the grid. Here’s an excerpt of the paper referenced above at Nature Climate Change: “…Our results show that when using future anticipated costs for wind and solar, carbon dioxide emissions from the US electricity sector can be reduced by up to 80% relative to 1990 levels, without an increase in the levelized cost of electricity. The reductions are possible with current technologies and without electrical storage. Wind and solar power increase their share of electricity production as the system grows to encompass large-scale weather patterns. This reduction in carbon emissions is achieved by moving away from a regionally divided electricity sector to a national system enabled by high-voltage direct-current transmission.”
* The NOAA study highlights are here, courtesy of NOAA News.
Solar Panel Costs Set To Fall 10% a Year. In a related story, here’s a clip from Climate Home: “Solar power costs are tumbling so fast the technology is likely to fast outstrip mainstream energy forecasts. That is the conclusion of Oxford University researchers, based on a new forecasting model published in Research Policy. Since the 1980s, panels to generate electricity from sunshine have got 10% cheaper each year. That is likely to continue, the study said, putting solar on course to meet 20% of global energy needs by 2027...”
Photo credit above: Lance Cheung/Flickr.

Brazil Is “Badly Losing” the Battle Against Zika Virus, Says Health Minister. Is this looking more and more like a bad sci-fi thriller or is it just me? It’s the stuff nobody seems coming that worries me. Here’s the intro to a story at The Guardian: “Brazil’s health minister was warned that the country is “badly losing” the battle against the mosquito blamed for spreading Zika virus, which has been linked to birth defects. Marcelo Castro said that nearly 220,000 members of Brazil’s armed forces would go door-to-door to help in mosquito eradication efforts, according to Rio de Janeiro’s O Globo newspaper. It also quoted Castro as saying the government would distribute mosquito repellent to some 400,000 pregnant women who receive cash-transfer benefits…”
Photo credit above: “A local worker disinfects the famous Sambadrome in Rio de Janeiro, Brazil, on 26 January 2016 in an effort to protect next month’s Carnival parades Zika-carrying mosquitoes.” Photograph: Marecelo Sayao/EPA

Argentina Scrambles to Fight Biggest Plague of Locusts in 60 Years. Don’t sweat the snow and ice. Here’s an excerpt from The New York Times: “….It’s the worst explosion in the last 60 years,” Diego Quiroga, the agriculture agency’s chief of vegetative protection, said in a telephone interview. “It’s impossible to eradicate; the plague has already established itself. We’re just acting to make sure it’s the smallest it can be and does the least damage possible…”
Photo credit above: “A swarm of locusts in September in the Lavalle area of Santiago del Estero Province, Argentina. Farmers last year reported seeing swarms that were four miles wide and two miles high.” Credit SENASA
Snowboarding With the NYPD. If you haven’t seen this it’s worth your time – a YouTube clip of entrepreneur Casey Neistat “surfing” the streets of Manhattan. It isn’t often you get to pull this off (and document it!) And no, don’t try this at home.
Throw Away The Shovel: “Electric Concrete” Melts Snow. It can’t come fast enough for my broken ankle, but here’s another potentially game-changing innovation, courtesy of Christian Science Monitor: “For commuters negotiating post-blizzard conditions, take heart: electric snow-melting concrete may be coming to a city near you. Dr. Chris Tuan, a professor of civil engineering at the University of Nebraska-Lincoln, and his team of researchers have developed a concrete mixture prototype that melts away falling snow and ice by conducting electricity. Steel rods beneath the concrete’s surface connect to electrodes, which connect to a 120-volt AC power source…”
Image sources: Nebraska Department of Roads.
TODAY: Milder, few flurries. Snowy coating up north. Winds: SW 15-25. High: 36
WEDNESDAY NIGHT: Mostly cloudy. Low: 29
THURSDAY: More clouds than sun, dry. Winds: NW 10-15. High: 33
FRIDAY: Next clipper, sloppy mix? Wake-up: 24. High: 37
SATURDAY: Overcast, drizzle or flurries. Wet roads. Winds: SW 7-12. Wake-up: 31. High: 37
SUNDAY: Mostly cloudy, pretty quiet. Winds: W 8-13. Wake-up: 28. High: 33
MONDAY: Mostly gray, no drama yet. Wake-up: 25. High: 31
TUESDAY: Potential for a few inches of snow. Potentially plowable, especially south/east of MSP. Wake-up: 23. High: 25
Climate Stories…
Third Annual Minnesota State Climate Adaptation Conference on Thursday. The conference is in Minneapolis – there are still a few tickets available. If your company, organization or state agency is being impacted a rapidly changing climate you might want to consider signing up. I’m moderating a business panel that includes 3M, Best Buy and General Mills – trying to understand how Minnesota companies are already factoring climate change into business models, supply chain management, deployment and operation of facilities, personnel training, marketing and new product development.
The state’s Climate Adaptation Partnership Committee (CAP) was formed in 2008. This committee is multi-faceted with representatives from state and federal agencies, the business community, academic institutions, county and municipal units of government, the Science Museum of Minnesota, and NGOs. Our purposes are to improve climate literacy; sponsor, produce, and promote educational resources related to climate change and sustainability; and to host an annual statewide meeting that is dedicated to sharing knowledge and experience related to climate adaptation practices that improve the environment and the quality of life in our state. The annual meeting usually draws 250-350 people and is well covered by the media. More information about CAP, including registration instructions for the Third Annual CAP Conference: “Transforming Awareness Into Action” can be found at this web site:
https://www.wrc.umn.edu/news-events/climate-adaptation-conference
Yes, Actually, Global Warming Probably Helped Supersize This Weekend’s Blizzard. Here’s a clip from Vice News: “…We expect the Atlantic to continue to warm as we continue to increase greenhouse gas concentrations through fossil fuel burning and other activities,” Mann said. “Peer-reviewed scientific studies suggest we are likely to see more of these sorts of coastal storms in the future because of human-caused climate change.” In addition to the El Niño, the warm coastal waters may be influenced by a mass of cold water in the North Atlantic. This icy patch south of Greenland contrasts what has otherwise been the warmest year on record and may be the result of freshwater run-off from the country’s melting glaciers…”
How Global Warming Helped Turn The Blizzard of 2016 Into a Record Storm. Meteorologist Eric Holthaus has more specifics at Slate; here’s an excerpt that caught my eye: “…There are a lot of reasons for this, including a big boost from a very strong El Niño (and some other factors that are, frankly, probably either random chance or not well understood), but there is clear evidence global warming is boosting the odds of recent big Northeast snowstorms. Among the clearest is Physics 101: A warmer atmosphere is able to hold more moisture, and thus can produce heavier precipitation (whether rain or snow) in a shorter amount of time. At the moment, exceptionally warm waters off the East Coast (as high as 76 degrees Fahrenheit!) are boosting the amount of water vapor in the air by about 10 to 15 percent, according to Kevin Trenberth of the National Center for Atmospheric Research…” (File photo: AP).
Is Climate Change Supercharging Storms Like Jonas and Sandy More Than We Thought? Joe Romm takes a look at ThinkProgress; here’s a clip: “…But the fact is that both East Coast SSTs and sea levels have been rising considerably faster than the global average. Recent research increasingly suggests that this apparent anomaly may not be random but rather driven in large part by global warming itself. Stefan Rahmstorf, Co-Chair of Earth System Analysis at the Potsdam Institute for Climate Impact Research, has published a summary of that research (some of which he himself conducted) in a must-read RealClimate post, “Blizzard Jonas and the slowdown of the Gulf Stream System.” Since higher sea surface temperatures helped drive record snowfall for Jonas, Rahmstorf asks why SSTs are so high on the East Coast, as shown in this graphic from Climate Reanalyzer…”
Graphic credit above: “Sea surface temperature (SST) anomalies for Sunday, January 24 showing very warm water off the East Coast and a cold blob of water south of Greenland. Recent climate research connects the two.”
Climate and Conflict: Why Politicians Should Understand How Climate Change Poses a Threat to Security. To use Pentagon jargon, climate volatility is a “threat multiplier”. Here’s a clip from a story at Chicago Policy Review: “…The authors review 55 papers regarding the relationship between conflict and climate change. They conclude that changes in climate conditions, such as temperature, rainfall, and water availability, influence the conditions under which certain social interactions occur, in both the short and long term, and thus may impact the probability and intensity of conflicts. The study finds that these results hold across geographic regions, different societies, and over time. The increased risk is observed for two categories of conflict: first, for interpersonal conflicts occurring between individuals, such as assault, murder, rape, road rage, or violence at sporting events or by the police; and, second, for intergroup conflicts, describing conflicts between groups of individuals, such as organized political violence, civil conflicts, riots, or land invasion…”
Record Warmth “Almost Certainly” Due To Humans, Scientists Say. Here’s a snippet from a Bloomberg Business story: “The odds are “vanishingly small” that recent years of record warmth aren’t due to human emissions of greenhouse gases, researchers in the U.S. and Germany said, adding to pressure on world governments to cut back on fossil fuel use. Thirteen of the 15 warmest years ever recorded were registered through 2014, the researchers at the Potsdam Institute for Climate Impact Research, or PIK, said Monday in the journal Nature. The odds of that occurring naturally range from one in 5,000 to one in 170,000, they wrote. Data showing 2015 is the warmest year ever were published after their study was completed, and would make the odds even slimmer, PIK said in an e-mailed statement...”
Please Stop Saying Humans Aren’t Causing Climate Change. Here’s a snippet from WIRED: “…The UN World Meteorological Organization (WMO) confirmed on Monday that the global average surface temperature in 2015 shattered all previous records and said 15 of the 16 hottest years on record have all occurred since 2000. “We have reached for the first time the threshold of 1C above pre-industrial temperatures. It is a sobering moment in the history of our planet,” said WMO secretary-general Petteri Taalas...”
Image credit above: “A map of temperature anomalies in 2015 compared to the long-term average.” NASA

South Florida Mayors Press Marco Rubio, Jeb Bush on Climate Change. Here’s the intro to a story at Naked Politics, in the Miami Herald: “Fifteen mayors from cities in Miami-Dade, Broward and Palm Beach counties wrote the two Miami candidates a letter asking them to meet with local leaders to “discuss the risks facing Florida communities due to climate change and help us chart a path forward to protect our state and the entire United States.” “As mayors representing municipalities across Florida, we call on you to acknowledge the reality and urgency of climate change and to address the upcoming crisis it presents our communities,” both letters begin. “Our cities and towns are already coping with the impacts of climate change today. We will need leadership and concrete solutions from our next president…”
Op-Ed: America’s Climate Refugee Crisis Has Already Begun. Here’s an excerpt from a story at The Los Angeles Times: “…In the decades to come, thousands more from along America’s most fragile shorelines will embark on a great migration inland as their homes disappear beneath the water’s surface. Over the last 10 years, the Isle de Jean Charles community in Louisiana has lost two-thirds of its residents to dislocation. In the Chesapeake Bay, Tangier Island’s shoreline recedes by about 14 feet a year. On Washington’s Olympic Peninsula, the Quinault Indian Nation relies on a 2,000-foot-long sea wall for protection until it can complete its move uphill. For them and the residents of dozens of other American towns and ultimately cities, the question is no longer what will be lost to climate change, but what will be saved…”
Photo credit above: “Two young boys walk along the boardwalk in the village of Newtok, Alaska in October of 2004.” (Jedediah R. Smith / For the Times).

Record Hot Years Near Impossible Without Manmade Climate Change. Here’s the introduction to a story at The Guardian: “The world’s run of record-breaking hottest years is extremely unlikely to have happened without the global warming caused by human activities, according to new calculations. Thirteen of the 15 hottest years in the 150-year-long record occurred between 2000-14 and the researchers found there is a just a 0.01% chance that this happened due to natural variations in the planet’s climate…”
What Are The Odds? Temperature Records Keep Falling. Following up on the story above, here’s an excerpt of a piece from Penn State climate scientists Michael Mann at livescience.com: “…While the precise results depend on various details of the analysis, for the most defensible of assumptions, our analysis suggests that the odds are no greater than one in 170,000 that 13 of the 15 warmest years would have occurred since 2000 for the Northern Hemisphere average temperature, and one in 10,000 for the global average temperature. Even when we vary those assumptions the odds never exceed one in 5,000 and one in 1,700, respectively…”
Graphic credit above: “Historical Northern Hemisphere mean-temperatures (black solid line) along with the estimated natural component alone (black dashed line) and five of the surrogates (colored curves) for the natural component. Temperature departures are defined relative to the long-term 1880 to 2015 average.”
Rapid, Affordable Energy Transformation Possible, Study Says. A story at phys.org made me do a triple-take; here are a couple of excerpts: “The United States could slash greenhouse gas emissions from power production by up to 78 percent below 1990 levels within 15 years while meeting increased demand, according to a new study by NOAA and University of Colorado Boulder researchers…”Our research shows a transition to a reliable, low-carbon, electrical generation and transmission system can be accomplished with commercially available technology and within 15 years,” said Alexander MacDonald, co-lead author and recently retired director of NOAA’s Earth System Research Laboratory (ESRL) in Boulder...
Map credit above: “A high-resolution map based on NOAA solar irradiance data showing one measure of solar energy potential across the United States.” Credit: Chris Clack/CIRE.
Read more at: http://phys.org/news/2016-01-rapid-energy.html#jCp
Read more at: http://phys.org/news/2016-01-rapid-energy.html#jCp
Read more at: http://phys.org/news/2016-01-rapid-energy.html#jCp
Read more at: http://phys.org/news/2016-01-rapid-energy.html#jCp
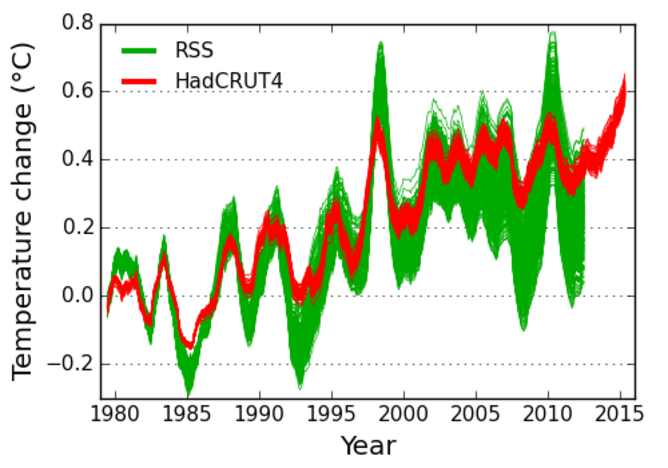
We Just Had The Hottest Year on Record. Where Does That Leave Climate Denial? Cue the conspiracy theories. Here’s a clip from The Conversation: “…Enter denial strategy two: that if every scientific agency around the world agrees on global warming, they must be engaging in a conspiracy! Far from being an incidental ornament, conspiratorial thinking is central to denial. When a scientific fact has been as thoroughly examined as global warming being caused by greenhouse gases or the link between HIV and AIDS, then no contrary position can claim much intellectual or scholarly respectability because it is so overwhelmingly at odds with the evidence. That’s why politicians such as Republican Congressman Lamar Smith need to accuse the NOAA of having “altered the [climate] data to get the results they needed to advance this administration’s extreme climate change agenda”. If the evidence is against you, then it has to be manipulated by mysterious forces in pursuit of a nefarious agenda...”
Graph credit: “Satellite data (green) has much more uncertainty than thermometer records (red).” Kevin Cowtan / RSS / Met Office HadCRUT4, Author provided.
